The Customer Acquisition Cost Formula - And How to Calculate It Without Lying to Yourself
The Quick Version
The customer acquisition cost formula is straightforward:
CAC = Total Sales & Marketing Costs / New Customers Acquired
Worked example: $250,000 in quarterly S&M spend / 300 new customers = $833 CAC. This formula is correct and almost certainly insufficient - keep reading for the adjustments that make it useful. Most CAC formulas skip the lag adjustment that can flip your channel decisions, and we'll show you exactly how in the section below.
CAC Is Rising. Your Formula Might Be Wrong.
Customer acquisition costs rose 40-60% between 2023 and 2025, driven by ad platform competition, privacy regulation, and unreliable attribution models. Most teams are optimizing a number they've calculated wrong.
Fix the measurement before you fix the metric. The basic formula gets you started, but the decisions about what goes in the numerator, which customers count in the denominator, and whether your attribution data is trustworthy - that's where the real work lives.
CAC vs CPA - Why It Matters
CPA is a campaign metric. CAC is a business metric. Conflating them leads to genuinely bad decisions.
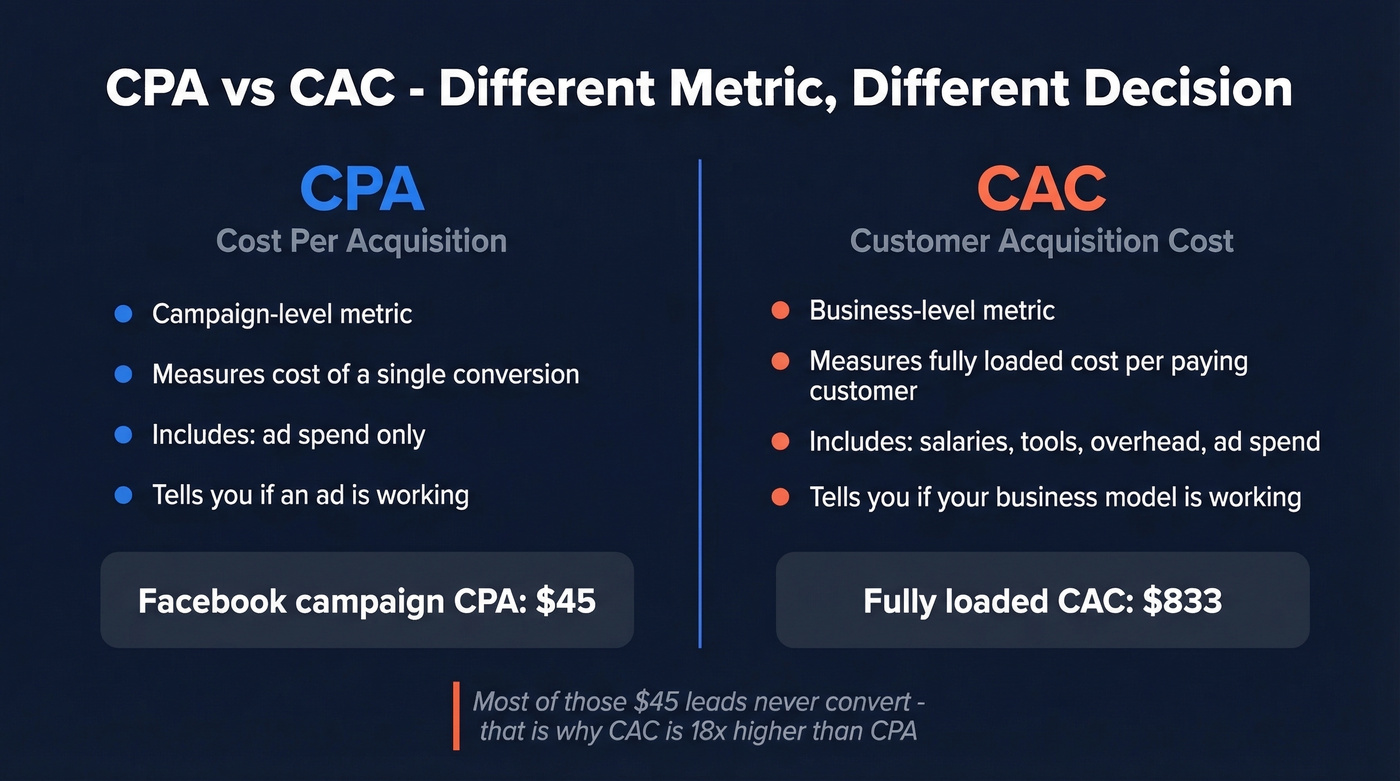
CPA measures the cost of a specific conversion at the campaign level - a lead, a signup, a demo request. CAC measures the fully loaded cost to acquire a paying customer, including salaries, tools, and overhead. Put simply: CPA tells you if an ad is working. CAC tells you if your business model is working.
A Facebook campaign with a $45 CPA looks great until you realize your fully loaded CAC is $833 because most of those leads never convert. Different metric, different decision. If you need a deeper breakdown of CAC vs CPA, start there.
What Goes Into Your CAC Numerator
This is where most teams undercount. Your numerator needs everything that contributes to acquiring a new customer.
Direct costs are the easy ones: ad spend, content production, event sponsorships, agency fees, and paid tool subscriptions. Most teams get these right.
Indirect costs are where the numerator gets honest. Sales and marketing salaries need to be pro-rated based on time spent on acquisition. If an SDR earns $100,000/year and spends 70% of their time on new customer acquisition, that's $5,833/month in your CAC numerator. The remaining 30% - account management, upsells, internal projects - stays out.
Software subscriptions count too. Your CRM, sequence platforms, and email verification tools all go straight into the numerator. And the cost differences matter: a data platform charging $1/lead versus one at $0.01/lead creates a meaningful gap over thousands of contacts per quarter.
Don't forget overhead allocation. Office space, IT infrastructure, and management time all contribute. Excluding salaries and overhead often understates your true CAC by 30-50%.
How to Actually Calculate CAC
The Basic Formula
SaaSCo spent $250,000 on sales and marketing last quarter and acquired 300 new customers.
CAC = $250,000 / 300 = $833
Simple. And potentially misleading, because it assumes every dollar spent in Q1 produced a customer in Q1. For most B2B companies, that's not how the funnel works.
Lag-Adjusted CAC
This is the version that actually matters. Here's the core point: if your sales cycle is 60 days, March's customers came from January's marketing spend. Dividing same-month spend by same-month customers creates fiction.
CAC = (Marketing Expenses [n-60] + 1/2 Sales Expenses [n-30] + 1/2 Sales Expenses [n]) / New Customers [n]
The sales cost split reflects that sales effort spans the middle and end of the cycle. Marketing spend gets the full lag offset.
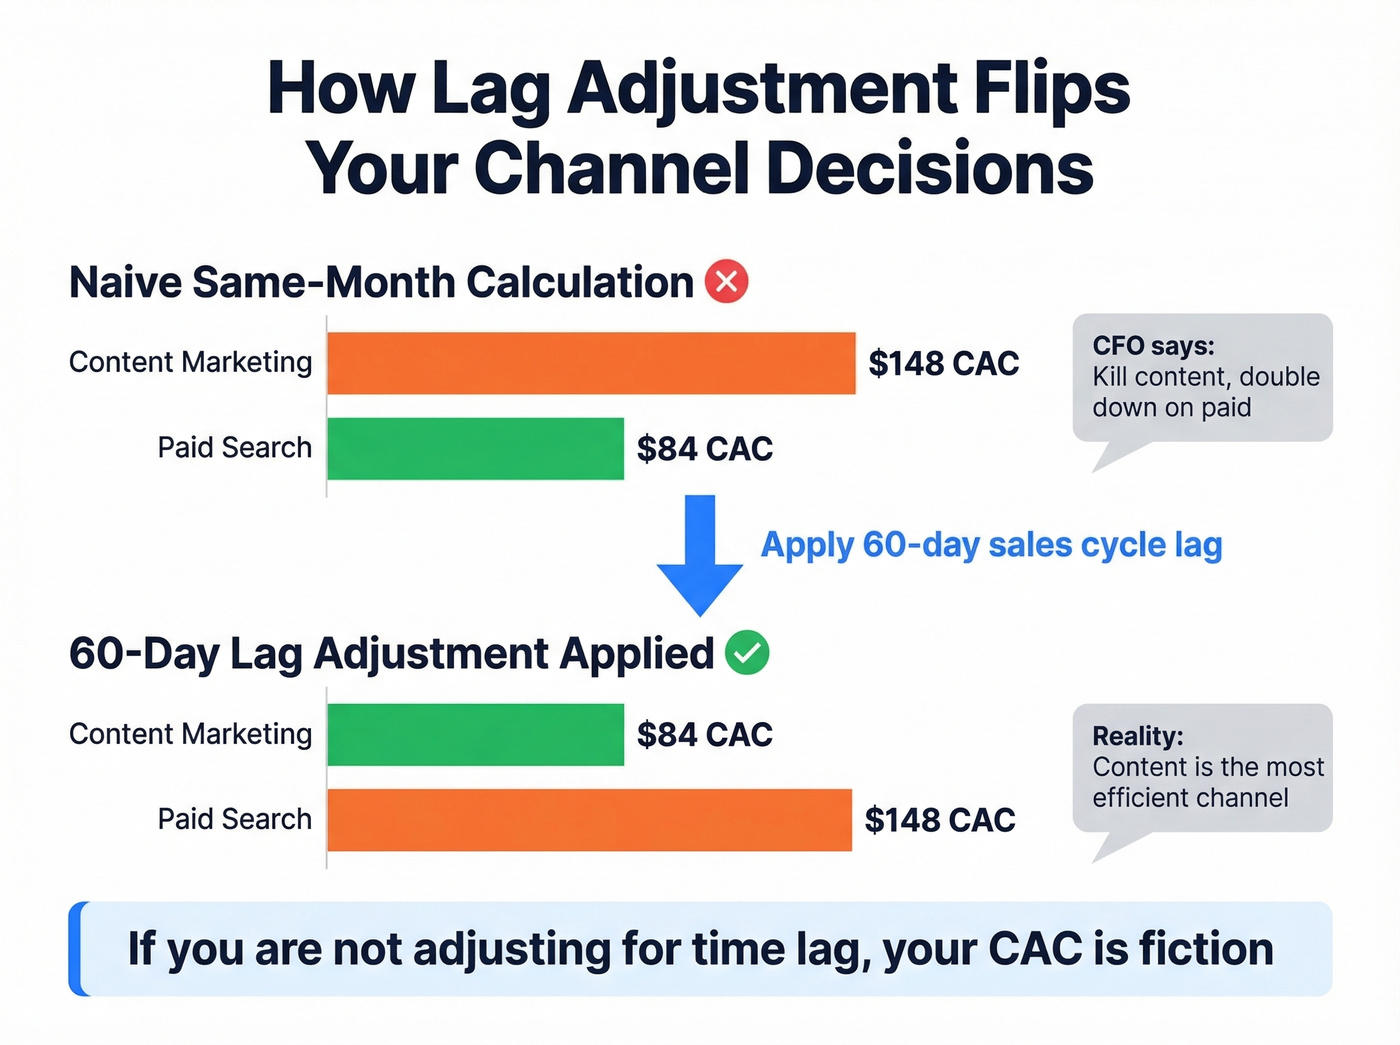
Here's where it gets dangerous. Say SaaSCo's naive same-month calculation shows $148 CAC for content marketing and $84 for paid search. The CFO wants to kill content and double down on paid. But when you apply the 60-day lag, content's CAC drops to $84 and paid search jumps to $148. The channel the CFO wants to kill is the most efficient one.
We've seen this exact pattern play out - teams making budget decisions on lagged data without the lag adjustment. If you're not adjusting for time lag, your CAC is fiction. For a SaaS-specific walkthrough of Lag-Adjusted CAC, this is a solid reference.
Blended vs New vs Channel CAC
Blended CAC is your all-in acquisition cost when you include expansion in the denominator. It's the number your board often sees. It looks better than reality because expansion dilutes the denominator.
New CAC isolates first-time customers only. This tells you whether your growth engine is efficient or subsidized by upsell economics.
Channel CAC breaks the number out by acquisition source. This drives budget allocation. You need all three, but for different conversations.
You just read that a data platform charging $1/lead vs $0.01/lead creates a meaningful CAC gap. Prospeo delivers 98% verified emails at ~$0.01 each - 90% cheaper than ZoomInfo. That's thousands saved per quarter flowing straight out of your CAC numerator.
Fix your CAC formula by fixing what you pay for data.
Common CAC Calculation Mistakes
1. Same-month spend/conversion mismatch. If your sales cycle is 45+ days and you're dividing March spend by March customers, you're making decisions on noise.
2. Attribution bias across platforms. Facebook's in-platform reporting attributes roughly 10x the revenue that web analytics confirms because it counts view-through conversions. Google counts click-through. Normalize by choosing a consistent attribution model - first-touch, last-touch, or multi-touch - and applying it across all channels.
3. Revenue-based LTV instead of contribution margin. A hybrid SaaS founder on r/startups illustrated this perfectly: $100 revenue per customer, $80 in consultant costs. Revenue LTV produced a fantasy 61:1 ratio. Contribution margin? 13:1. Still healthy, completely different story.
4. Excluding salaries and overhead. In our experience, teams that leave out SDR and AE salaries understate CAC by around 30%. Pro-rate by acquisition time and include them.
5. Mixing new and returning customers. A returning customer who re-subscribes after churning didn't cost the same as a net-new logo. Blending them deflates your CAC and hides the true cost of growth.
LTV:CAC Ratio - Why 3:1 Is a Floor
The LTV:CAC ratio tells you whether your acquisition economics work. The formula: LTV / CAC. The interpretation is where teams get lazy.
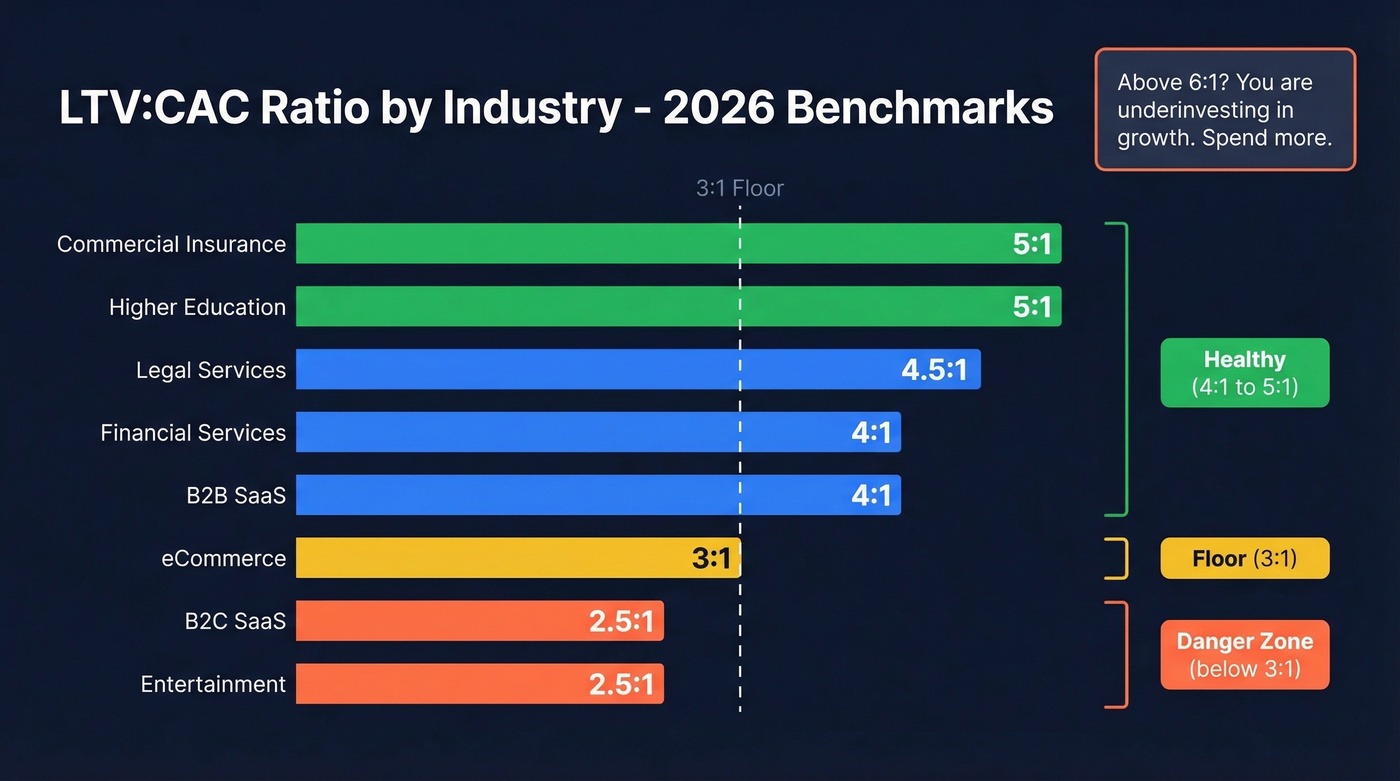
3:1 is a floor, not a goal. And it varies dramatically by industry. FirstPageSage's dataset across 29 industries shows the spread:
| Industry | LTV | CAC | Ratio |
|---|---|---|---|
| Commercial Insurance | $2,975 | $595 | 5:1 |
| Higher Education | $7,118 | $1,424 | 5:1 |
| Legal Services | $4,117 | $915 | 4.5:1 |
| Financial Services | $3,692 | $923 | 4:1 |
| SaaS (B2B) | $956 | $239 | 4:1 |
| eCommerce | $255 | $84 | 3:1 |
| SaaS (B2C) | $583 | $233 | 2.5:1 |
| Entertainment | $823 | $329 | 2.5:1 |
A ratio above 6:1 isn't a win - it's a signal you're underinvesting in growth. If you can acquire customers at 6:1 economics, spend more.
CAC Payback Period
Payback period answers a different question than LTV:CAC: not "is this profitable?" but "when do I get my money back?" The gross-margin-adjusted formula:
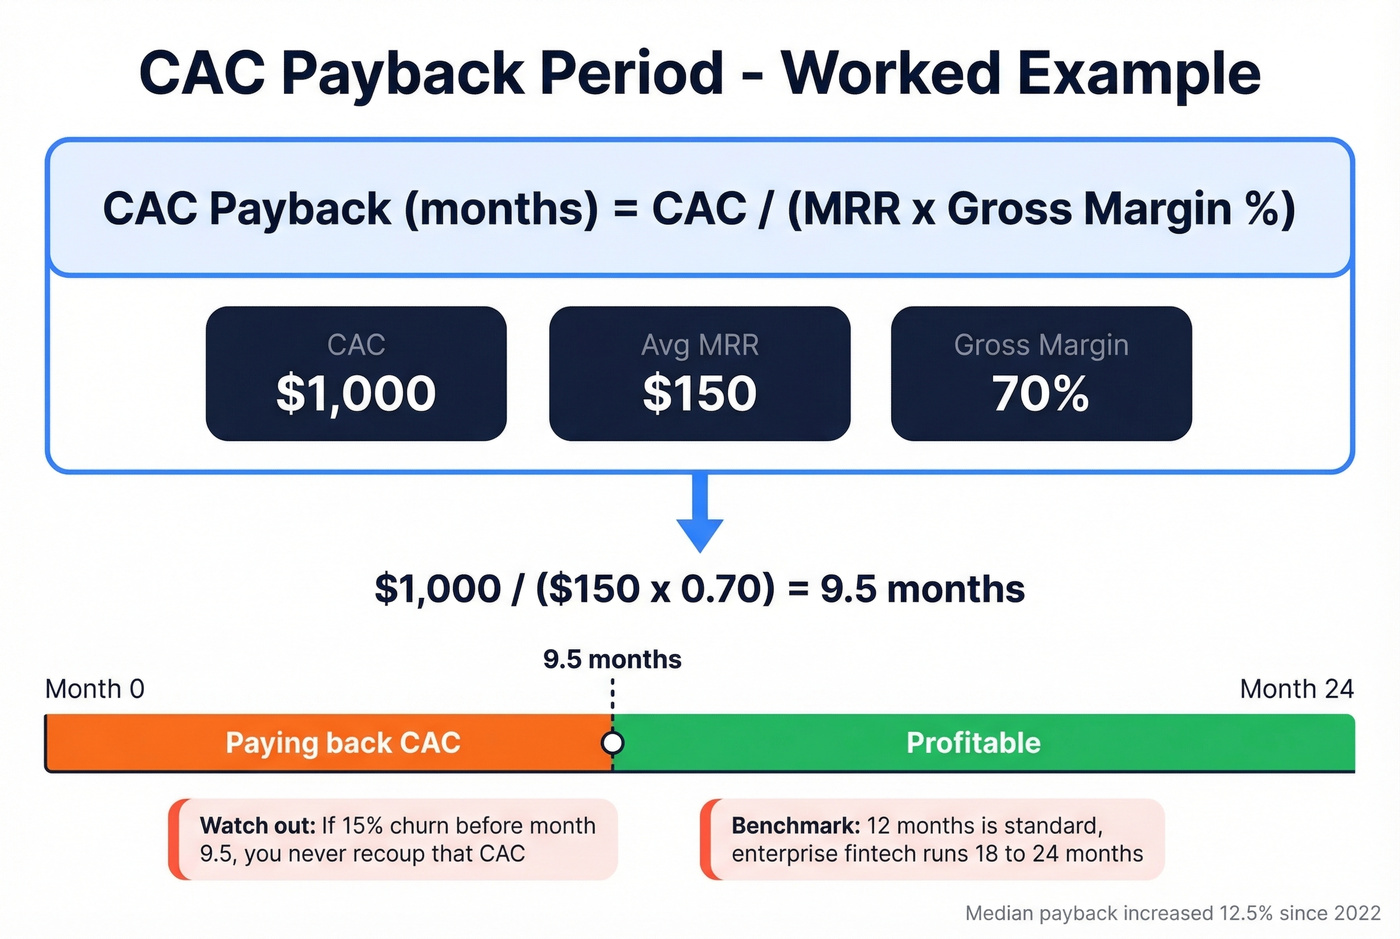
CAC Payback (months) = CAC / (MRR x Gross Margin %)
SaaSCo's CAC is $1,000, average MRR per new customer is $150, gross margin is 70%. Payback = $1,000 / ($150 x 0.70) = 9.5 months. That's solid - common wisdom puts 12 months as the benchmark, and enterprise fintech companies routinely run 18-24 months.
This formula doesn't account for churn. If 15% of SaaSCo's customers cancel before month 9.5, the company never recoups that acquisition cost - that's hidden CAC debt. (If you want to model this properly, start with a clean churn analysis.)
It also ignores the time value of money. A 9.5-month payback at a 15% cost of capital is materially different from 9.5 months at 5%. Median CAC payback has increased 12.5% since 2022, which means these caveats are getting more expensive to ignore.
2026 CAC Benchmarks
By Industry
The gap between organic and paid acquisition is striking. Organic CAC runs 40-60% cheaper than paid across nearly every industry.
| Industry | Organic | Paid | Combined |
|---|---|---|---|
| Higher Education | $862 | $1,985 | $1,423 |
| Legal Services | $584 | $1,245 | $915 |
| Financial Services | $644 | $1,202 | $923 |
| Real Estate | $660 | $1,185 | $923 |
| Manufacturing | $662 | $905 | $784 |
| Business Consulting | $410 | $901 | $656 |
| Commercial Insurance | $590 | $600 | $595 |
| IT & Managed Services | $325 | $840 | $583 |
| B2B SaaS | $205 | $341 | $273 |
| eCommerce | $87 | $81 | $84 |
The eCommerce anomaly - where paid is actually cheaper than organic - is common in DTC performance marketing. For everyone else, organic investment pays back at a structurally lower CAC.
By Channel
| Channel | Avg CAC (B2B) | Notes |
|---|---|---|
| Referral | $150 | Lowest; hard to scale |
| Facebook Ads | $230 | View-through attribution inflates platform-reported performance |
| SEO / Organic | $480-$942 | Drops once established |
| Paid Search | $802 | Google Ads, B2B avg |
| LinkedIn Ads | $982 | High intent, high cost |
| Outbound Sales | $1,980 | Highest; often highest ACV |
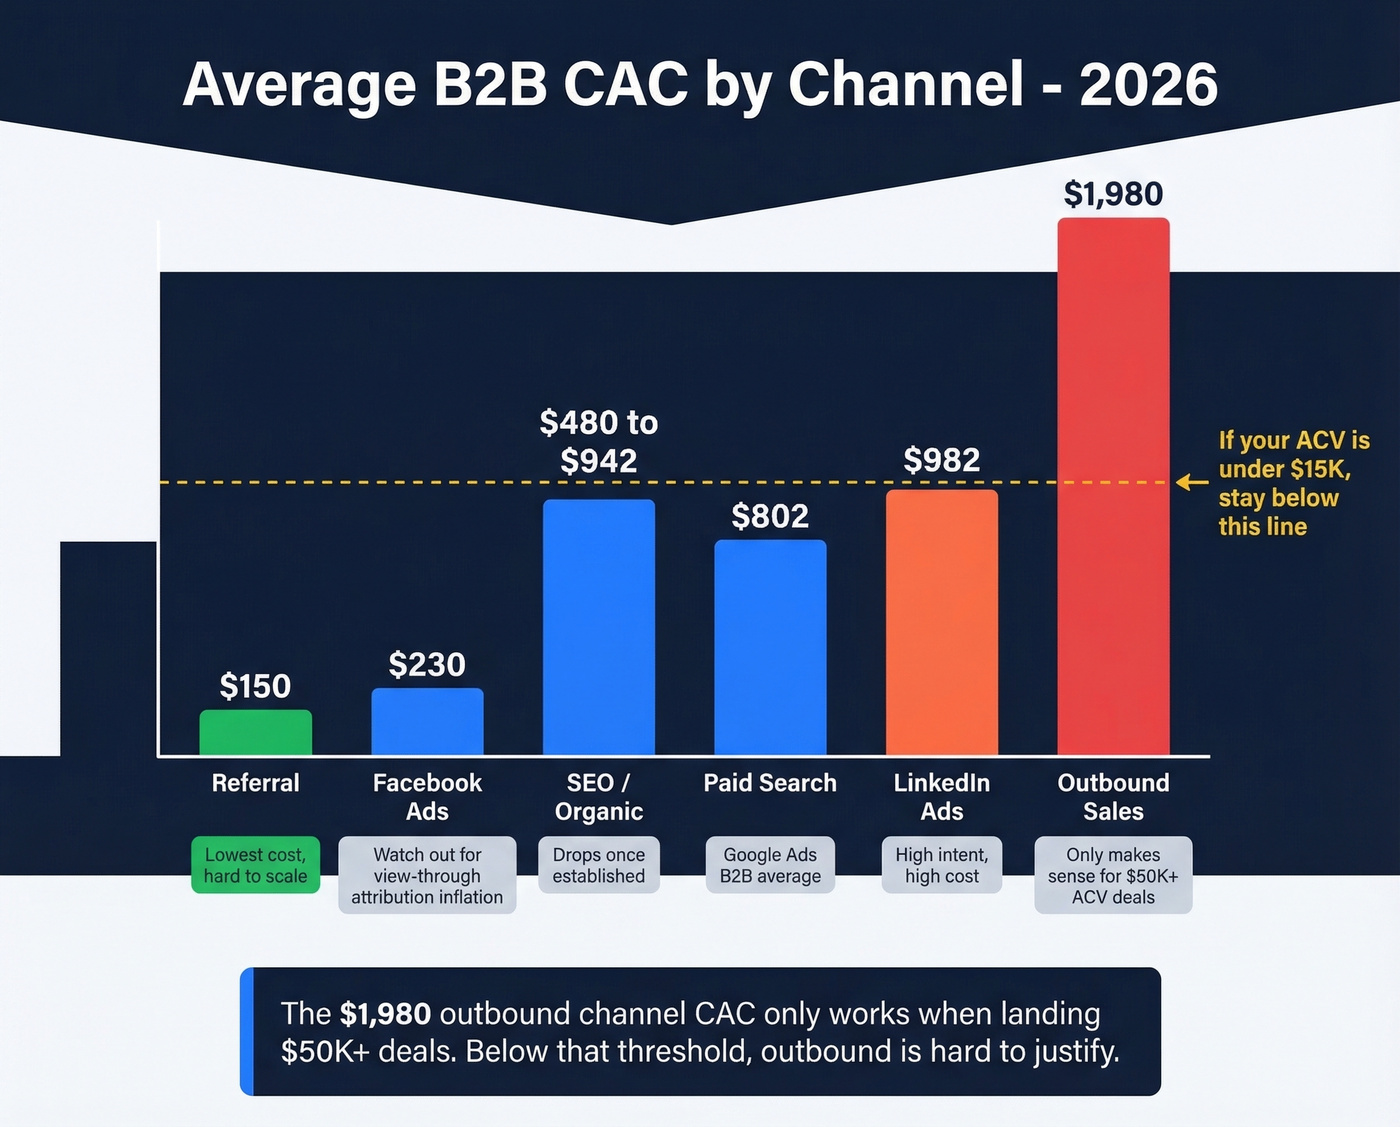
Let's be honest: if your average contract value is under $15K, you probably don't need outbound. The $1,980 channel CAC only makes sense when it's landing $50K+ deals. Below that threshold, outbound is hard to justify unless your conversion rates are exceptional.
Outbound CAC and Advanced SaaS Metrics
These are the metrics your board actually cares about - not raw CAC in dollars. The New CAC Ratio (total S&M spend divided by new customer ARR) hit a median of $2.00 in 2024, a 14% year-over-year increase. Fourth-quartile companies spend $2.82 to acquire $1.00 of new ARR.
For outbound specifically, the outbound CAC formula isolates SDR salaries, dialer tools, data subscriptions, and sequence platform costs in the numerator, divided only by customers sourced through outbound channels. This gives you a clean read on whether your outbound motion is sustainable at your current ACV. (If you're rebuilding the stack, start with a shortlist of SDR tools.)
One counterintuitive finding: deals in the $10K-$50K ACV range are often more expensive to acquire than $50K-$100K deals. The mid-market squeeze is real - enterprise-level sales effort without enterprise-level contract values.
The Blended CAC Ratio, which includes expansion ARR in the denominator, decreased about 12% in 2024 but remains 10% above 2022 levels. Expansion revenue is masking the fact that new customer acquisition keeps getting more expensive.
How to Reduce Acquisition Costs
Stop obsessing over reducing CAC. Start obsessing over calculating it correctly. Getting the customer acquisition cost formula right can drive 25-40% improvement in marketing efficiency before you change a single campaign. Once you've done that, here are five levers that actually move the number.
Fix your channel mix. The benchmarks above show referral at $150 versus outbound at $1,980. Most teams don't reallocate because they don't track channel-level CAC. Start tracking it, then shift dollars toward your most efficient channels while maintaining coverage across deal sizes.
Improve data quality. Your team sends 10,000 emails this month. 2,200 bounce. That's 22% of your outreach budget wasted on contacts that don't exist - and every bounce damages your sender reputation, reducing deliverability on good contacts too. Our team at Prospeo has seen customers like Meritt drop bounce rates from 35% to under 4% after switching to verified email sources, which means more outreach budget converts into actual conversations. At roughly $0.01 per verified lead versus $1.00+ on legacy platforms, the numerator shrinks on two fronts: fewer wasted sends and cheaper data. (If you want to benchmark and fix this, start with email bounce rate and improve sender reputation.)

Shorten sales cycles. Every day in the pipeline is a day of sales cost accruing in your numerator. Better qualification, faster follow-up, and removing friction from the buying process all compound here. Tightening your sales prospecting techniques and using proven sales follow-up templates helps.
Invest in organic and referral. Organic CAC is 40-60% cheaper than paid across most industries. The payback period is longer, but the structural advantage is enormous. Every organic customer lowers your blended CAC permanently.
Increase conversion rates at each funnel stage. A 10% improvement in demo-to-close rate doesn't just produce 10% more customers - it reduces your cost per buyer across every upstream dollar. Conversion rate improvements compound across the entire acquisition cost structure. If you need a baseline, start with sales conversion rate.
Bad data doesn't just inflate CAC - it creates the attribution noise that makes lag adjustments pointless. Prospeo's 5-step verification delivers 98% email accuracy and under 4% bounce rates, so every dollar in your numerator actually reaches a real buyer.
Stop subsidizing your CAC with bounced emails and dead leads.
FAQ
What is the customer acquisition cost formula?
CAC = Total Sales & Marketing Costs / New Customers Acquired. Include salaries (pro-rated by acquisition time), tools, ad spend, and overhead in the numerator. Excluding indirect costs understates true CAC by 30-50% on average.
What's the difference between CAC and CPA?
CPA measures cost per conversion at the campaign level - a lead, signup, or demo. CAC measures the fully loaded cost to acquire a paying customer, including salaries, tools, and overhead. Use CPA to optimize ads; use CAC to evaluate your business model.
Should I include salaries in my CAC calculation?
Yes - always. Pro-rate each person by the percentage of time spent on new customer acquisition. An SDR spending 70% of their time prospecting contributes 70% of their salary to CAC. Excluding headcount costs is the single most common reason teams understate their true acquisition cost.
How can I reduce CAC without cutting budget?
Improve data quality first. Teams using verified contact sources report bounce rates under 4% versus 35%+ on unverified lists - meaning more of your existing spend reaches real prospects. Then optimize conversion rates at each funnel stage; a 10% lift in demo-to-close compounds across every upstream dollar.
What's a good LTV:CAC ratio in 2026?
Target at least 3:1 as a floor, with payback under 12 months. B2B SaaS averages around 4:1; commercial insurance and higher education reach 5:1. A ratio above 6:1 signals underinvestment in growth - spend more to capture the opportunity.