Customer Pain Points: A Data-Backed Guide to Finding and Fixing What Frustrates Your Customers
Your VP of CX just dropped a slide showing NPS is down 12 points. The CEO wants answers by Friday. You've got 47 open Jira tickets, a 200-page survey report, and no idea which problem to fix first.
Here's the thing about customer pain points: the bottleneck isn't finding them. Most teams are drowning in feedback. The bottleneck is prioritization - knowing which fires actually burn revenue and which ones are just smoke.
The Short Version
- Pain points fall into four categories (financial, process, support, product) and three depth levels (interaction, journey, relationship). You need both lenses to prioritize correctly.
- Stop collecting more feedback. Most teams already have enough data. The real gap is a scoring framework to decide what to fix first.
- Use CES (Customer Effort Score), not NPS, to measure friction. Use RICE scoring to decide what gets resources.
- A big hidden B2B pain point: stale prospect data burning SDR hours, tanking deliverability, and damaging domain reputation before your outreach even starts.
What Are Customer Pain Points?
The standard definition - "problems customers experience with your product or service" - is fine but shallow. A better frame comes from Jobs-to-Be-Done theory. As Theodore Levitt put it, "People don't want a quarter-inch drill; they want a quarter-inch hole." Customers don't experience pain in a vacuum. They experience it while trying to make progress on a specific job.
That distinction matters because complaints are solution-dependent. "Your interface is confusing" anchors you to incremental UI tweaks. But the underlying job - "I need an accurate quote in under two minutes" - opens the door to fundamentally better solutions. Pain points are the resistance blocking progress on a job. Frame them that way, and you stop chasing symptoms.
Types of Customer Pain Points
Most articles give you one taxonomy. You need two - one that tells you what kind of pain, and another that tells you how deep it runs.
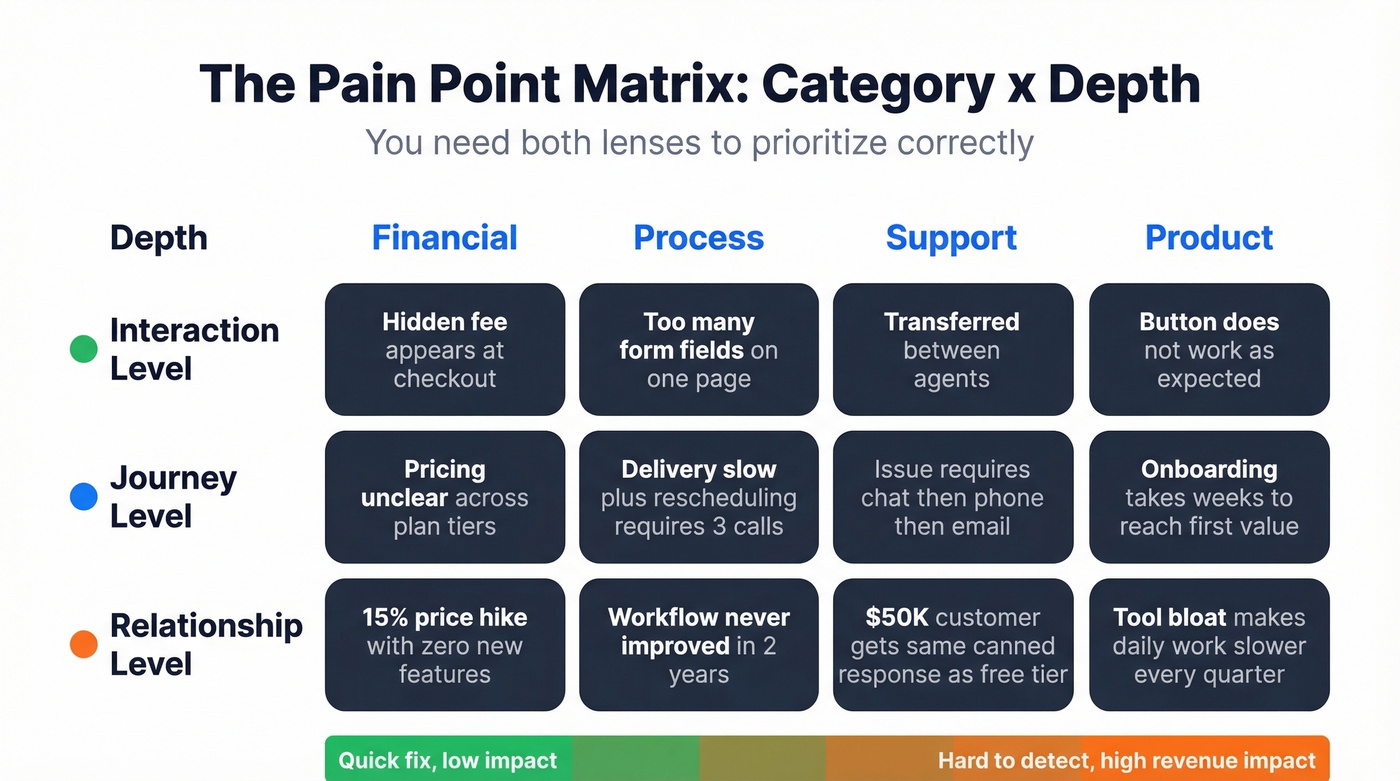
The Four Categories
| Category | Definition | Example |
|---|---|---|
| Financial | Cost-related friction | Hidden fees at checkout |
| Process | Workflow inefficiency | 23-field forms for a simple purchase |
| Support | Service failures | Repeating your issue to 3 agents |
| Product | Capability gaps | Tool bloat that slows daily work |
The Three Depth Levels
Nielsen Norman Group offers a second lens that's far more useful for prioritization. They break pain points into three levels based on how deep they cut.
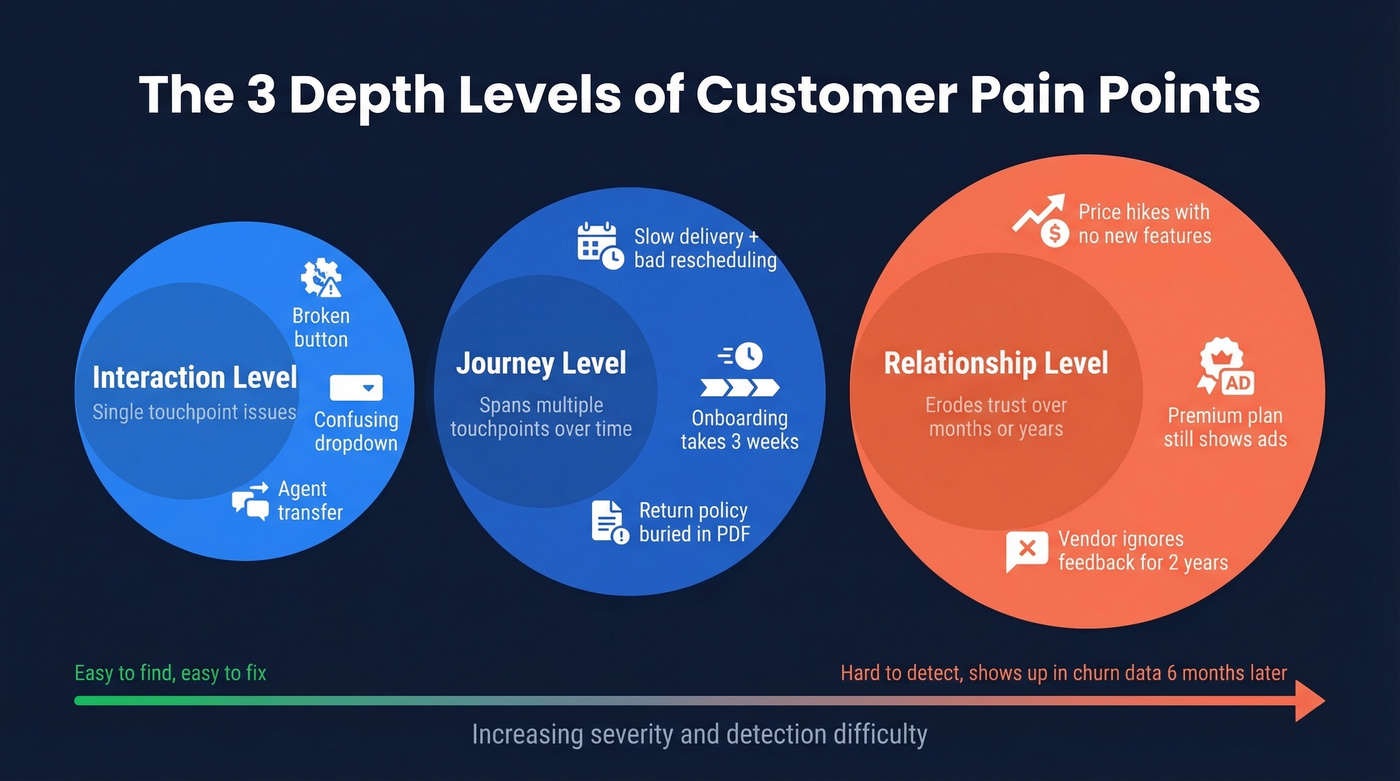
Interaction-level pain points are usability issues - getting transferred between support agents, a button that doesn't work, a confusing dropdown. Annoying, but usually fixable with a single design change.
Journey-level pain points span multiple touchpoints and time. A customer orders a product, delivery takes two weeks, rescheduling requires three phone calls, and the return policy is buried in a PDF. No single interaction is terrible, but the cumulative experience is awful.
Relationship-level pain points erode trust over months or years. You're paying for a premium subscription but still seeing ads. Your vendor raised prices 15% without adding a single feature. These are the hardest to detect because they don't show up in post-interaction surveys - they show up in churn data six months later.
A confusing checkout flow and a years-long trust erosion aren't the same category of problem. Treating them the same way is how teams waste resources on interaction-level fixes while relationship-level issues quietly drain revenue. Map both lenses - category and depth - and you get the full picture.
12 Common Customer Pain Points (With Fixes)
Financial
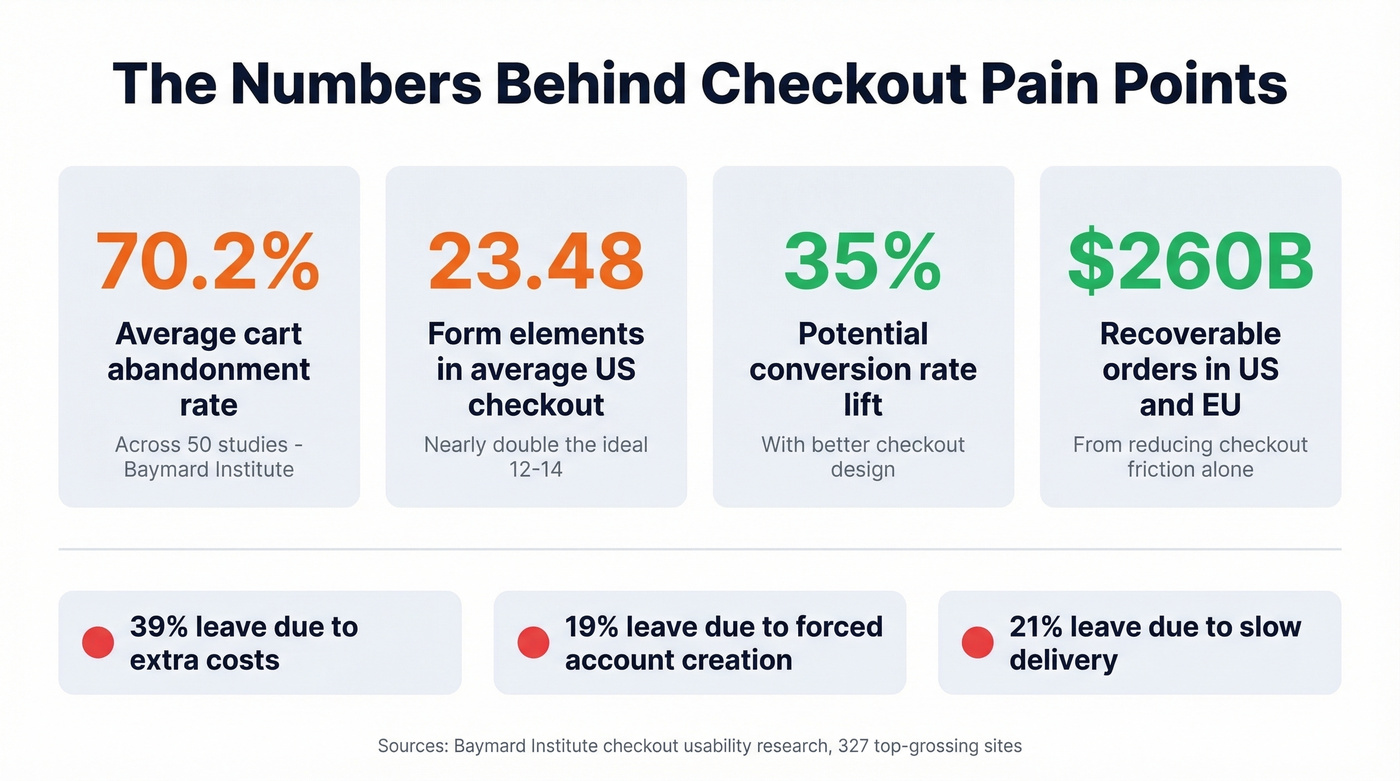
Hidden fees and surprise costs. With a 70.22% average cart abandonment rate across 50 studies, checkout is where most e-commerce revenue dies. Of shoppers who intend to buy, 39% leave because extra costs - shipping, taxes, fees - are too high. Show total cost before the checkout page. Not after.
Opaque pricing and "talk to sales" gates. When a prospect can't find your price, they assume it's expensive. Self-serve pricing pages convert better than demo request forms for most mid-market products. Publish at least a starting price or range. If your average deal size is in the tens of thousands and you're still hiding pricing behind a demo form, you're not protecting margins - you're losing deals to competitors who publish theirs.
Subscription price hikes without added value. Raising prices is fine. Raising prices while the product hasn't meaningfully improved in 18 months is a relationship-level issue that drives churn. Tie price increases to specific new capabilities and communicate them early.
Process
Checkout friction. The average US e-commerce checkout has 23.48 form elements - nearly double the ideal 12-14. Baymard's benchmark across 327 top-grossing sites, covering 30,000+ manually reviewed checkout elements and 134 usability guidelines, found 65% score "mediocre" or worse. Better checkout design could lift conversion rates by 35%, worth an estimated $260B in recoverable orders across US and EU e-commerce. Audit your form fields and cut anything that isn't legally or logistically required.
Forced account creation. 19% of shoppers abandon carts because the site requires an account. Guest checkout isn't a nice-to-have - it's a conversion lever. Offer it, and make account creation optional post-purchase.
Slow delivery and rigid scheduling. 21% of cart abandoners cite slow delivery. When customers can't choose a delivery window or reschedule without calling, a process issue becomes a journey-level one. Offer flexible delivery options and self-serve rescheduling.
Support
This is where the data gets uncomfortable. Hiver found that one in two consumers say repeating information to multiple agents is the most annoying part of customer service. CEB's research showed that 96% of customers with high-effort service interactions become more disloyal, compared to just 9% with low-effort experiences. Effort, not outcome, determines loyalty.
Long wait times and channel switching. Being forced to switch from chat to phone to email is the definition of high effort. Resolve within the channel the customer chose. If your support stack can't do that, the stack is the problem.
Repeating information to multiple agents. Every transfer that requires re-explaining the problem is a trust tax. Unified agent dashboards that carry context across handoffs aren't a luxury - they're table stakes.
Generic, impersonal service. When a customer with a $50K annual contract gets the same canned response as a free-tier user, it signals you don't know or don't care who they are. Segment support tiers and personalize responses based on account context.
Product
Tool bloat and complexity. The consensus on r/SaaS is clear: users want simple, purpose-built workflows - a clean lead-to-quote flow, not a 47-module CRM. An analysis of 6,742 Reddit pain-point posts found that 18% of feature requests ask for "invisible AI" - background automation that just works, not another chatbot interface. Audit feature usage and sunset what nobody touches.
Poor onboarding and slow time-to-value. If a new user can't experience your product's core value within the first session, you've already started losing them. Average SaaS activation rates sit around 37%, meaning most users never reach the "aha" moment. Map the shortest path to first value and remove every step that doesn't serve it.
Stale B2B prospect data. This one's invisible until it cascades. Your SDR manager walks into Monday standup and says half the phone numbers from last week's list were disconnected. Bounced emails torch your sender reputation. Dead numbers waste dial hours. Bad data doesn't just reduce efficiency - it actively damages your infrastructure. One customer, Meritt, saw their bounce rate drop from 35% to under 4% after switching to Prospeo, which delivers 98% email accuracy on a 7-day data refresh cycle versus a six-week industry average. When your data decays, every downstream process - sequences, pipeline, forecasting - decays with it.
One of the biggest hidden B2B pain points? Your SDRs burning hours on bounced emails and dead phone numbers. Prospeo's 5-step verification delivers 98% email accuracy and 125M+ verified mobiles - refreshed every 7 days, not every 6 weeks.
Stop letting bad data be your team's biggest pain point.
How to Identify Customer Pain Points
Customer feedback surveys. Use CES as your primary question: "On a scale of 1 to 5, how much effort did you have to expend to handle your issue?" Deploy it immediately after key interactions - support tickets, onboarding, checkout. CSAT works for transactional moments, but CES captures friction more reliably.
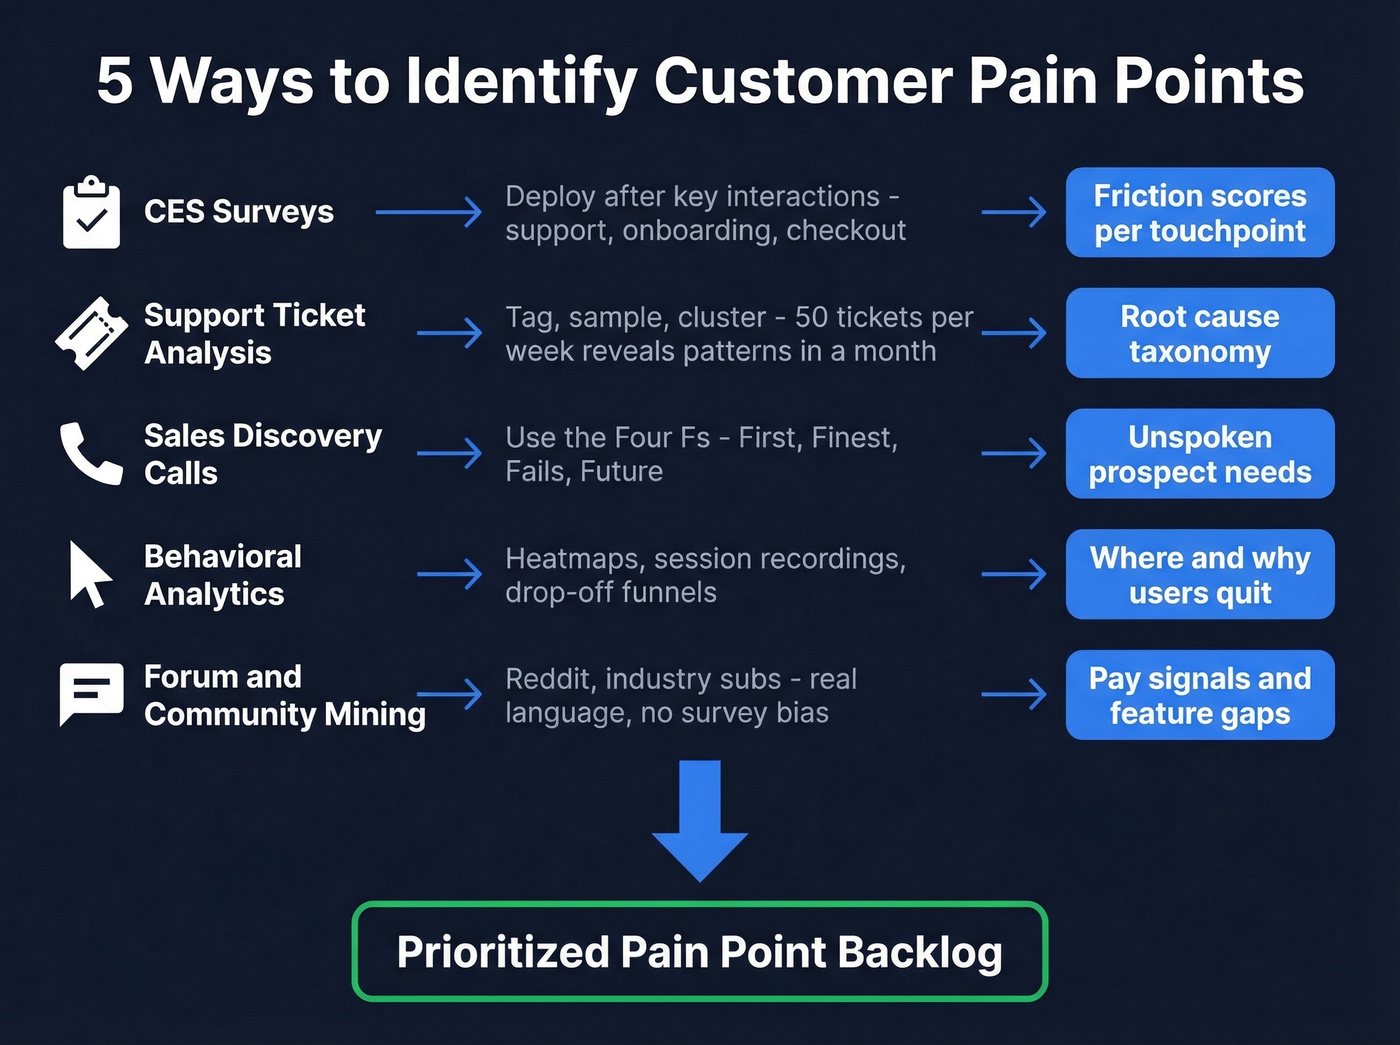
Support ticket analysis. Tag, sample, cluster. Most teams have thousands of tickets and no taxonomy. Tools like SentiSum categorize tickets by root cause automatically, Revuze mines product reviews with semantic clustering, and Keatext handles multilingual feedback. Even without AI, a weekly sample of 50 tickets with manual tagging reveals patterns within a month.
Sales discovery conversations. Salesforce's "Four Fs" framework gives reps a concrete script: ask about what's bothering them First, their Finest experience with a competitor, where their current solution Fails, and their Future goals. This surfaces issues prospects won't volunteer in a survey because they don't think of them as "feedback." If you want a tighter discovery process, use a structured set of discovery questions.
Behavioral analytics. Google Analytics shows where users drop off. Hotjar shows why - heatmaps reveal where people click, scroll, and rage-click. Session recordings are the closest thing to watching over a customer's shoulder. We've seen teams discover issues in 30 minutes of session recordings that six months of surveys missed entirely.
Forum and community mining. Reddit is a free product requirements document. A long, angry Reddit rant tells you exactly what someone would pay to fix, in their own language, with no survey bias. That 6,742-post analysis found clear "pay signals" - users explicitly stating willingness to pay for simpler tools, offline-first utilities, and background automation. Monitor r/SaaS, r/sales, and industry-specific subreddits weekly.
How to Measure Customer Pain Points
Customer Effort Score (CES)
CES is the metric we recommend as the primary friction indicator. The calculation is straightforward: sum all individual scores and divide by the number of responses. On a 1-5 scale where 1 is low effort and 5 is high effort, lower is better.
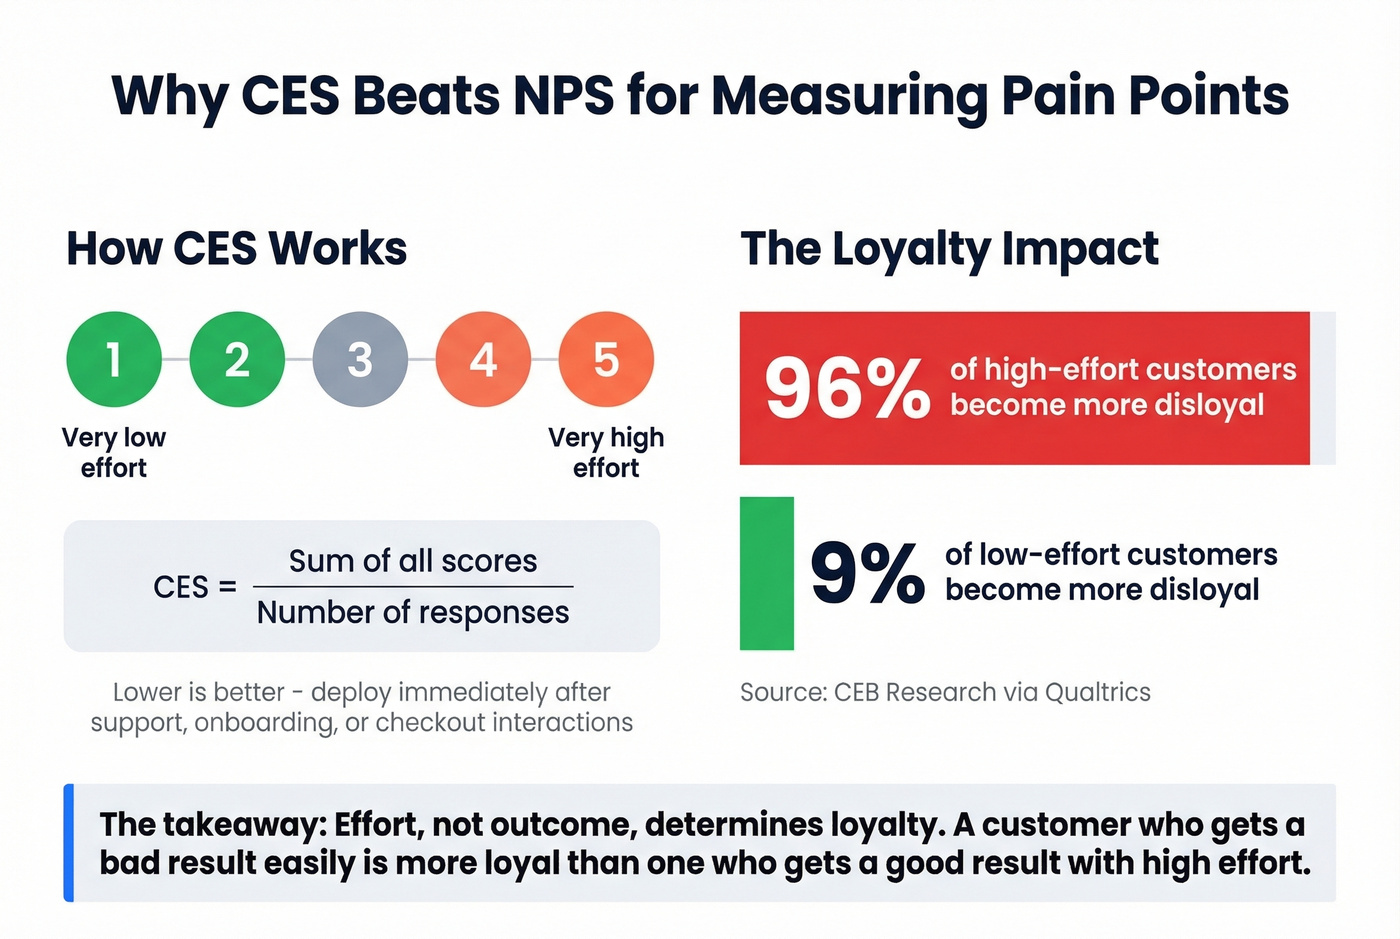
CEB's research found that 96% of customers with high-effort interactions become more disloyal, versus just 9% of low-effort customers. Gartner's data reinforces this: 94% of low-effort customers intend to repurchase versus 4% of high-effort customers, and low-effort interactions cost 37% less to deliver. There's no universal CES benchmark - trend against your own historical scores and flag any upward movement.
Churn Rate
Churn is the lagging indicator that confirms unresolved friction. B2B SaaS benchmarks by segment: SMB companies see 3-5% monthly churn, mid-market runs 1.5-3%, and enterprise sits at 1-2%. A commonly cited benchmark for average annual B2B SaaS churn is roughly 4.9%. If your churn is materially above your segment's typical range, you've got issues that surveys aren't catching - or that you're catching but not fixing fast enough. If you need a framework for digging into drivers, run a proper churn analysis.
NPS (Use With Caution)
NPS has fallen hard. It dropped from the 2nd most popular CX metric in 2023 to 8th place in 2024. Only 23% of US enterprise CX leaders still use it to measure performance. Gartner predicted more than 75% of organizations would abandon NPS by 2025 - that didn't fully happen, but the decline is real.
Real talk: NPS measures sentiment. CES measures friction. Friction is a stronger predictor of what customers actually do next.
How to Prioritize Pain Points
Identifying issues is the easy part. The hard part is deciding which one gets resources this quarter. Without a scoring framework, the loudest executive or the most recent customer complaint wins - and that's how teams end up "snacking" on low-impact, low-effort fixes while high-impact problems fester. In our experience, teams that skip RICE scoring end up fixing whatever the CEO complained about last.
RICE scoring brings discipline. The formula: (Reach x Impact x Confidence) / Effort. Impact uses a standard scale from 0.25 (minimal) to 3 (massive).
| Pain Point Fix | Reach x Impact x Confidence | Effort | RICE Score |
|---|---|---|---|
| Fix checkout form | 10,000 x 3 x 90% | 3 person-months | 9,000 |
| Redesign onboarding | 6,000 x 2 x 80% | 5 person-months | 1,920 |
| Add live chat | 4,000 x 1 x 70% | 2 person-months | 1,400 |
| Switch data provider | 500 x 2 x 95% | 1 person-month | 950 |
The checkout fix wins by a wide margin - high reach, massive impact, and the team's confident they know the problem. Ronny Kohavi's research across Microsoft, Amazon, and Booking.com found that only about one-third of experiments produce positive results. Prioritization isn't optional when two-thirds of your bets won't pay off.
Start with ICE (Impact x Confidence x Ease) if you're a smaller team without reach data. Graduate to RICE when you can quantify how many customers a fix actually touches.
Tools for Finding and Fixing Pain Points
Prospeo - for B2B teams where bad data is the pain point multiplier. 300M+ professional profiles, 143M+ verified emails, 125M+ verified mobile numbers, with 30+ search filters and a 7-day refresh cycle. Real-time verification plus CRM/CSV enrichment returns 50+ data points per contact. Free tier gives you 75 emails/month. Skip this if your pain points are purely product or UX - it's built for outbound data quality, not feedback analysis.
Google Analytics - behavioral flow analysis showing where users drop off. Free.
Hotjar - heatmaps, session recordings, and rage-click detection. Free tier available, paid plans start around $30+/mo.
SentiSum - AI-powered support ticket categorization and root cause analysis. Enterprise pricing, typically $500-5,000+/mo depending on ticket volume.
Revuze - AI product review mining with semantic clustering, no manual tagging required. Enterprise pricing, typically $1,000-6,000+/mo based on data volume.
Keatext - multilingual feedback analysis. Enterprise pricing, typically $1,000-10,000+/mo depending on feedback sources and volume.
If your pain points show up as missed follow-ups, add sales follow-up templates to your playbook.
You just read about how high-effort experiences drive disloyalty. The same applies to your sales team. When reps waste 4-6 hours a week on stale contacts, that's process friction killing pipeline. Prospeo gives you 300M+ verified profiles at $0.01/email - no contracts, no 'talk to sales' gates.
Eliminate the data pain point your competitors are still ignoring.
FAQ
What's the difference between a pain point and a complaint?
A complaint is a symptom ("your interface is confusing"), while a pain point is the underlying friction blocking progress ("I can't get an accurate quote in under two minutes"). Complaints are solution-dependent; pain points are job-dependent. Fix the job, and the complaint usually disappears without extra patchwork.
Which metric best predicts customer loyalty - NPS, CSAT, or CES?
CES. It measures effort, and effort drives behavior. Research found that 96% of customers with high-effort service interactions become more disloyal, versus 9% with low-effort experiences. Use CSAT for single interactions, but use CES to find systemic friction.
How many types of pain points are there?
Four categories (financial, process, support, product) and three depth levels (interaction, journey, relationship), creating a 12-cell matrix. The category tells you what's broken; the depth tells you how expensive it'll be to fix - and how much revenue it can quietly drain if you ignore it.
Fix the Right Problems First
Most teams don't fail because they can't find issues - they fail because they can't rank them. Use the two-lens taxonomy (category + depth) to avoid mistaking "annoying" for "expensive," measure friction with CES, and force trade-offs with RICE. Do that consistently, and customer pain points stop being a messy pile of feedback and start becoming an execution roadmap.