Customer Relationship Management KPIs: The Only Ones That Actually Matter
A RevOps lead we know was tracking 15 metrics across six different tools - spreadsheets, ClickUp, Notion, the CRM itself. Two hours every Monday morning just collecting numbers before anyone could actually discuss them. After consolidating to a single CRM dashboard with six KPIs, that Monday ritual dropped to 15 minutes.
CRM delivers $8.71 for every $1 spent, but only if you're measuring the right customer relationship management KPIs. Most teams aren't.
The Short List
If you track nothing else, start here:
- Customer Retention Rate - the clearest signal of whether your product delivers value post-sale
- CLV:CAC Ratio - tells you if customer relationships are actually profitable
- Pipeline Velocity - measures how fast revenue moves through your funnel, not just how much
- Lead Response Time - the single biggest controllable lever for conversion
- NPS - early warning system for churn before it shows up in revenue
Whether you're running Salesforce, HubSpot, or Close, these five apply. Everything below builds on them.
Why Most Teams Track the Wrong CRM Metrics
A customer relationship management KPI is a quantifiable metric tied to how you acquire, retain, and grow customer relationships. Simple enough. The problem is that most teams confuse "things we can measure" with "things we should measure."
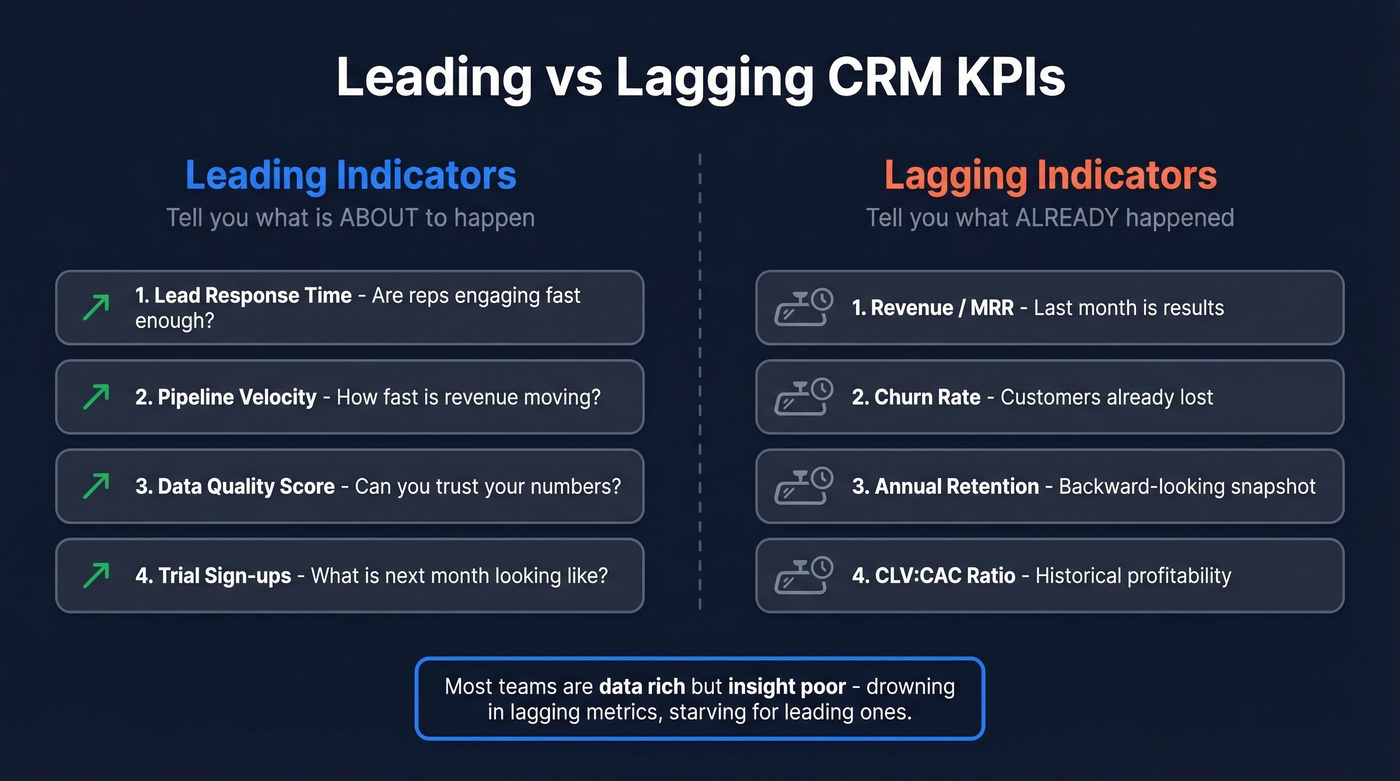
The distinction that matters is leading vs. lagging indicators. Lagging indicators - revenue, churn rate, annual retention - tell you what already happened. Leading indicators - lead response time, pipeline velocity, data quality score - tell you what's about to happen. As Bernard Marr put it, most businesses are "data rich, but insight poor." They're drowning in lagging metrics and starving for leading ones.
CRM adoption alone drives +29% sales, +34% productivity, and +42% sales forecasting accuracy. But those gains only materialize when you're measuring the right outputs. Track 5-7 KPIs, not 38. Close's blog lists 38 CRM KPIs. That's a reference library, not a dashboard. If you can't explain why each metric is on your dashboard and what action you'd take if it moved 10%, cut it.
The CRM KPIs That Drive Decisions
Customer Health KPIs
Customer Retention Rate measures the percentage of customers you keep over a period. The formula: ((Customers at end - New customers acquired) / Customers at start) x 100. Many SaaS businesses aim for 85-95% annual retention, while ecommerce retention is often far lower - 25-40% - because of one-time buyers. If retention is declining quarter over quarter, investigate onboarding friction and support ticket trends before anything else.
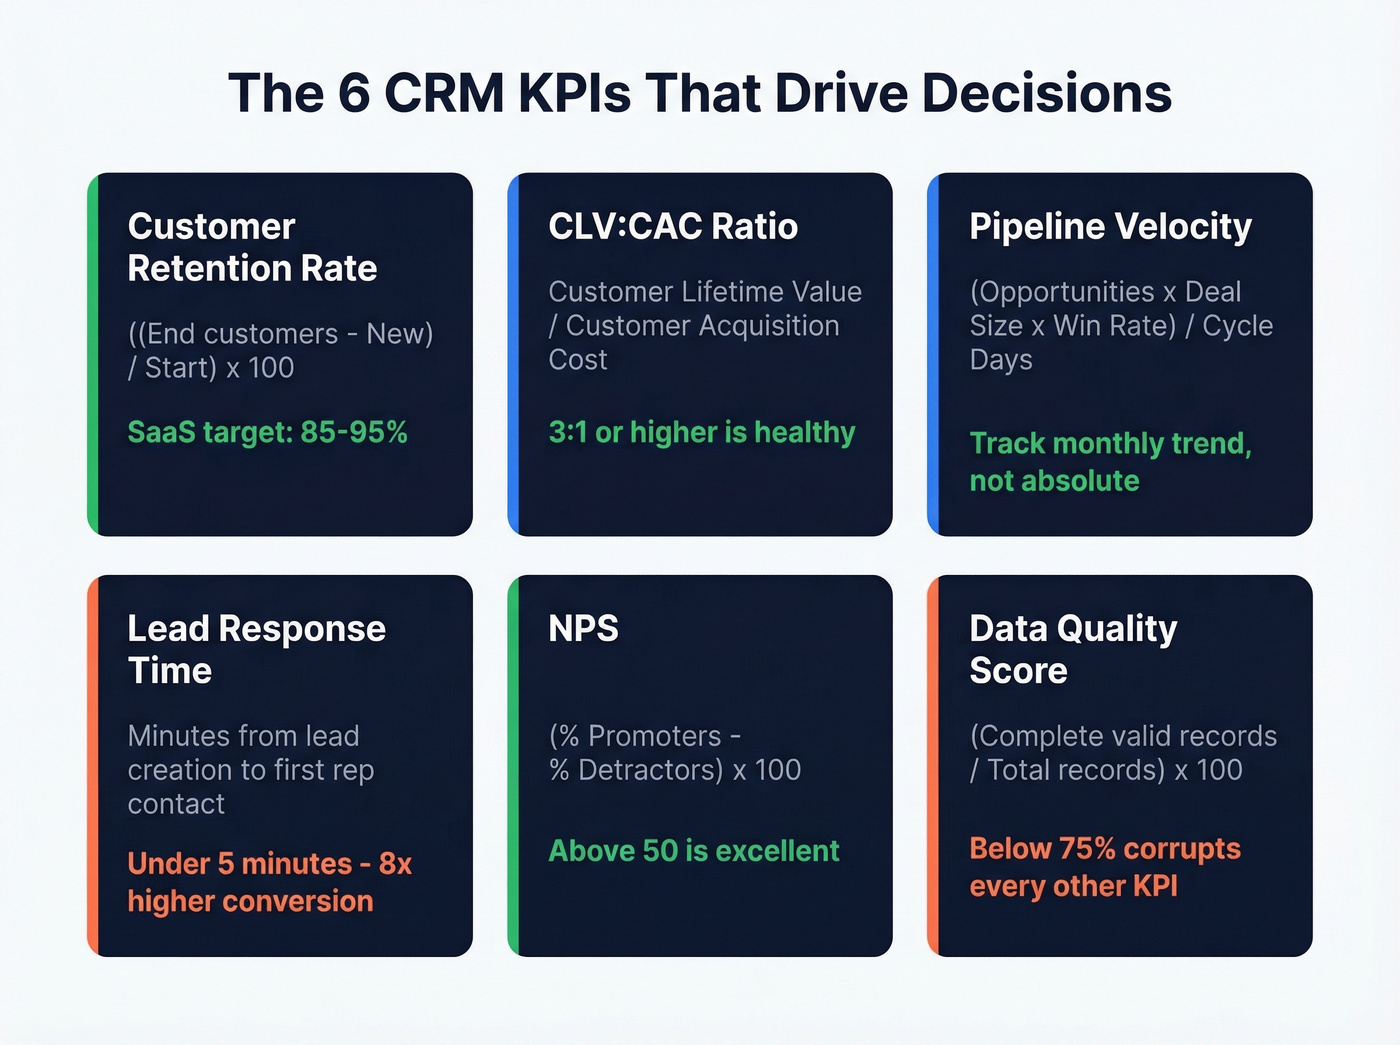
NPS (Net Promoter Score) is your early churn detector. Formula: (% Promoters - % Detractors) x 100. Above 50 is excellent, 0-50 is solid, below 0 means you've got a retention crisis brewing. NPS moves before revenue does, which makes it one of the few customer response metrics that flags problems while you still have time to act.
CSAT (Customer Satisfaction Score) measures satisfaction at specific touchpoints - a support call, an onboarding session, a feature release. Formula: (Number of satisfied customers / Number of survey responses) x 100, where "satisfied" is typically a 4-5 on a 5-point scale. A strong target is 85-90%. Below 70%? Dig into the specific touchpoint dragging the score down.
Revenue & Lifetime Value KPIs
Customer Lifetime Value (CLV) tells you what a customer is worth over the entire relationship. Formula: Average purchase value x Purchase frequency x Customer lifespan. A SaaS customer paying $500/mo who stays 24 months has a CLV of $12,000. Simple, but most teams don't calculate it - they guess.
CLV:CAC Ratio is, in our experience, the single most important CRM metric for executives. Spending $4,000 to acquire a customer worth $12,000 gives you a healthy 3:1. Below 1:1 means you're literally losing money on every customer you acquire, and no amount of pipeline will fix that. At 5:1+ you're probably under-investing in growth. Pair CLV:CAC with MRR/ARR to see whether you're growing profitably or just growing.
Sales Performance KPIs
Pipeline Velocity measures how fast deals move through your funnel. Formula: (Number of opportunities x Average deal size x Win rate) / Sales cycle length in days. This is the KPI that connects marketing activity to revenue timing - and the one most teams ignore in favor of raw pipeline volume.
Win Rate is closed-won deals divided by total opportunities. The typical B2B range is 15-30%. Below 15%, your qualification process needs work. Above 30%, you might not be taking enough at-bats.
Lead Response Time is the most underrated sales KPI in any CRM. InsideSales analyzed 55 million sales activities across 400+ companies and found that conversion rates are 8x higher when reps respond within five minutes. Here's the painful part: 57.1% of first call attempts happen more than a week after the lead comes in, and only 0.1% of inbound leads get engaged in under five minutes. That gap is enormous, and it's entirely fixable. If you're tightening speed-to-lead, keep a few sales follow-up templates ready so reps can respond instantly.
Sales Cycle Length tracks days from first touch to closed-won. CRM data accessibility alone can shorten cycles by 8-14% - we've seen similar results across teams we work with.
Acquisition KPIs
Customer Acquisition Cost (CAC) is total sales and marketing spend divided by new customers acquired. Most teams only count ad spend. That's wrong. Include salaries, tools, content production - everything that touches acquisition. (If you want a clean breakdown, see cost to acquire a customer.)
Lead Conversion Rate is leads converted to customers divided by total leads, times 100. Track it by source and you'll quickly see which channels deserve more budget and which are burning it. For baseline ranges, compare against the average B2B lead conversion rate.
Data Quality Score
Here's the KPI nobody talks about but that corrupts every other metric on your dashboard.
Data Quality Score measures the percentage of CRM records with valid email, phone, and complete required fields. Formula: (Records with all required fields valid / Total records) x 100. If 25% of your contact records have invalid emails or missing phone numbers, your retention rate, CAC, and conversion metrics are all built on sand. Prospeo enriches CRM records with 98% verified emails and 125M+ mobile numbers on a 7-day refresh cycle, so the metrics you're tracking reflect reality rather than stale data. If you're evaluating vendors, start with a shortlist of data enrichment services.
Every CRM KPI on your dashboard - retention rate, CLV:CAC, pipeline velocity - is only reliable if your underlying contact data is clean. Prospeo enriches CRM records with 98% verified emails and 125M+ mobile numbers on a 7-day refresh cycle, so your metrics reflect reality instead of decaying data.
Stop building dashboards on bad data. Start with Prospeo's free tier.
CRM KPI Benchmarks by Business Model
| KPI | SaaS | Ecommerce | Prof. Services | Agency |
|---|---|---|---|---|
| Annual Retention | 85-95% | 25-40% | 70-85% | 75-90% |
| Monthly Churn | 3-7% | 5-10% | 2-5% | 3-6% |
| CLV:CAC Ratio | 3:1+ | 3:1+ | 5:1+ | 4:1+ |
| Win Rate | 15-25% | N/A (self-serve) | 20-35% | 25-40% |
| Response Target | <5 min | <1 hour | <5 min | <15 min |
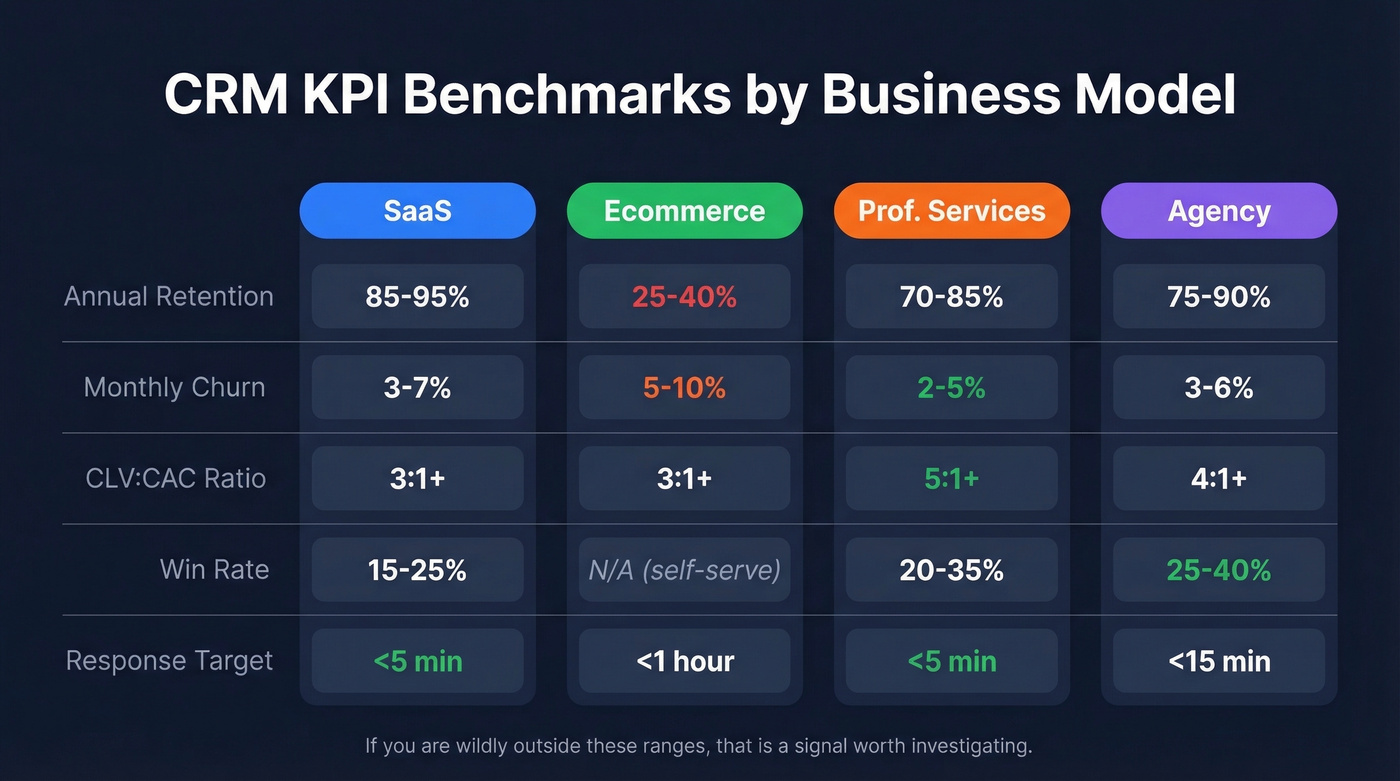
Ranges compiled from InsideSales speed-to-lead research, Nucleus Research CRM impact data, and general industry benchmarks. Your vertical, deal size, and sales motion shift these ranges - but if you're wildly outside them, that's a signal worth investigating.
Five Dashboard Mistakes That Kill CRM KPIs
1. Tracking too many KPIs. If your dashboard has 20+ metrics, nobody's acting on any of them. Pare down to 5-7 that directly tie to business outcomes.
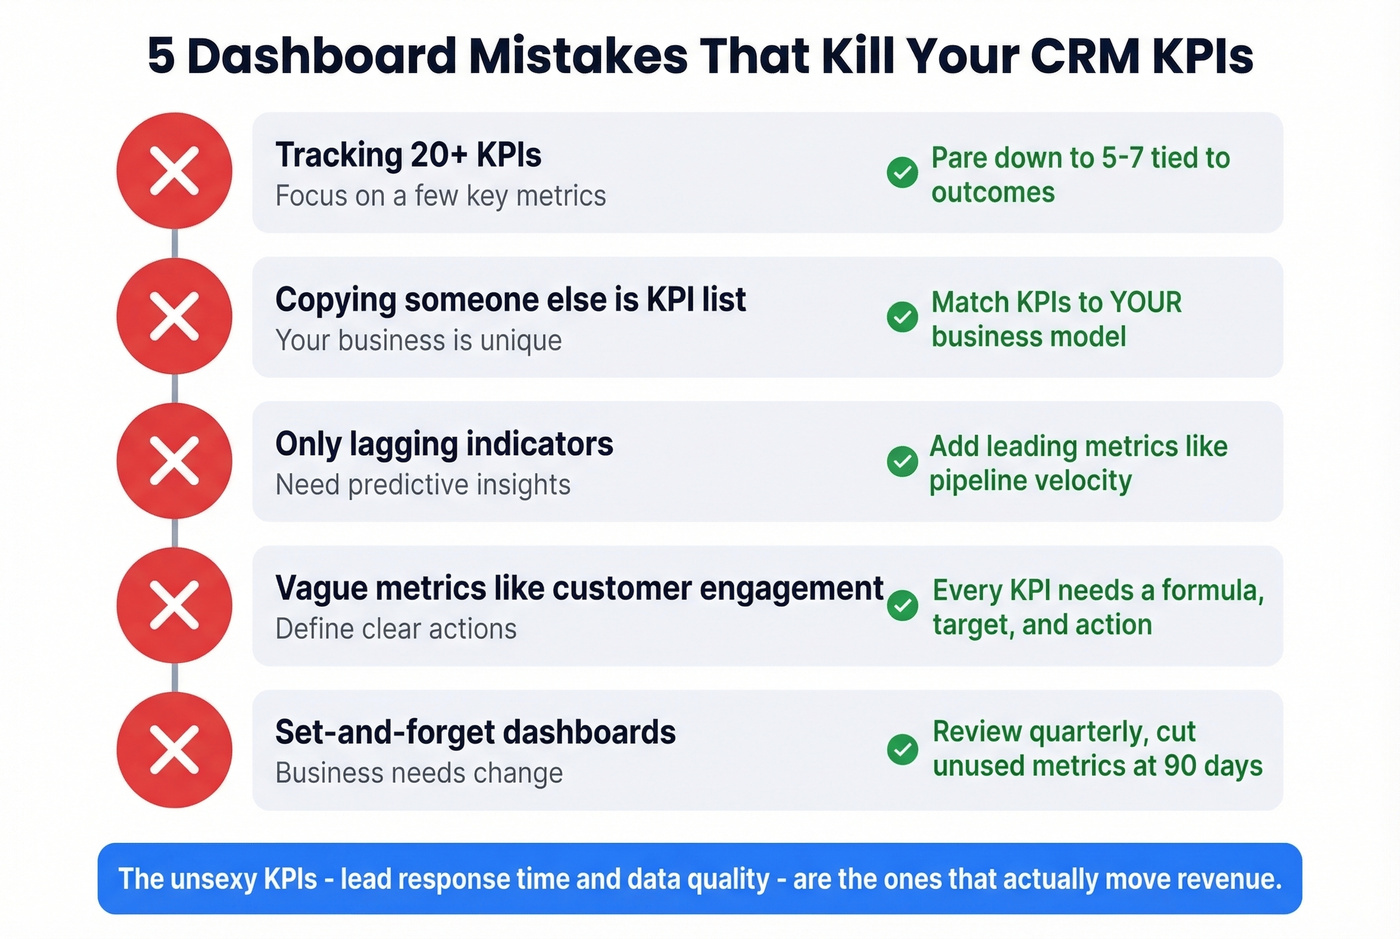
2. Copying someone else's KPI list. A SaaS company tracking ecommerce benchmarks is optimizing for the wrong game entirely. Your KPIs need to reflect your business model and sales motion, not whatever template you downloaded from a blog post.
3. Only tracking lagging indicators. MRR tells you what happened last month. Trial sign-ups and pipeline velocity tell you what's happening next month. You need both, and the leading-to-lagging mix is where most teams fall short.
4. Using vague, unactionable metrics. "Customer engagement" means nothing unless you define it. Every KPI should have a formula, a target, and a clear action if it moves.
5. Set-and-forget dashboards. Review your KPI set quarterly. If you haven't taken action on a metric in 90 days, it doesn't belong on your dashboard. The consensus on r/sales backs this up - executives who measure CRM success via business impact KPIs rather than adoption metrics make better resource decisions. If you're trying to operationalize this, a simple QBR cadence helps keep KPI reviews from drifting.
Let's be honest: most teams would get more value from nailing lead response time and data quality than from building elaborate multi-tab dashboards. The unsexy KPIs are the ones that move revenue.
AI-Era CRM KPIs Worth Watching
83% of companies already use AI in their CRM workflows, but measurement is lagging behind adoption. In 2026, up to a quarter of planned AI spending is sliding into 2027 as organizations demand proven ROI before scaling further. If you can't measure it, you shouldn't be buying it.
The emerging KPIs worth adding to your radar: predictive lead scoring accuracy - what percentage of AI-scored "hot" leads actually convert - sentiment analysis trends across support tickets and calls, and intent signal tracking as a leading indicator for pipeline. That last one is where things get interesting. Layering buyer-intent signals from sources like Bombora's 15,000 intent topics into your CRM reporting turns pipeline forecasts from educated guesses into something closer to actual predictions. If you're building this into your process, start with a solid lead scoring model.
Lead response time drops when reps waste minutes hunting for valid contact info. Prospeo delivers 50+ data points per contact at a 92% match rate - so your team spends time selling, not searching. That's how you move pipeline velocity, not just measure it.
Give your reps verified contacts in seconds, not hours of research.
FAQ
How many CRM KPIs should I track?
Five to seven, maximum. Pick a mix of leading indicators like pipeline velocity and lead response time alongside lagging indicators like retention rate and CLV:CAC, all tied to your specific business model. Review quarterly and cut anything you haven't acted on in 90 days.
What's the single most important CRM KPI?
CLV:CAC ratio. It tells you whether your customer relationships are profitable - not just growing. A healthy ratio is 3:1 or higher. Below 1:1 means you're spending more to acquire customers than they're worth, and no amount of pipeline will fix that.
How do I align CRM goals with KPIs?
Start by defining two or three CRM goals - reducing churn by 10%, shortening sales cycles, improving data quality. Then select the KPIs that directly measure progress toward each goal. If a metric doesn't map back to a stated goal, it doesn't belong on your dashboard.
How do I make sure my CRM KPIs are accurate?
Start with clean data. If 20-30% of your contact records have invalid emails or missing fields, every metric built on that foundation is unreliable. Automating enrichment and verification on a weekly cycle - rather than relying on reps to manually update records - is the fastest way to close that gap.