Daily Sales Report Template That Actually Gets Used
It's 4:45 PM. Your VP pings: "Can you send me today's numbers?" You spend the next 30 minutes scrambling through Salesforce, copying cells into a spreadsheet nobody designed for this, and emailing something that looks like it was made during a fire drill.
That's not reporting. That's survival mode. Let's fix it with a daily sales report template you can actually use every day - plus the framework to make it worth reading.
Free Templates: Excel, Sheets, PDF
Grab the format that fits your workflow:
- Excel - editable, printable, works offline
- Google Sheets - real-time collaboration, shareable link
- PDF - static version for email attachments or print
A solid template tracks the basics: date, rep name, product/service, quantity sold, revenue, payment method, and notes. Add goal vs. actual and variance columns so the numbers have context. It's fully editable - add columns, remove what you don't need, brand it with your logo.
Every field earns its spot:
- Date and rep name - obvious, but surprisingly absent from most homegrown spreadsheets
- Product/service and quantity - what was sold and how much
- Revenue - total dollar amount per transaction or per rep
- Payment method - credit, cash, invoice
- Goal vs. actual + variance - the single most important column most templates skip
- Notes/commentary - two to three bullets explaining what happened and what's next
The Google Sheets version supports real-time collaboration, so your whole team updates a single source of truth instead of emailing five different files back and forth.
What to Include in Your Report
High-performing sales teams are 2.8x more likely to track and analyze daily sales performance than underperforming ones. That stat alone should settle the "do we really need a daily report?" debate. The same research cites a 15-25% EBITDA growth lift for data-driven sales engines, and daily reporting is where that discipline starts.
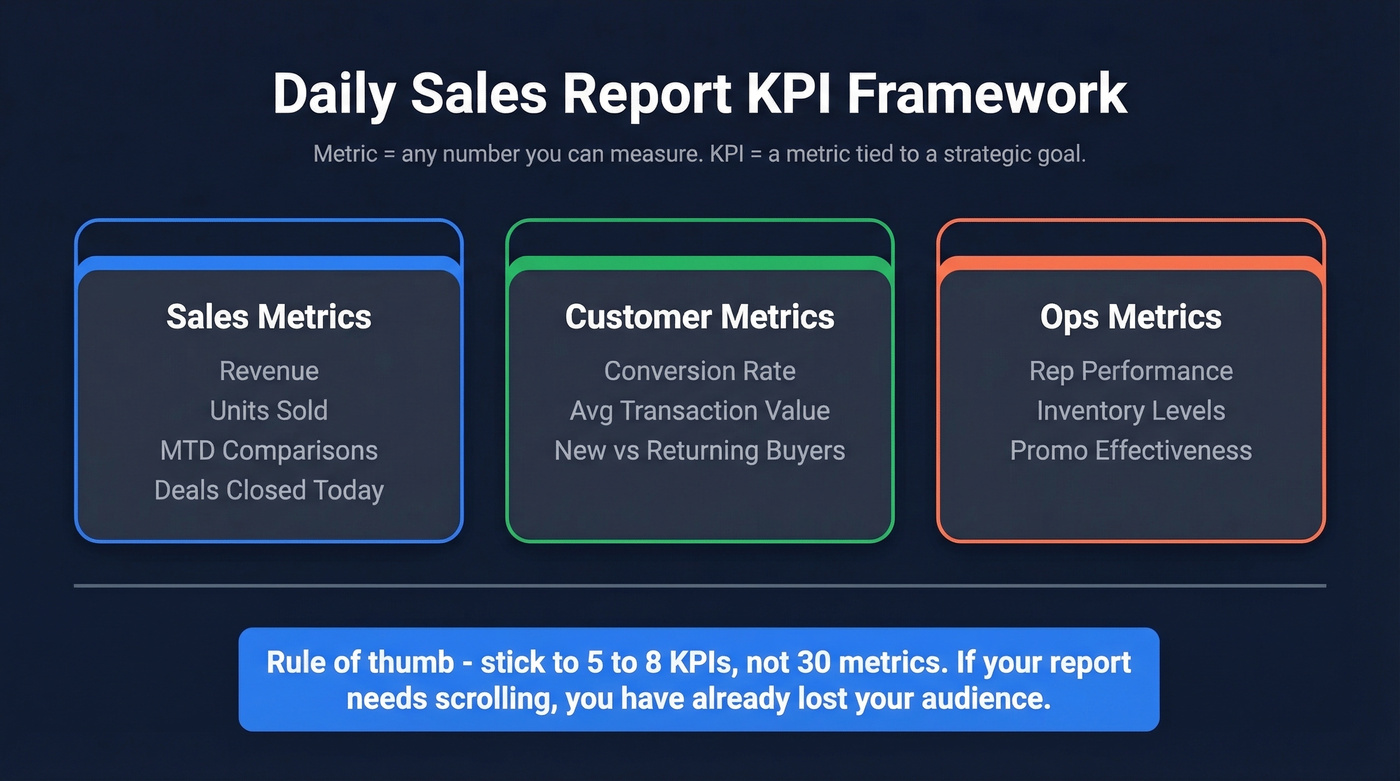
But tracking metrics isn't the same as tracking the right metrics. A useful daily sales report format breaks KPIs into three buckets: sales metrics like revenue, units, and MTD comparisons; customer metrics like conversion rates, average transaction value, and new vs. returning buyers; and ops metrics like rep performance, inventory levels, and promo effectiveness.
Here's the thing: a metric is any number you can measure. A KPI is a metric tied to a strategic goal. Your daily report should include 5-8 KPIs, not 30 metrics. If your report takes more than one page, you've already lost your audience.
The daily KPIs that earn their spot:
- Calls made and total talk time
- Emails sent
- Demos booked
- Follow-ups completed
- Meetings scheduled
- Deals closed today
- Pipeline added or moved forward
Process Metrics vs. Outcome Metrics
Daily sales reports should emphasize process metrics - calls, emails, meetings - because you can act on them today. If your SDR team's call volume drops 40% on a Wednesday, you don't want to discover that in Friday's weekly rollup. You want to catch it at 2 PM and fix it before the day's over.
Outcome metrics like revenue, win rate, and average deal size matter, but they're lagging indicators. They tell you what already happened. Process metrics tell you what's about to happen. Daily reports are where process metrics live; outcome metrics roll up weekly and monthly.
Daily vs. Weekly vs. Monthly
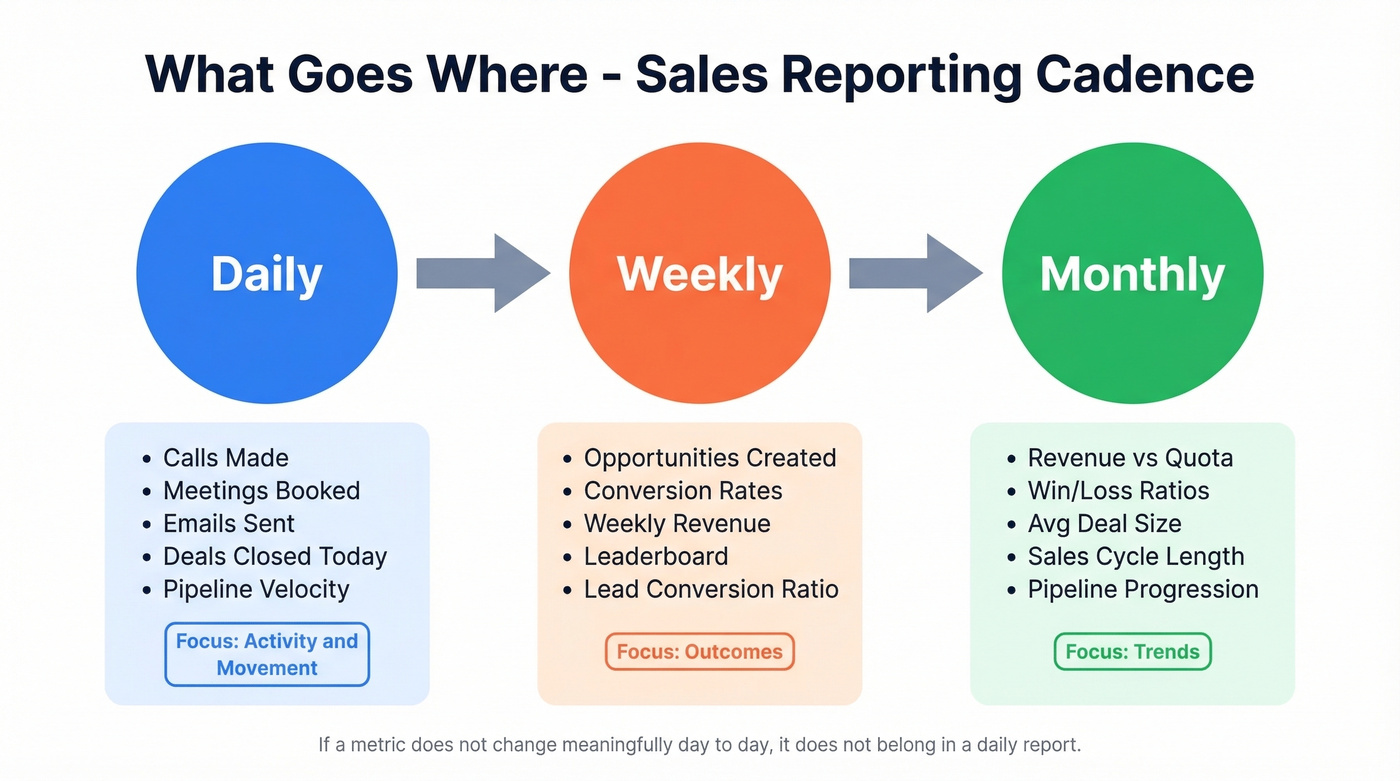
If a metric doesn't change meaningfully day-to-day, it doesn't belong in a daily report.
| Daily | Weekly | Monthly |
|---|---|---|
| Calls made | Opportunities created | Revenue vs. quota |
| Meetings booked | Conversion rates | Win/loss ratios |
| Deals closed today | Weekly revenue | Avg. deal size |
| Pipeline velocity | Leaderboard | Sales cycle length |
| Emails sent | Lead conversion ratio | Pipeline progression |
Daily reports track activity and movement. Weekly reports aggregate outcomes. Monthly reports reveal trends. Don't blur the lines.
Who Gets What Report
Sending your VP the same report your SDRs get is a waste of everyone's time.
| Audience | Frequency | Detail Level |
|---|---|---|
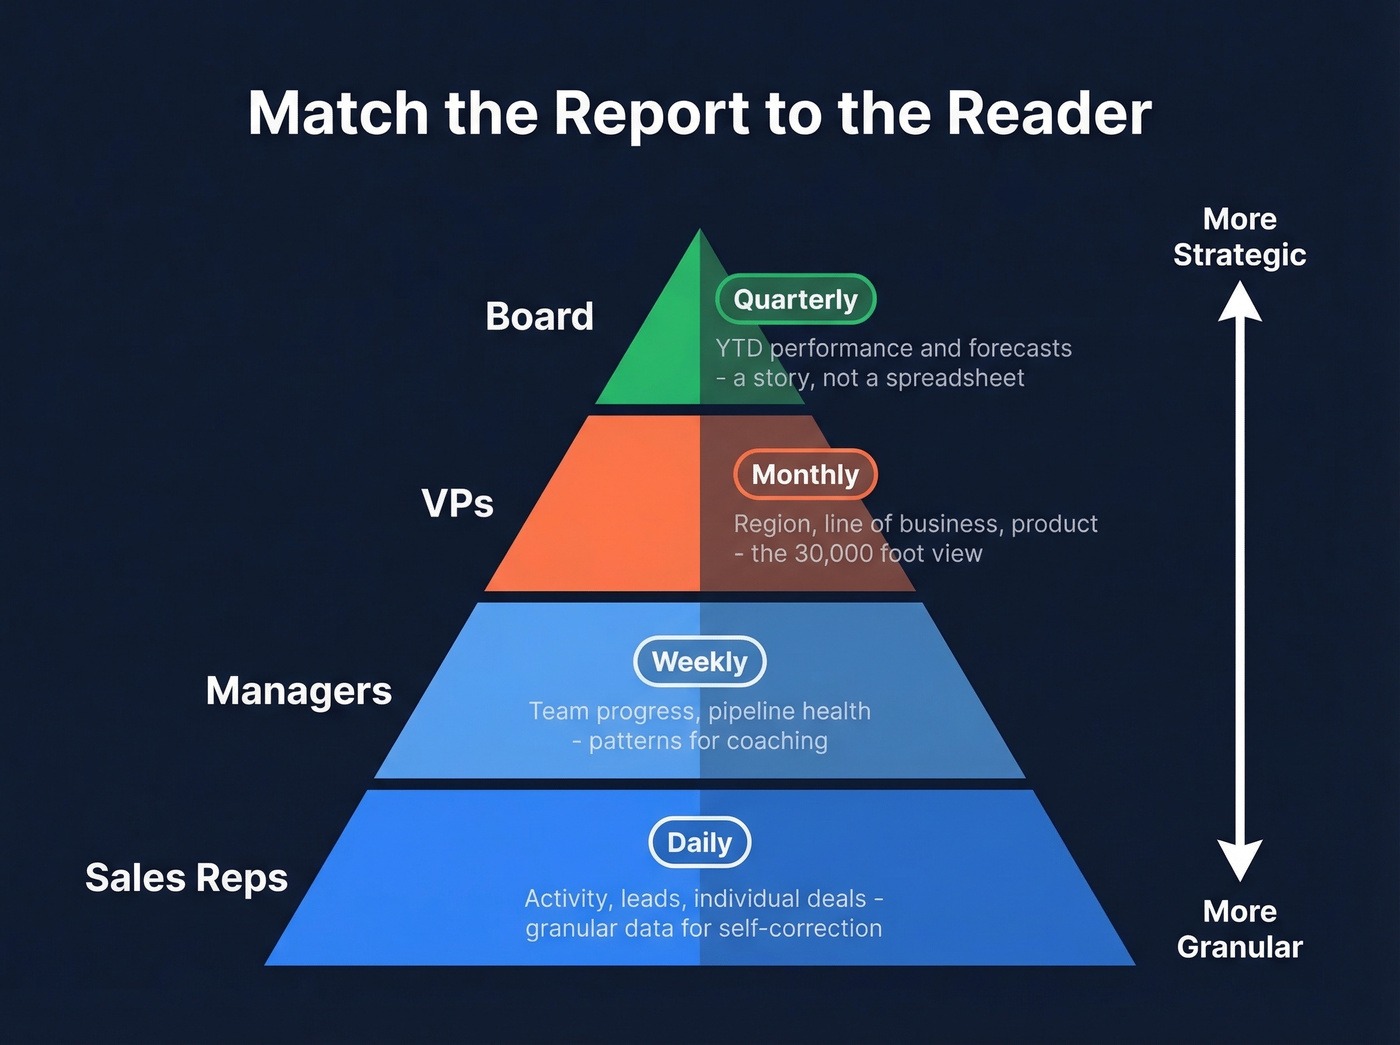
| Reps | Daily | Activity, leads, deals |
| Managers | Weekly | Team progress, pipeline |
| VPs | Monthly | Region, LOB, product |
| Board | Quarterly | YTD + forecasts |
Reps need granular activity data so they can self-correct. Managers need team-level patterns to coach effectively. VPs need the 30,000-foot view by segment. The board needs a story, not a spreadsheet - match the report to the reader.
Your daily report tracks calls, emails, and meetings - but if half those contacts bounce, your activity metrics are fiction. Prospeo delivers 98% email accuracy and 125M+ verified mobile numbers with a 30% pickup rate, so every line in your report reflects real conversations, not wasted dials.
Stop reporting vanity metrics. Start reporting real pipeline.
Industry-Specific Templates
Not every sales team sells SaaS. The fields that matter for a restaurant are wildly different from a B2B outbound team. Here are four industry variants with the key fields that distinguish each.
Retail / E-commerce
Track items sold by category, revenue by channel, returns and refunds, average order value, and daily goal vs. actual. If your platform already has a daily sales view, export it to Sheets and layer in your goal and variance columns. Five fields. That's all most retail teams need.
Restaurant
Most restaurant templates list fields. That misses the point. The real question is when the revenue happened - a $12,000 day where $10,000 came from dinner tells a completely different story than an even split across shifts.
Track gross sales by shift, register subtotals, discounts and comps, tax collected, gift certificate redemptions, and payment method breakdown. Smartsheet's restaurant template provides subtotals for morning and evening shifts, tallies sales from multiple registers, and subtracts discounts and complimentary items from gross sales to determine net earnings while factoring in tax and gift certificates.
Hotel / Hospitality
Hotel daily sales templates compare current performance to budgeted targets and include MTD, YTD, and prior-year comparisons. Smartsheet's hotel template tracks revenue broken out by stream - lodging, food and beverage, spa, catering - and includes segment breakdowns separating transient and group travelers. If you're running a property with multiple revenue streams, this format saves hours of manual consolidation.
B2B Sales Teams
Skip revenue-only templates. For B2B, activity metrics come first because revenue is a lagging indicator. Track calls made, emails sent, meetings booked, demos completed, deals closed, pipeline added, and quota attainment.
For outbound teams, include email deliverability and contact accuracy as daily metrics. If your reps log 50 calls but half the numbers are disconnected, your activity data is fiction. Prospeo verifies emails at 98% accuracy and refreshes contact records every 7 days, so your activity numbers reflect real conversations - not messages sent into the void.
Setting Up in Excel or Google Sheets
Google Sheets is ideal for daily reporting when multiple people need to update the same report. Real-time collaboration eliminates the "which version is current?" problem entirely. If your team prefers working offline or needs advanced macros, Excel works just as well - the setup steps are nearly identical.
- Create four tabs: Sales data for raw input, Config for dropdown lists covering reps, products, and regions, Sales Report for the formatted overview, and README with instructions for your team.
- Set up your Sales data tab with standardized columns - date, rep, product, quantity, revenue, payment method, goal, actual, variance, notes.
- Use the QUERY function in your Sales Report tab to auto-populate summaries from raw data. This eliminates manual copy-paste and keeps your report current as reps enter data throughout the day.
- Lock the column structure. Don't move or reorder columns after setup - your queries depend on column positions. Add new columns at the end only.
Five Reporting Mistakes Costing Revenue
Sales reps spend just 28% of their time actually selling. Manual reporting is one of the biggest culprits eating the other 72%. We've seen these five mistakes kill reporting programs over and over.
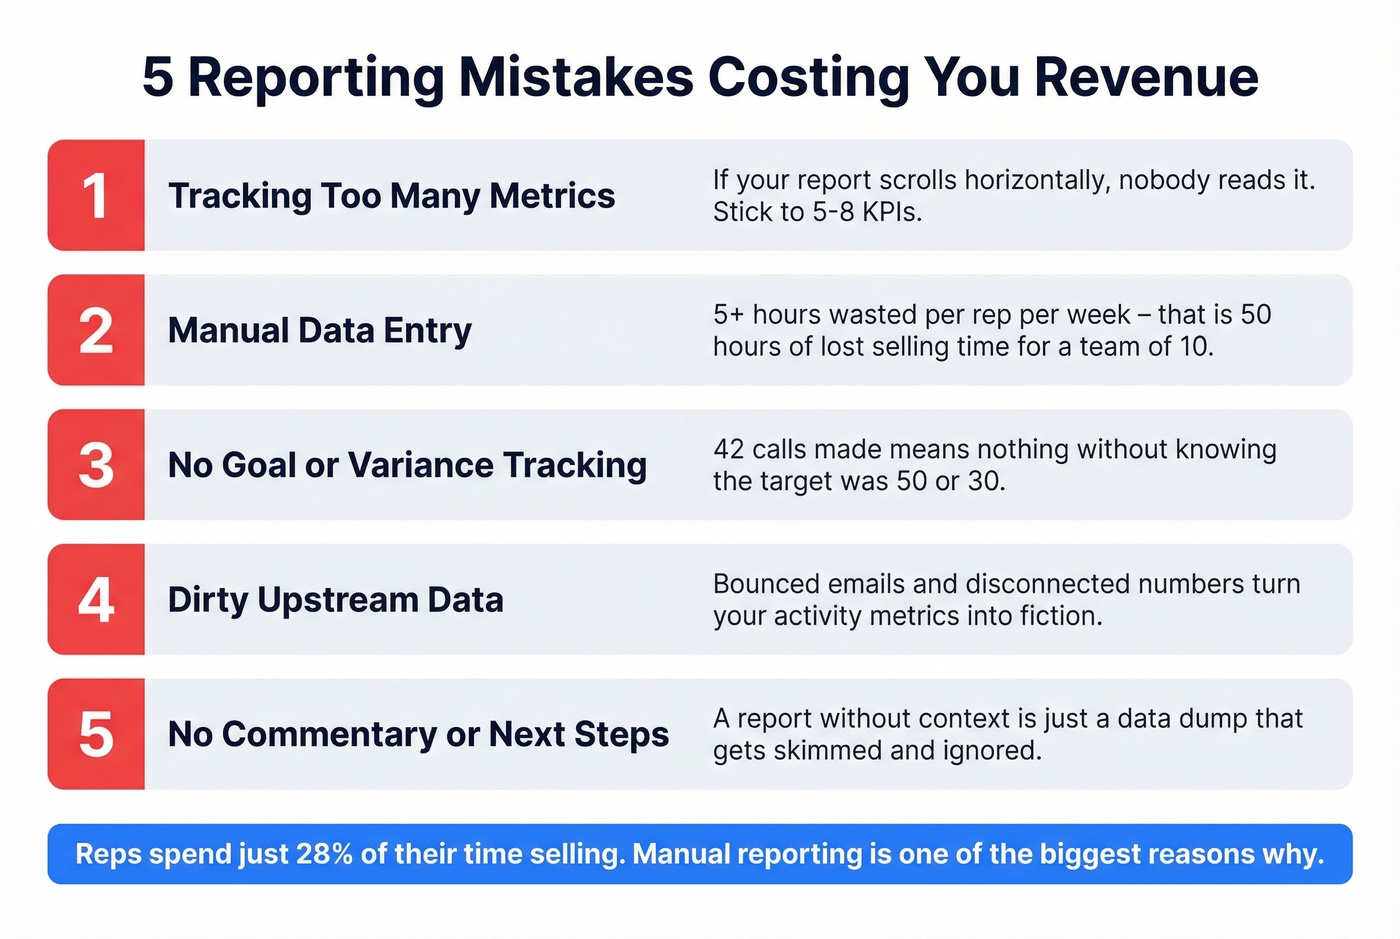
1. Tracking too many metrics. Nobody reads a 30-column spreadsheet. If your daily report requires scrolling horizontally, you've already failed. Stick to 5-8 KPIs that drive action. For a deeper KPI shortlist, see sales productivity metrics and sales KPIs examples.
2. Manual data entry instead of automation. Manual reporting can waste 5+ hours per week per rep. With a team of 10, that's 50 hours of selling time lost every single week to copying numbers between systems. Connect your CRM to your template and automate the pull.
3. No goal/variance tracking. A report that shows "42 calls made" means nothing without context. Was the goal 50? 30? 100? Without variance tracking, you can't tell if you're winning or losing.
4. Dirty upstream data. Your daily report is only as accurate as the data feeding it. If your CRM is full of bounced emails and disconnected numbers, your activity metrics are fiction. Clean your contact data upstream - tools like Prospeo run 98% email accuracy with a 7-day refresh cycle, which means when a rep logs 50 calls, those were real conversations with real prospects. If you want to benchmark tools, start with best email verification and bulk email verification service.
5. Reports without commentary or next steps. Look - a report without commentary is just a data dump. Add two to three bullets explaining what happened today, why it matters, and what to do tomorrow. That's the difference between a report that gets skimmed and one that drives action.
Making Your Report Actionable
The simplest framework for building a useful report follows five steps: define purpose, define audience, gather and clean data, visualize, then explain what the numbers mean. Most teams nail steps one through four and completely skip step five.
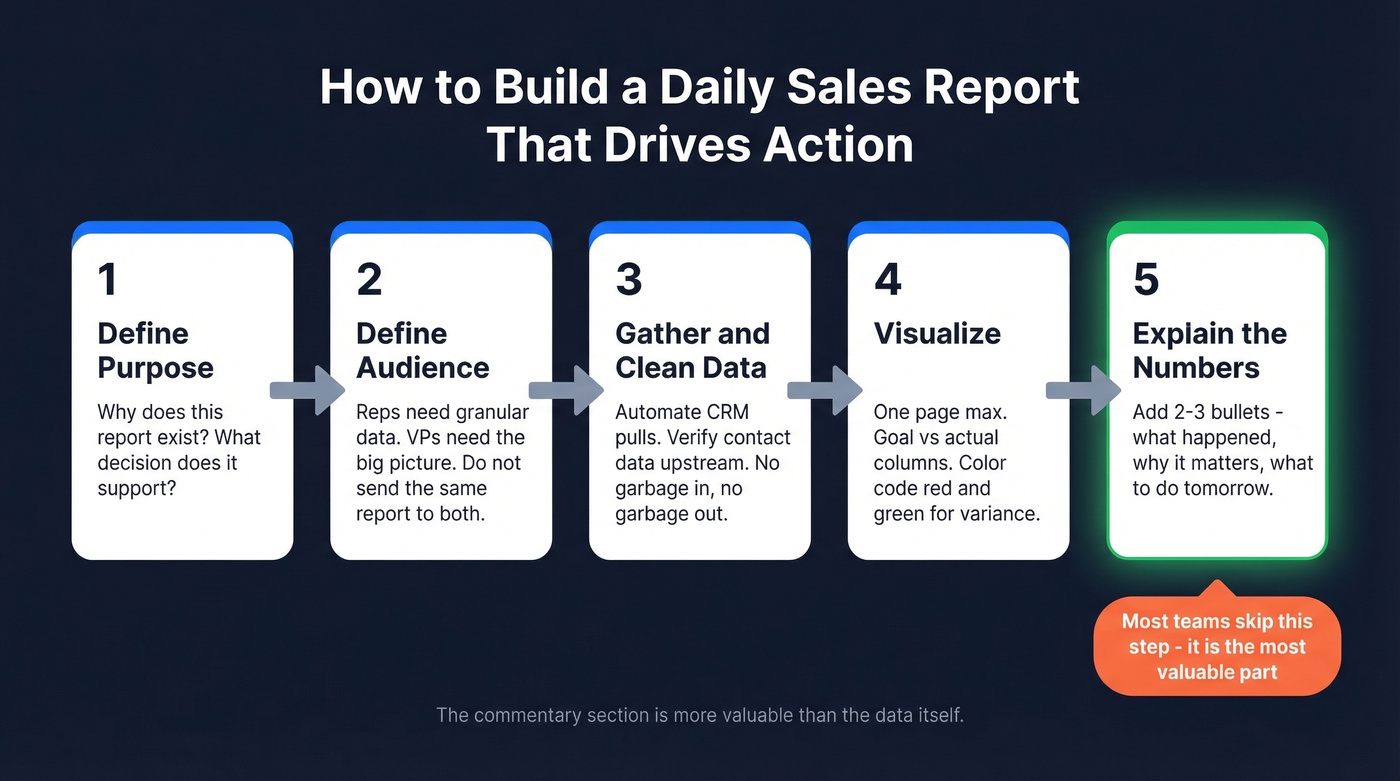
The commentary section is more valuable than the data itself. A red cell in a spreadsheet tells you something dropped. "Demos dropped 30% today because two reps were in all-day training" tells you why and what to do about it. In our experience, if your team only has time for one improvement to their daily report, add the commentary bullets. Everything else is table stakes.
For automation, Salesforce and HubSpot both offer native reporting dashboards. If you're running Google Sheets, Zapier or Make can connect your CRM data to your spreadsheet automatically - no manual exports, no version conflicts. If you want a manager-friendly view of the same data, pair this with a sales pipeline report and a sales operating rhythm.
Quick actionability checklist for every daily report:
- Does it fit on one page or one screen?
- Can a manager read it in under two minutes?
- Does it include goal vs. actual for every KPI?
- Are there two to three commentary bullets explaining the "why"?
- Is there at least one clear next step for tomorrow?
If you check all five, your daily sales report template is doing its job. Skip the ones that don't apply to your team - a three-person startup doesn't need the same rigor as a 50-rep org - but don't skip the commentary. That's non-negotiable. For more templates in the same family, use a sales activity report template or a weekly sales report template.
B2B daily sales reports should track contact accuracy alongside activity volume. Teams using Prospeo cut bounce rates from 35%+ to under 4% and book 26% more meetings - the kind of numbers that make your daily report worth reading.
Make every row in your daily report count for $0.01 per email.
FAQ
What should a daily sales report include?
Five to eight KPIs covering activity like calls, emails, and meetings, plus pipeline movement and revenue. Always include goal vs. actual variance and two to three bullets of commentary. Keep it to one page - if it takes more than two minutes to read, it's too long.
How long should filling it out take?
Under 10 minutes per rep if your template connects to your CRM. If it takes longer, you're tracking too many metrics or entering data manually that should be automated. A Google Sheets template with QUERY functions can cut this to under five minutes.
What's the difference between daily and weekly sales reports?
Daily reports track activity and pipeline movement - calls made, meetings booked, deals closed today. Weekly reports aggregate outcomes like conversion rates, revenue totals, and leaderboards. Daily shows what happened; weekly shows what it means.
Should I use Excel or Google Sheets?
Google Sheets if multiple people update the same report - real-time editing eliminates version conflicts entirely. Excel if you need advanced pivot tables, macros, or work offline regularly. Pick based on where your team already spends their time.
How do I make sure my daily sales data is accurate?
Automate data pulls from your CRM instead of relying on manual entry - that alone eliminates most errors. For outbound teams, verify contact data upstream so your activity metrics reflect real outreach, not bounced emails and disconnected numbers.