Sales KPI Examples: The Only Metrics That Actually Matter
Almost seven out of ten B2B reps still miss quota. Not because they're lazy - because they're measured on the wrong things. If you've ever sat through a Monday pipeline review with 15 dashboards open and nobody could answer "will we hit number this quarter?" then you don't have a performance problem. You have a KPI problem.
This guide breaks down the most useful sales KPIs with formulas, benchmarks, and the context you need to pick the right ones for your team.
Start Here: Five KPIs, Then Build
If you're overwhelmed, begin with these five:
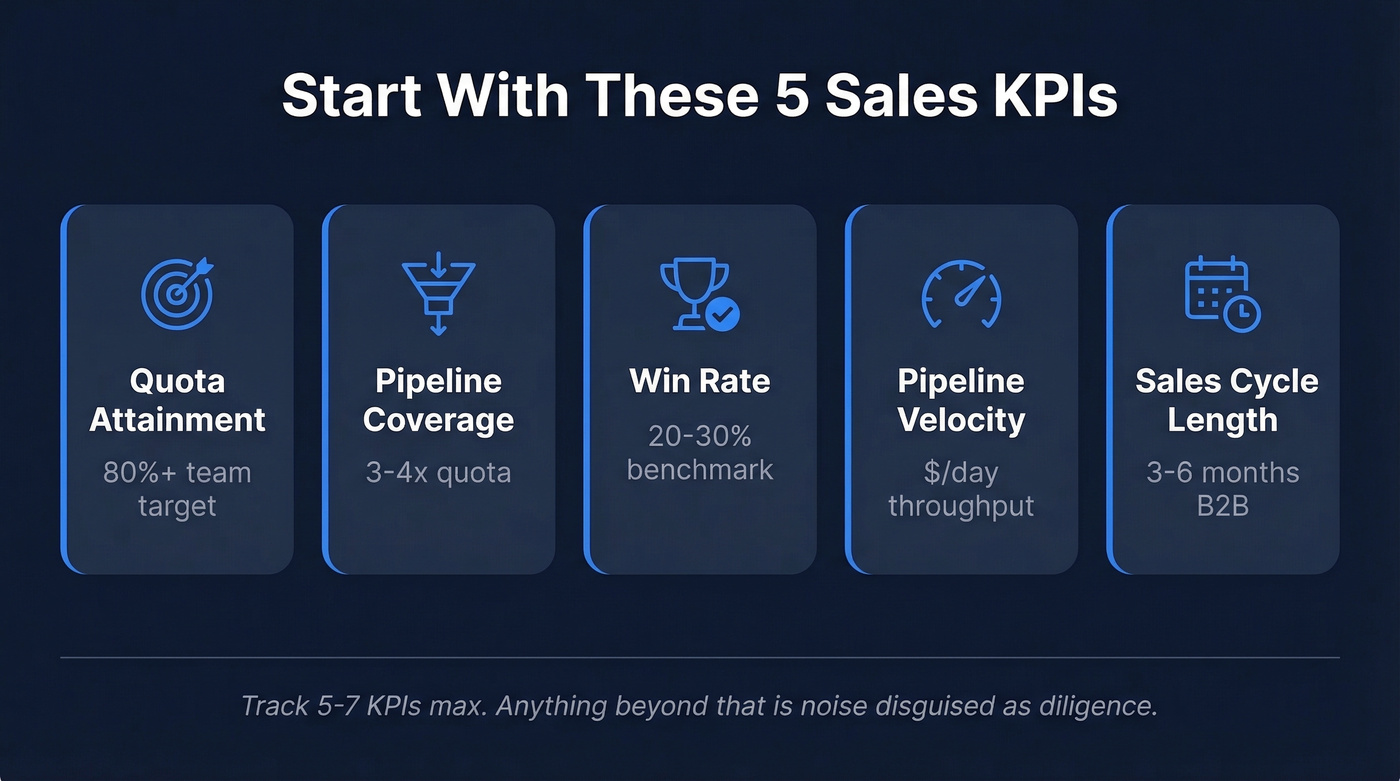
- Quota attainment
- Pipeline coverage ratio
- Win rate
- Pipeline velocity
- Average sales cycle length
Track five to seven KPIs max. Anything beyond that is noise disguised as diligence. Every additional metric dilutes focus and shifts reps from selling to reporting. We've seen teams with 20-metric dashboards where nobody could explain what any single number meant for next quarter's forecast.
What Sales KPIs Actually Are
A metric is any measurable data point - calls made, emails sent, proposals delivered. A KPI is a metric tied to a specific strategic goal. It tells you whether you're on track, not just what happened. NetSuite draws this distinction clearly: KPIs synthesize raw data into business-critical signals.
Every KPI needs five elements: the measure, a target, a data source, a reporting frequency, and an owner. If any of those are missing, it's not a KPI. It's a wish.
The framework that actually matters is Leading vs. lagging. Leading indicators - activity volume, meetings booked, pipeline created - predict future outcomes. Lagging indicators - revenue, win rate, retention - confirm what already happened. The best sales orgs track both, because leading indicators are the only ones you can still influence.
This guide focuses on B2B sales. B2C metrics like monthly user growth operate on completely different benchmarks and cycles.
How to Choose the Right KPIs
Don't copy someone else's dashboard. A PLG SaaS company and an enterprise services firm selling seven-figure contracts need fundamentally different KPIs. Klipfolio's research flags this as the number one mistake teams make - adopting KPIs that don't fit their business model.
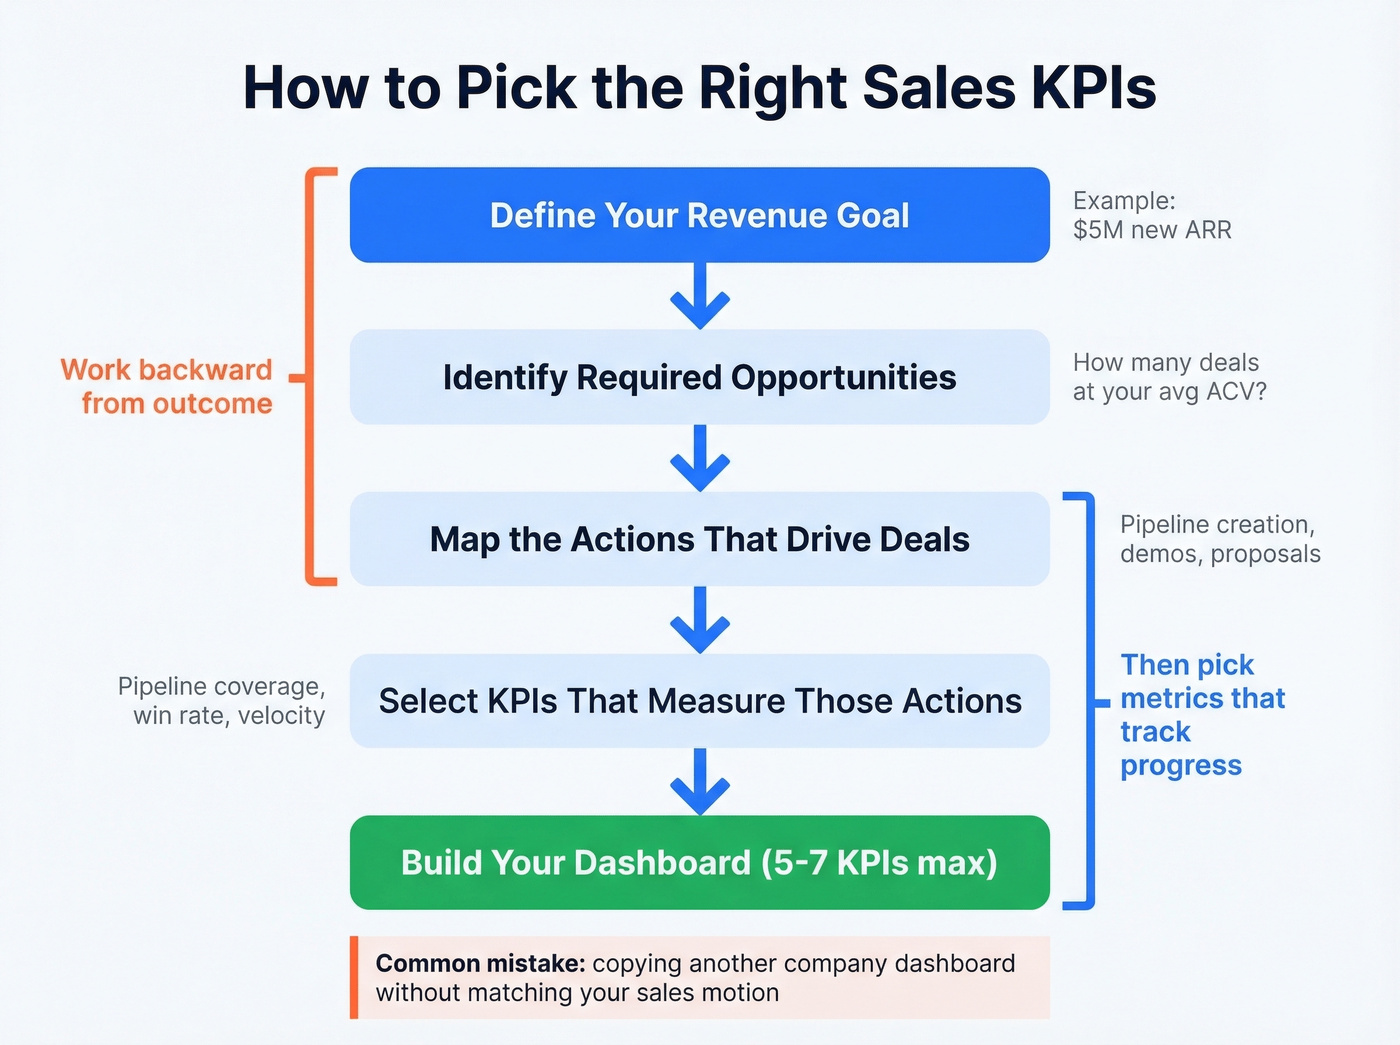
Work backward from your revenue goal. Outreach recommends defining the outcome first, identifying the actions that drive it, then selecting KPIs that tell you whether those actions are working. If your goal is $5M in new ARR, you need to know how many qualified opportunities that requires - which means pipeline coverage and conversion rates, not "emails sent."
20+ Sales KPIs With Formulas and Benchmarks
Revenue and Growth KPIs
These are the lagging indicators your board cares about. They confirm whether everything upstream is working.
| KPI | Formula | Benchmark | Owner |
|---|---|---|---|
| Total Revenue | Sum of closed-won deals | Track QoQ trend | VP Sales |
| MRR | Sum of monthly recurring revenue | 15-20% YoY growth (B2B SaaS) | VP Sales |
| ARR | MRR x 12 | 20-40% for growth-stage | VP Sales |
| Revenue Growth Rate | (Current - Prior) / Prior x 100 | 20-40% for growth-stage | VP Sales |
| Avg Deal Size (ACV) | Total revenue / # deals | Mid-market often targets $15K-$100K ACV | AE / VP |
| Profit Margin | (Revenue - Cost) / Revenue x 100 | 60-80% (SaaS gross margin) | Finance / VP |
| Sales Efficiency Ratio | Revenue / Cost of Sales | 3:1 or higher | VP Sales / RevOps |
The sales efficiency ratio is underrated. If you're spending $1 to generate $2 in revenue, your unit economics are broken regardless of how fast you're growing. This is the metric that separates companies that scale from companies that just spend.
Pipeline KPIs
Pipeline metrics bridge the gap between activity and revenue. Pipeline coverage is one of the cleanest predictors of whether you'll hit the quarter.
| KPI | Formula | Benchmark | Owner |
|---|---|---|---|
| Pipeline Value | Sum of open opportunities | Track QoQ trend | AE / VP |
| Pipeline Coverage | Pipeline value / quota | 3-4x quota | VP / RevOps |
| Pipeline Velocity | (Opps x Deal Size x Win Rate) / Cycle Days | See velocity section below | RevOps |
| Deal Slippage Rate | Slipped deals / total deals x 100 | <20% | AE / Manager |
Pipeline coverage below 3x is a red flag. At that ratio, you need to win nearly every deal to hit number - and nobody does that consistently.
Activity KPIs
Cold outbound lead-to-customer conversion runs around 2-3%. Warm lead-to-customer conversion runs around 15-20%. That gap alone should dictate where you invest rep time, and it's the single most important context for interpreting every activity metric below.
| KPI | Formula | Benchmark | Owner |
|---|---|---|---|
| Calls Made | Count per rep/day | Track trend; aim for consistency | SDR / AE |
| Emails Sent | Count per rep/day | Open rate 20-30%; response rate 8-10% | SDR |
| Meetings Booked | Count per rep/week | Calls-to-meeting 1:8-1:15 | SDR |
| Lead Response Time | Time from inbound to first touch | Sub-5 minutes | SDR |
| Demos Conducted | Count per rep/week | Track conversion to opp | AE |
Here's the thing: these benchmarks assume verified contact data. If 30%+ of your emails bounce, your activity KPIs are fiction, not feedback. Prospeo verifies emails at 98% accuracy on a 7-day refresh cycle, so the numbers you're tracking actually reflect reality. (If bounce is a recurring issue, start with email bounce rate benchmarks and fixes.)
Conversion KPIs
Win rate is the metric most teams obsess over, but it's only useful in context. A 40% win rate with terrible pipeline coverage means you're cherry-picking deals, not building a scalable engine. The most common complaint we see in sales communities: reps being measured on conversion when the real problem is lead quality upstream.
| KPI | Formula | Benchmark | Owner |
|---|---|---|---|
| Win Rate | Won deals / total opps x 100 | 20-30% | AE |
| Close Rate | Closed deals / qualified leads x 100 | 15-25% | AE |
| Lead-to-Customer Ratio | Customers / total leads x 100 | 2-5% (cold); 15-20% (warm) | Marketing / SDR |
| Quote-to-Close Ratio | Closed / quotes sent x 100 | 25-40% | AE |
| Sales Cycle Length | Avg days from opp creation to close | 3-6 months (B2B) | AE / RevOps |
Customer KPIs
Acquiring a customer is expensive. Keeping them is where the margin lives. These matter most for recurring revenue models, and they're the metrics that separate good quarters from good companies.
Customer Lifetime Value should run at least 3x your CAC. If it doesn't, you're subsidizing growth with future losses. Annual churn below 7% is generally acceptable for B2B SaaS. Expansion revenue - upsells and cross-sells - should account for 20-30% of total ARR in mature orgs. NPS in B2B SaaS typically ranges from 30-50, though the trend matters more than the absolute number.
Two often-overlooked team health metrics: sales team turnover should stay below 15% annually, and rep ramp-up time typically runs 3-6 months for B2B roles. If either number is off, your customer KPIs will suffer downstream no matter how good your process looks on paper.
Activity KPIs like calls-to-meeting ratio and email response rate collapse when your contact data is wrong. Prospeo delivers 98% email accuracy on a 7-day refresh cycle - so the metrics on your dashboard actually reflect rep performance, not bad data.
Stop measuring fiction. Start with verified contacts at $0.01 each.
Pipeline Velocity: The One KPI to Rule Them All
If you could only track one sales KPI, pipeline velocity is the answer. It captures all four levers of revenue generation in a single number.
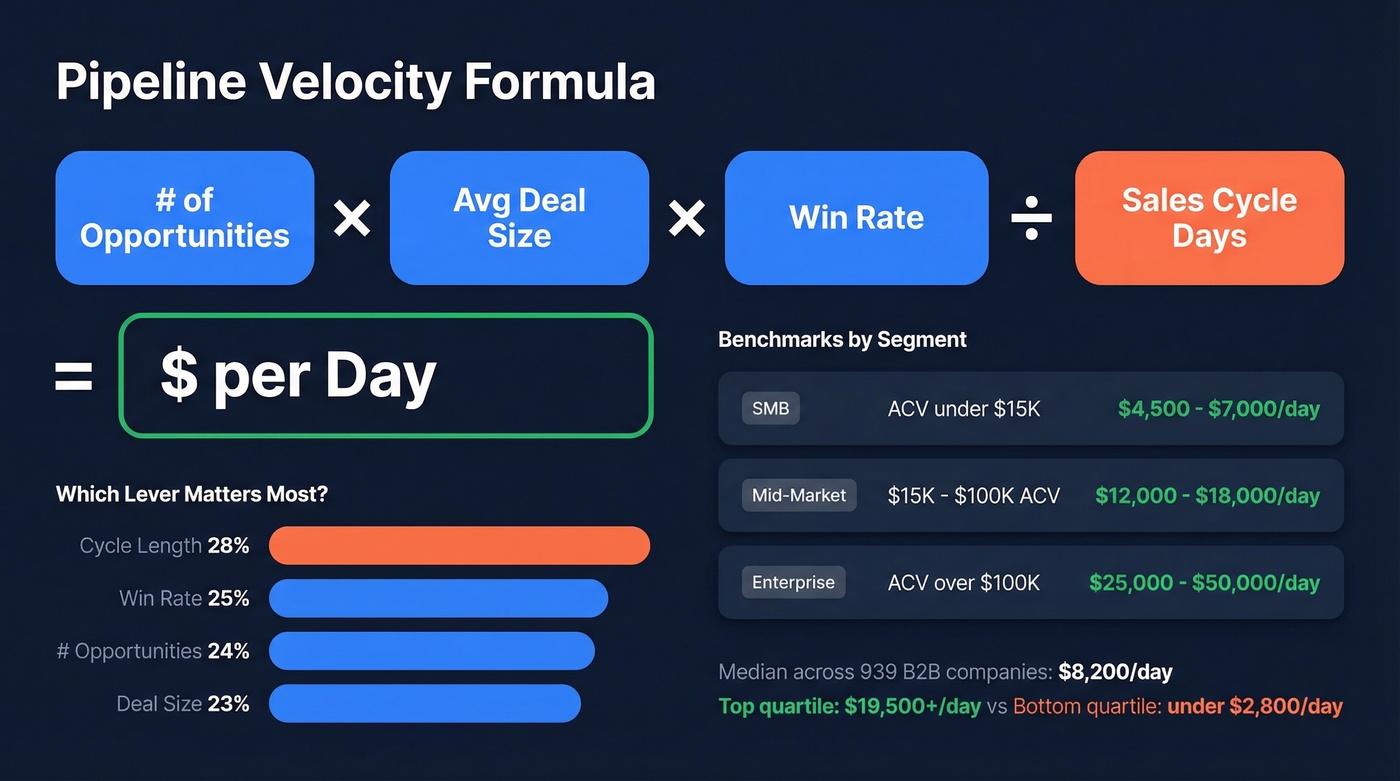
Formula: (# Opportunities x Avg Deal Size x Win Rate) / Sales Cycle Days = $/day
A dataset of 939 B2B companies from Q1-Q3 2025 puts the median at $8,200/day, roughly $3M annualized. The segment cuts are where it gets interesting:
| Segment | ACV Range | Velocity ($/day) |
|---|---|---|
| SMB | <$15K | $4,500-$7,000 |
| Mid-Market | $15K-$100K | $12,000-$18,000 |
| Enterprise | >$100K | $25,000-$50,000 |
Top-quartile companies run at $19,500+/day. Bottom quartile sits below $2,800/day. That's roughly a 7x gap.
Which lever matters most? Sales cycle length has the biggest impact at 28%, followed by win rate at 25%, number of opportunities at 24%, and deal size at 23%. Most teams default to "generate more pipeline" when they'd get faster results by shortening their cycle or improving win rates on existing deals.
Let's be honest: if your average contract value sits below $15K, you probably don't need a complex KPI stack. Pipeline velocity plus win rate will tell you 80% of what you need to know. Save the 12-metric dashboards for enterprise sales motions where the cycle length and deal complexity justify the overhead.
Salesperson KPI Examples by Role
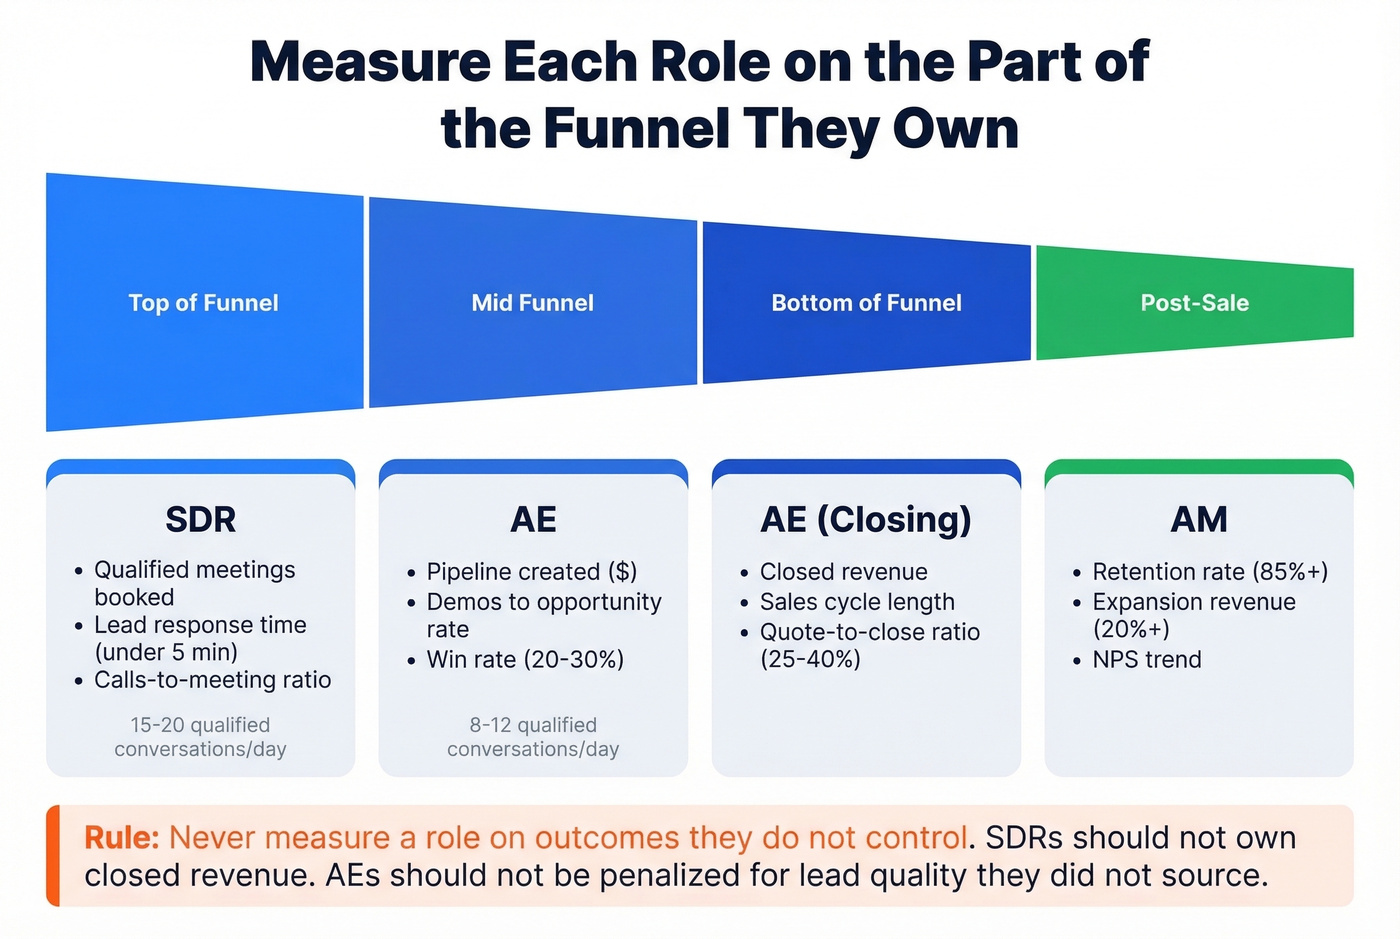
Measuring everyone on the same KPIs is a recipe for confusion. Each role owns a different part of the funnel.
| Role | Primary KPIs | Target Examples |
|---|---|---|
| SDR | Qualified meetings, lead response time | 15-20 qualified conversations/day |
| AE | Pipeline created, closed revenue, win rate | 8-12 qualified conversations/day |
| AM | Retention rate, expansion revenue | 85%+ retention, 20%+ expansion |
| VP Sales | Quota attainment, forecast accuracy, velocity | 80%+ team attainment |
SDRs should never be measured on closed revenue - they don't control it. AEs shouldn't be penalized for lead quality they didn't source. Highspot's framework puts it simply: measure each role on the part of the funnel they own. If you're a small team where one person does everything from prospecting to closing, collapse the SDR and AE rows and pick three metrics total. (If you need a tighter funnel view, use a B2B sales funnel template to map ownership.)
5 KPI Mistakes That Kill Performance
1. Copying someone else's KPIs. What works for a 200-person enterprise sales org won't work for a 10-person startup. Your KPIs need to reflect your sales motion, cycle length, and team structure.
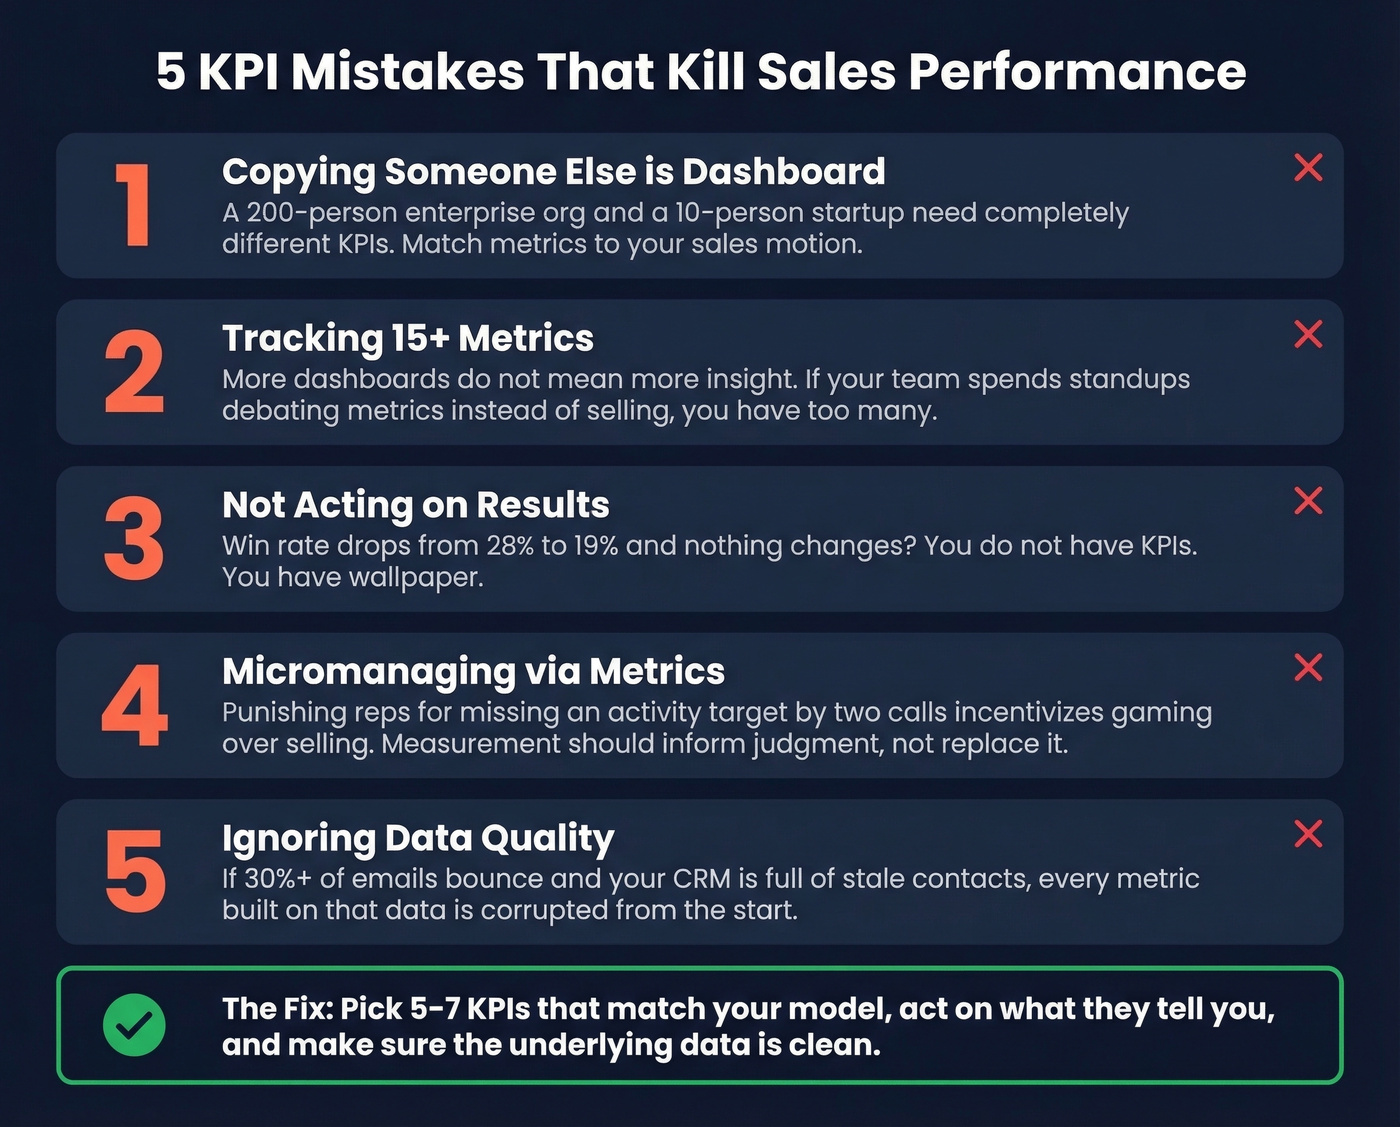
2. Tracking 15+ metrics. More dashboards don't mean more insight. I've watched teams spend entire Monday standups debating metrics that don't connect to revenue. That's not analysis - it's procrastination with charts.
3. Not acting on results. If your win rate drops from 28% to 19% and nothing changes, you don't have KPIs. You have wallpaper.
4. Micromanaging via metrics. Jerry Muller nailed it in The Tyranny of Metrics: measurement should inform judgment, not replace it. The moment you punish reps for missing an activity target by two calls, you've incentivized gaming over selling.
5. Ignoring data quality. If your CRM is full of stale contacts and invalid emails, every metric built on that foundation is corrupted. Your "email open rate" is artificially low because half the list bounced. Your "conversion rate" is depressed because the denominator includes dead leads. Skip this problem early or you'll spend months debugging phantom performance issues. (A quick fix is lead enrichment plus ongoing verification.)
How to Track Sales KPIs
CRM dashboards are the starting point. Organizations that implement proper sales dashboards see a 29% average increase in sales. Teams using mobile CRM hit targets at a 65% rate versus 22% for those without mobile access. The tool matters less than the discipline.
Set a review cadence and stick to it. Daily: activity metrics. Weekly: pipeline health. Monthly: conversion metrics. Quarterly: strategic KPIs like revenue growth and team health.
Your dashboards are only as good as the data feeding them. If your CRM has stale contacts, your activity KPIs are inflated and conversion rates artificially depressed. Prospeo refreshes contact data every 7 days - the industry average is 6 weeks. Upload a CSV, run it through verification, and push clean data back to your CRM. The whole process takes minutes, and it's the single fastest way to make every KPI on your dashboard trustworthy. (If you're evaluating tooling, start with sales forecasting solutions and best contact management software.)
Pipeline velocity depends on four variables - and bad contact data quietly kills three of them. Fewer real opportunities, longer cycles chasing wrong contacts, and deflated win rates. Prospeo gives your team 300M+ verified profiles so every pipeline KPI tracks real selling activity.
Fix your pipeline velocity at the source - the data layer.
FAQ
What's the difference between a sales KPI and a metric?
A metric is any measurable data point. A KPI is a metric tied to a specific strategic goal with a defined target, owner, and review cadence. Every KPI is a metric, but most metrics aren't KPIs - the distinction is whether it directly signals progress toward a revenue outcome.
How many sales KPIs should a team track?
Five to seven. Teams tracking more spend more time reporting than selling. Pick the metrics that directly connect to your revenue goal - typically quota attainment, pipeline coverage, win rate, velocity, and cycle length - and ignore the rest until a specific problem demands a new lens.
What are the best sales KPI examples for SDRs?
Qualified meetings booked and lead response time. SDRs control the top of the funnel, so their KPIs should reflect pipeline generation, not closed revenue. A strong SDR target is 15-20 qualified conversations per day with sub-5-minute response time on inbound leads.
How often should you review sales KPIs?
Daily for activity metrics like calls and emails. Weekly for pipeline health - coverage, velocity, slippage. Monthly for conversion metrics like win rate and cycle length. Quarterly for strategic KPIs like revenue growth, efficiency ratio, and team turnover.
How do I know if my sales KPIs are accurate?
Start with your data. If your CRM bounce rate exceeds 5% or contact records are older than 30 days, your activity and conversion KPIs aren't reliable. Clean data is the foundation - tools like Prospeo that refresh records weekly and verify emails at 98% accuracy keep the numbers beneath your metrics honest. At roughly $0.01 per lead, data hygiene shouldn't be a budget conversation.