Data Quality Assessment: The Framework, Formulas, and Tools You Actually Need
83% of professionals don't use any data quality scoring model. They eyeball it, run a few spot checks, maybe open a spreadsheet and scroll. Then they wonder why their AI initiative produces garbage outputs or their outbound sequences bounce at 28%.
A data quality assessment isn't optional anymore. It's the gate between "we have data" and "we have data we can actually use."
What You Need (Quick Version)
- Pick 3-4 dimensions that matter for your use case (not all six). Measuring everything equally wastes time.
- Measure each with a formula and produce a numeric health score per dataset.
- Automate recurring checks - one-time audits are worthless.
- If your problem is CRM/contact data decay, start with a verification tool before building a full pipeline.
What Is a Data Quality Assessment?
A data quality assessment (DQA) is a structured process for measuring whether your data is fit for its intended purpose. That last part matters. "Fit for purpose" means a dataset that's perfectly fine for marketing dashboards might be dangerously unreliable for training a predictive model.
DQA isn't the same as data profiling. Profiling examines structure, distributions, and patterns - it tells you what your data looks like. An assessment goes further: it measures data against defined thresholds, scores the results, and produces a prioritized list of issues. Profiling is one step inside a full evaluation, not a substitute for it.
Why DQA Matters in 2026
The cost of bad data has always been real, but the stakes just got higher. IBM's analysis puts it bluntly: 43% of chief operations officers identify data quality as their most significant data priority, and over a quarter of organizations estimate they lose more than $5 million annually to poor data quality. Seven percent report losses exceeding $25 million.
Those numbers get worse when you factor in AI. Gartner forecasts AI spending will surpass $2 trillion in 2026 with 37% year-over-year growth, and 45% of business leaders cite data accuracy concerns as the leading barrier to scaling AI initiatives. Meanwhile, 79% of organizations are adopting AI agents in some form - and every one of them needs clean data to function. You can't throw money at models and expect results if the training data is riddled with duplicates, nulls, and stale records.
This isn't a theoretical problem. A data engineer on r/dataengineering recently asked how others monitor quality beyond ETL failures - specifically wanting trackable metrics like "% of nulls per column." A ServiceNow user described running a DQA because poor ITSM data was preventing Predictive Intelligence from working. Teams are hitting the wall in production, not in planning decks. And yet, a cross-country survey of 117 professionals found that 83% aren't using any quality scoring model. Most organizations are flying blind.
Here's the thing: if your average deal size is under $50K and you haven't done a single formal assessment, your AI roadmap is a fiction. Fix the data first.
The 6 Data Quality Dimensions
Standards like ISO 8000 and DAMA-DMBOK are commonly referenced when teams talk about quality dimensions. You don't need to measure all six equally - prioritize by business risk - but you should know what each one captures.
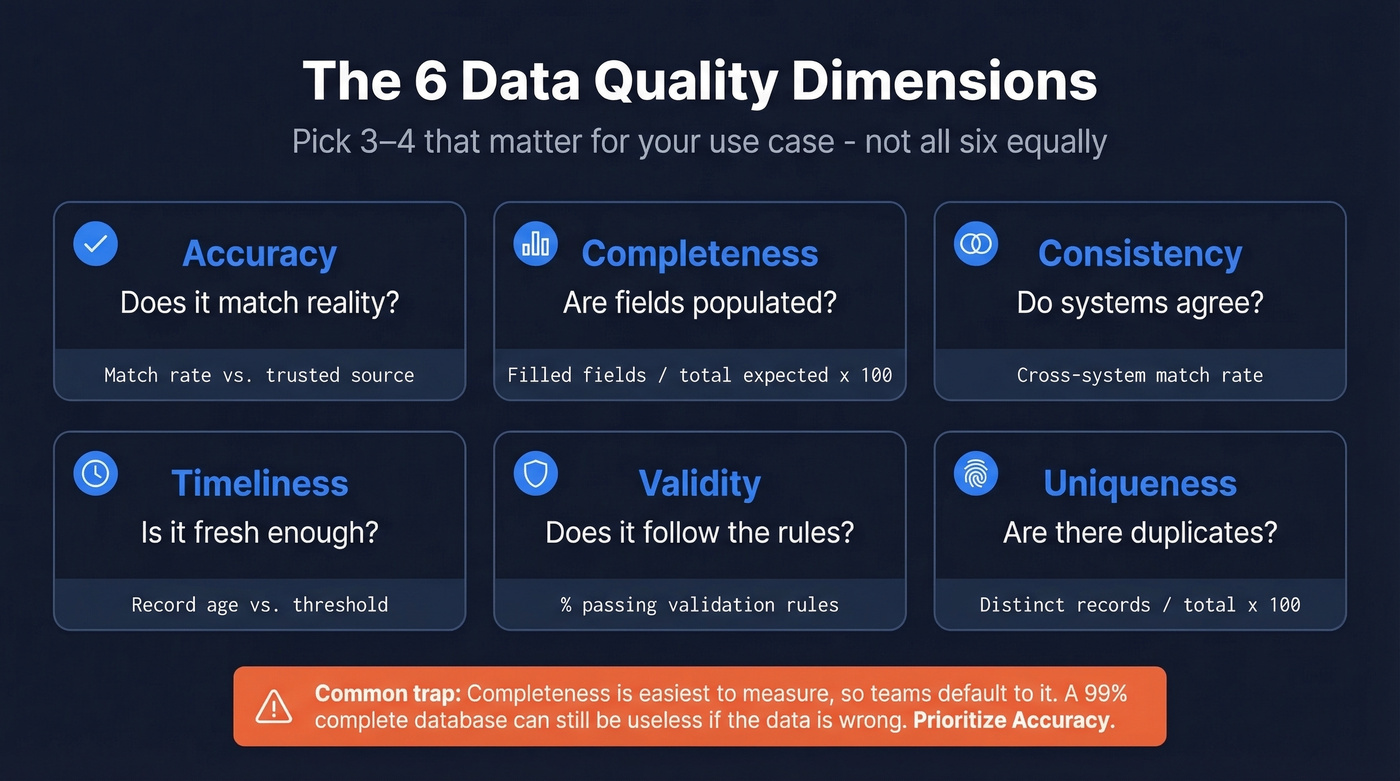
| Dimension | What It Measures | Formula / Method | Example |
|---|---|---|---|
| Accuracy | Correctness vs. reality | Match rate vs. trusted source | CPI values vs. Bureau of Stats |
| Completeness | Populated vs. expected | Filled fields / total expected x 100 | 92% of contacts have email |
| Consistency | Agreement across systems | Cross-system match rate | CRM vs. billing address match |
| Timeliness | Freshness for the use case | Age of record vs. threshold | Contact updated < 90 days ago |
| Validity | Conforms to format rules | % passing validation rules | Email matches regex pattern |
| Uniqueness | No unwanted duplicates | Distinct records / total x 100 | 98% unique after dedup |
Completeness is the easiest to measure and the one teams default to. That's a trap. A database can be 99% complete and still useless if the data in those fields is wrong. Accuracy - comparing records against a trusted reference source - is harder to measure but almost always more important.
You just read that 83% of teams don't score data quality - and that accuracy matters more than completeness. Prospeo's 5-step verification delivers 98% email accuracy with a 7-day refresh cycle, so your CRM never decays into the mess you're trying to assess.
Fix the root cause instead of auditing the symptoms.
6-Step Assessment Framework
Don't build your own framework from scratch. The pattern below draws from DQOps and Monte Carlo's evaluation model, adapted for how teams actually work.
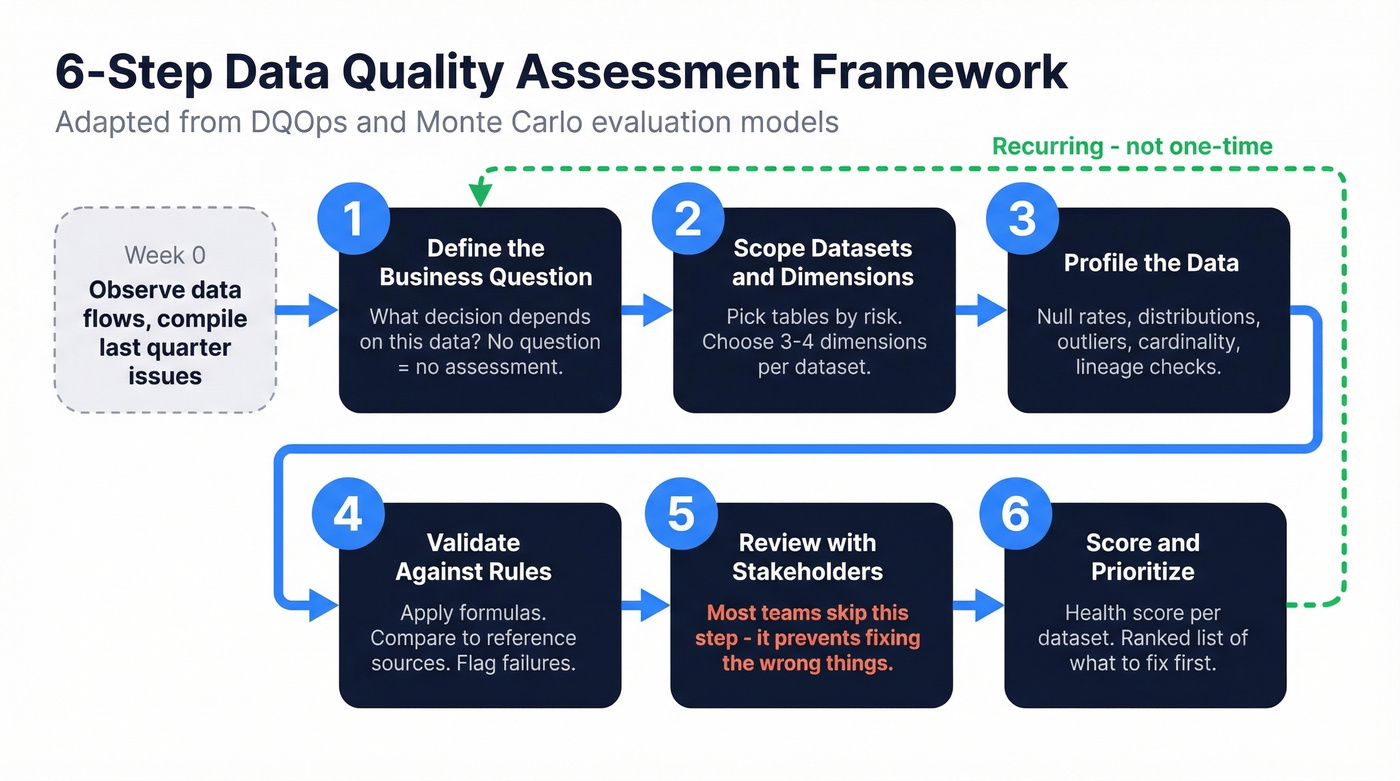
Before you start: spend a week observing your data flows and compiling last quarter's known issues. This gives Step 1 a foundation.
Step 1: Define the business question. Every assessment needs a trigger. "We're launching a predictive lead scoring model" is a business question. "Let's check our data" isn't. The question determines which dimensions matter and what thresholds count as passing.
Step 2: Scope datasets and choose dimensions by risk. You don't need to assess everything. Prioritize the tables and fields that feed your highest-risk decisions. A B2B contact table feeding outbound sequences needs accuracy and timeliness. A product catalog needs consistency and validity. Pick 3-4 dimensions per dataset.
Step 3: Profile the data. Run distributions, null rates, outlier detection, and cardinality checks. Understanding data lineage - where records came from and how they were transformed - helps pinpoint where quality breaks down. This is where you discover that 14% of your "phone number" field contains email addresses, or that your "state" column has dozens of unique values due to formatting drift.
Step 4: Validate against rules and reference sources. Apply the formulas from the dimensions table. Compare email formats against validation rules. Match company names against a reference database. Flag records that fail thresholds. If you’re building recurring checks, data validation automation is the lever that makes DQA sustainable.
Step 5: Review findings with stakeholders. In our experience, this is where most teams skip - and it's the step that prevents you from fixing the wrong things. Data teams find issues. Business teams decide which ones matter. A 15% null rate on "industry" might be acceptable for marketing but fatal for ABM targeting. If you’re doing ABM, align your thresholds to account based marketing benchmarks instead of generic “clean data” goals.
Step 6: Produce a scored report with prioritized issues. Don't hand stakeholders a spreadsheet of errors. Give them a health score and a ranked list of what to fix first.
How to Score Your Results
A health score turns subjective "the data looks okay" into something measurable and trackable. The simplest approach: score each dimension on a 0-100 scale, then weight them by importance for your use case.
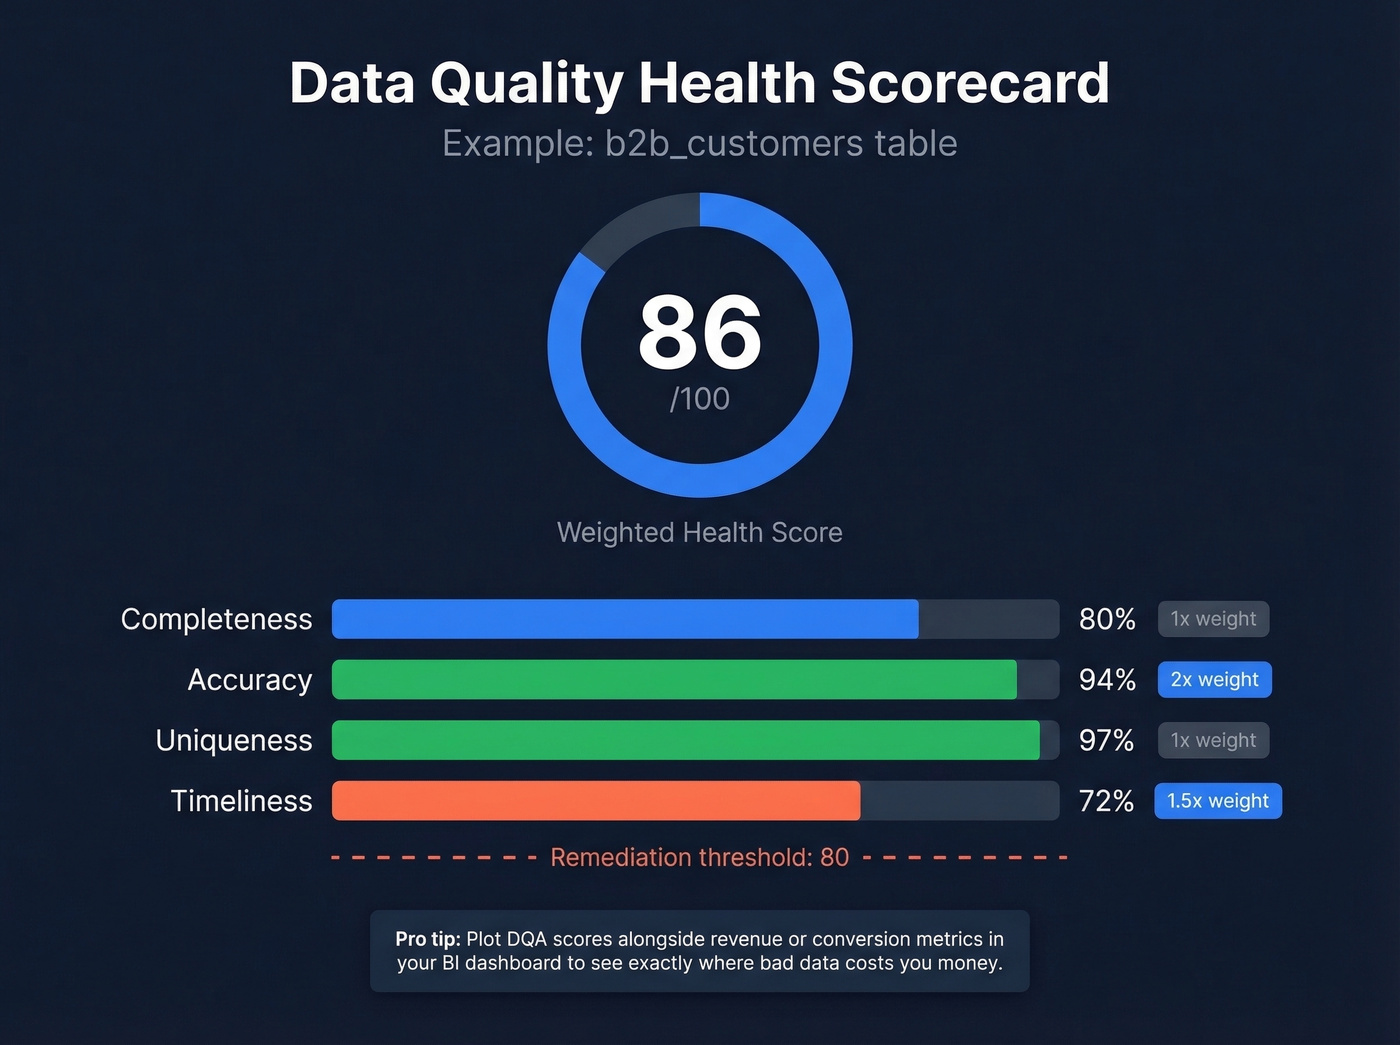
Here's what a scorecard looks like in practice:
b2b_customers table: Completeness 80% - Accuracy 94% - Uniqueness 97% - Timeliness 72% Weighted health score: 86/100 (accuracy weighted 2x, timeliness weighted 1.5x)
Academic research on industrial data quality pipelines supports normalizing scores to a 0-1 range for cross-dataset comparison. The format matters less than the habit. Once you have a number, you can set thresholds ("below 80 triggers a remediation sprint"), track trends over time, and create accountability.
Plotting DQA scores alongside revenue or conversion metrics in a BI dashboard reveals exactly where bad data is costing you money. Without a score, data quality is just vibes. If you want a revenue-side lens, tie the score to sales funnel analysis so stakeholders see the downstream impact.
6 Common DQA Mistakes
The UK Government's data quality team published a list of pitfalls that's unusually practical. We've seen every one of these in the wild.
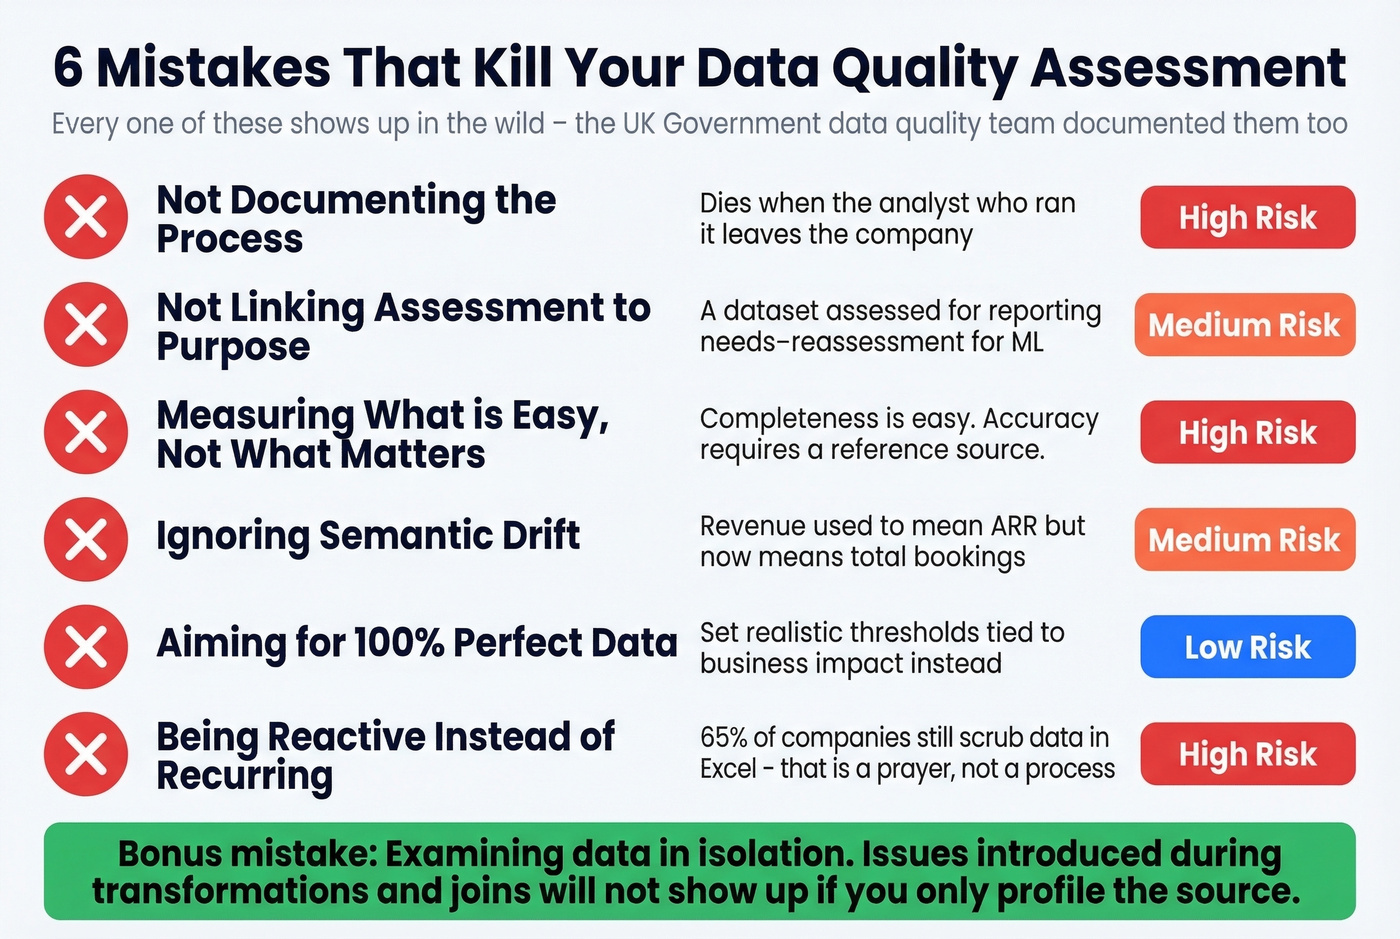
- Not documenting the process. If your assessment isn't reproducible, it's a one-off exercise that dies when the analyst who ran it leaves.
- Not linking assessment to purpose. A dataset assessed for reporting needs reassessment when it's repurposed for ML training. Fitness for purpose changes.
- Measuring what's easy instead of what matters. Completeness is easy to check. Accuracy requires a reference source. Teams default to completeness and call it done.
- Ignoring semantic drift. Business definitions evolve but field labels don't. Technical validation won't catch a "revenue" field that used to mean ARR but now means total bookings. Review field definitions alongside the data itself.
- Aiming for 100%. Perfect data quality doesn't exist. Set realistic thresholds tied to business impact, not theoretical ideals.
- Being reactive instead of recurring. 65% of companies still scrub data in Excel. That's not a process - that's a prayer. Schedule recurring assessments or the problems compound.
One more that doesn't make official lists: examining data in isolation. Data passes through transformations, joins, and enrichments. Issues introduced during processing won't show up if you only profile the source.
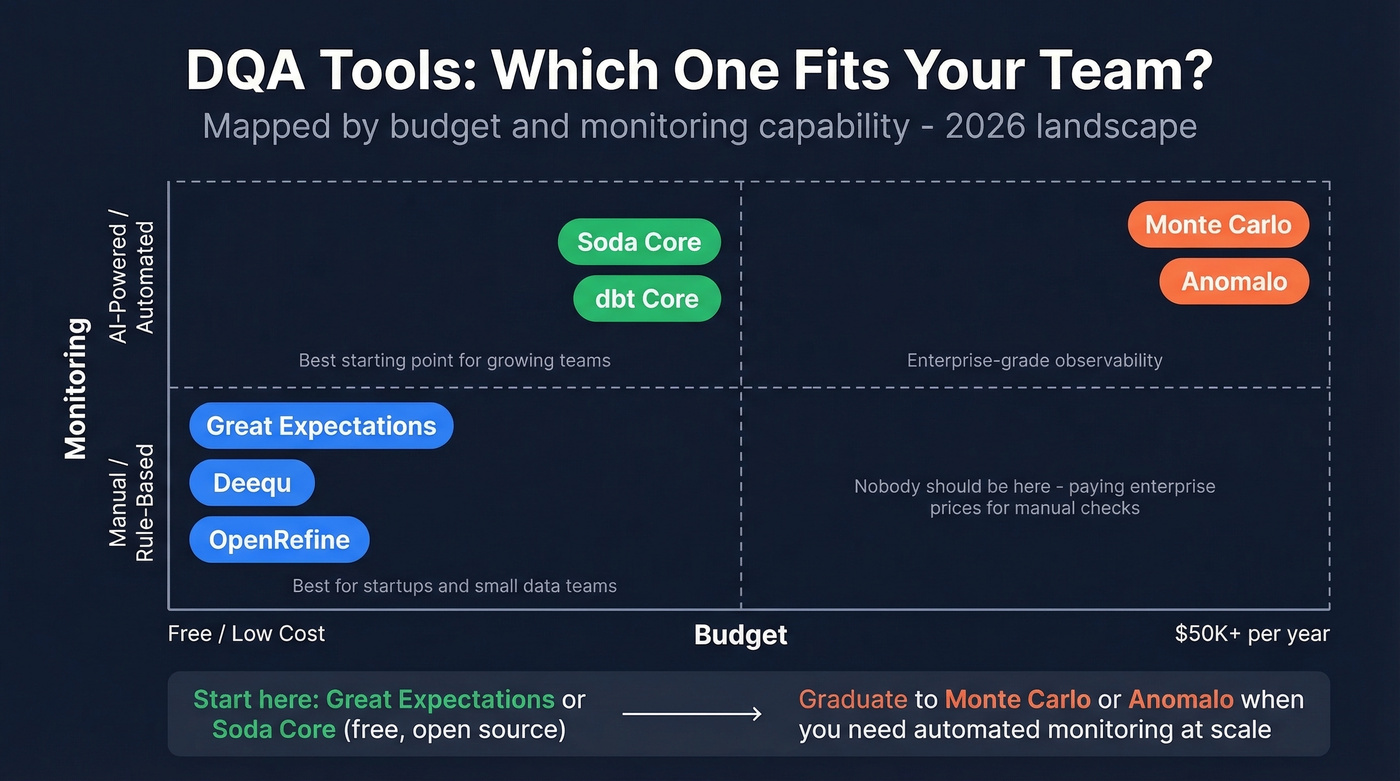
DQA Tools Compared
The tooling market splits into open-source frameworks and commercial data observability platforms - tools that monitor quality continuously rather than checking it on demand.
| Tool | Year | Deployment | AI Monitoring | Approx. Pricing |
|---|---|---|---|---|
| Great Expectations | 2017 | OSS / On-Prem | No | Free; Cloud ~$500/mo |
| Soda Core | 2022 | OSS / On-Prem | Yes | Free; Cloud ~$500/mo |
| Deequ | 2018 | OSS / On-Prem | No | Free |
| dbt Core | 2021 | OSS / On-Prem | Yes | Free; Cloud ~$100/mo/seat |
| Monte Carlo | 2019 | Cloud only | Yes | ~$50K-$150K/yr |
| Anomalo | 2021 | Cloud / On-Prem | Yes | ~$50K-$100K/yr |
| OpenRefine | - | OSS / On-Prem | No | Free |
Gartner's 2026 evaluation criteria for augmented data quality solutions now includes "AI assistant evaluation" as a criterion, and they project 70% of organizations will adopt modern data quality solutions to support AI initiatives by 2027. When evaluating automation capabilities, focus on baseline learning, monitoring coverage, schema drift detection, and timeliness enforcement. Rule-based checks miss slow-moving anomalies - like completeness declining 0.3% per month - that only ML-based monitoring catches.
The recommendation is simple. For pipeline and warehouse DQA, start with Great Expectations or Soda Core. Both are free, both are open source. Graduate to Monte Carlo or Anomalo when you need automated monitoring at scale. Skip Anomalo if you're not ready for a five-figure annual commitment - it's built for enterprise data teams, not scrappy startups.
If your DQA scope includes contact and firmographic enrichment, compare options in our guide to the best data enrichment tools.
The Problem Nobody Talks About - Your CRM
Every framework above assumes you're assessing warehouse or pipeline data. But the dataset most B2B teams should assess first is the one they touch every day: their CRM contacts.
CRM duplication rates run up to 20%. Variations in names and addresses account for 60% of data quality challenges. And 70% of organizations struggle with record matching because they lack the right tooling. B2B contact data decays constantly - people change jobs, companies rebrand, emails go stale. Run a data quality assessment on your CRM and you'll likely find the source of that 28% bounce rate hiding in plain sight. If you’re tightening processes, CRM automation software can reduce manual errors that create duplicates.
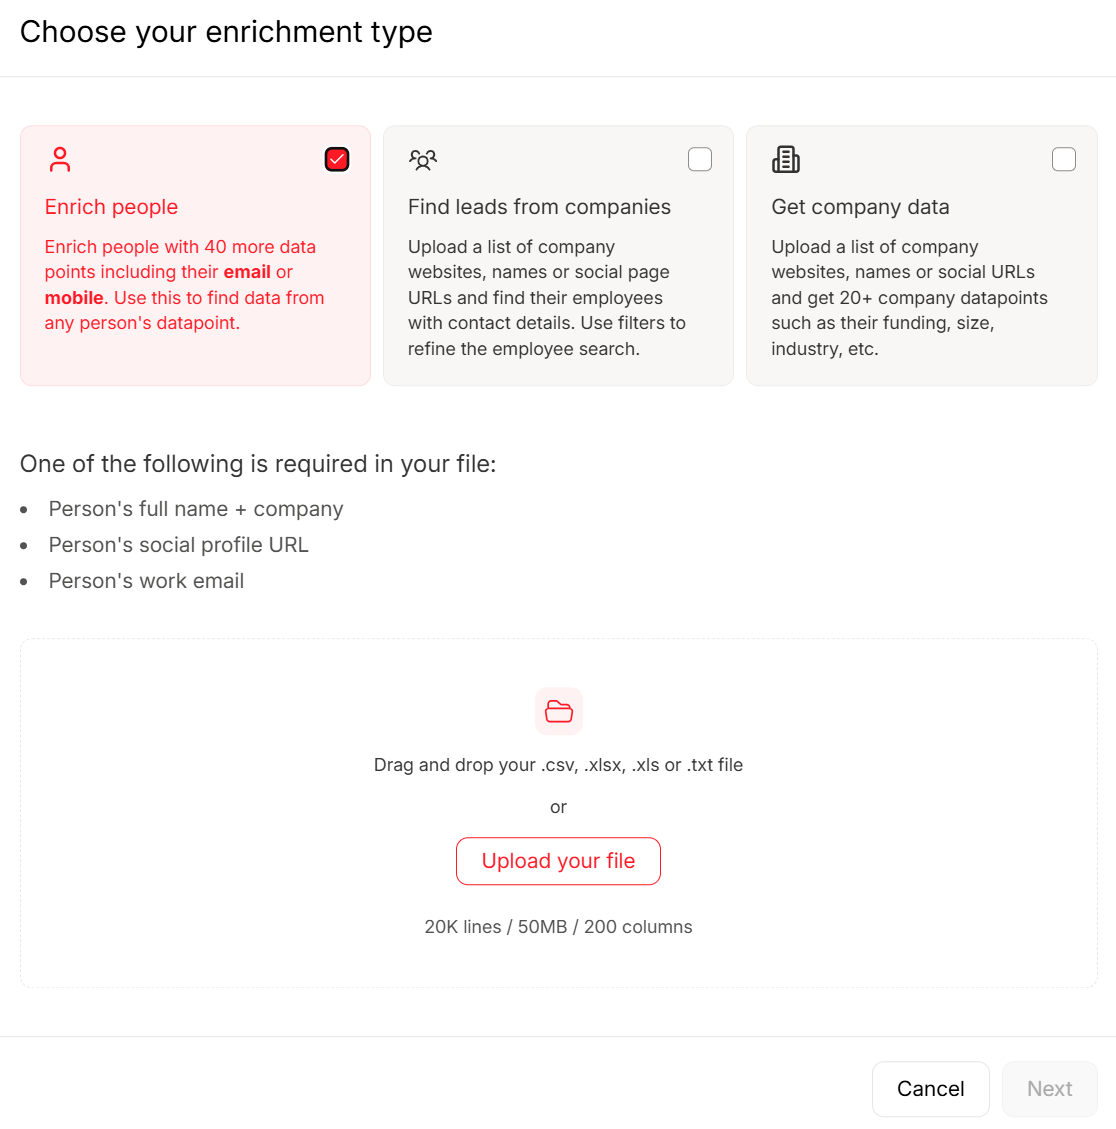
When your assessment reveals contact data is the weak link, fix the source. Prospeo's 5-step email verification process handles catch-all domains, spam traps, and honeypots, delivering 98% email accuracy across 143M+ verified addresses. The 7-day data refresh cycle means records don't go stale between quarterly audits the way they do with tools refreshing every six weeks. Upload a CSV, verify in bulk, push clean data back to your CRM. It's the fastest way to turn a failing DQA score into a passing one for contact data specifically. If you’re evaluating vendors, start with an email verifier comparison before you commit.
If your timeliness score is dragging down your health score, your data provider is the problem. Most vendors refresh every 6 weeks. Prospeo refreshes every 7 days across 300M+ profiles - keeping bounce rates under 4% for teams like Snyk and Meritt.
Stop scoring stale data. Start with data that stays fresh.
FAQ
What's the difference between data profiling and a data quality assessment?
Data profiling examines structure, patterns, and distributions - it tells you what your data looks like. A DQA measures data against fitness-for-purpose thresholds and produces a scored report with prioritized issues. Profiling is one input to a full assessment, not a replacement for it.
How often should you run an assessment?
At minimum quarterly, and always before launching a new analytics or AI initiative. For CRM contact data, monthly checks are better - B2B records decay fast as people change roles. Scheduled assessments catch systemic drift before it compounds.
Can you assess CRM contact data quality?
Yes, and you should. CRM duplication rates hit 20% and bounce rates above 5% signal immediate problems. Start by checking for duplicates, invalid emails, and records older than 90 days, then use a verification tool to remediate the worst offenders.