The Email Conversion Rate Formula (And the Part Everyone Gets Wrong)
Your email manager says the last campaign converted at 4.2%. Your VP pulls up the same data and says it's 1.8%. They're both right - they're just using different denominators.
The email conversion rate formula is dead simple. The hard part is choosing the right version.
The Core Formula
Email Conversion Rate = (Conversions / Delivered Emails) x 100
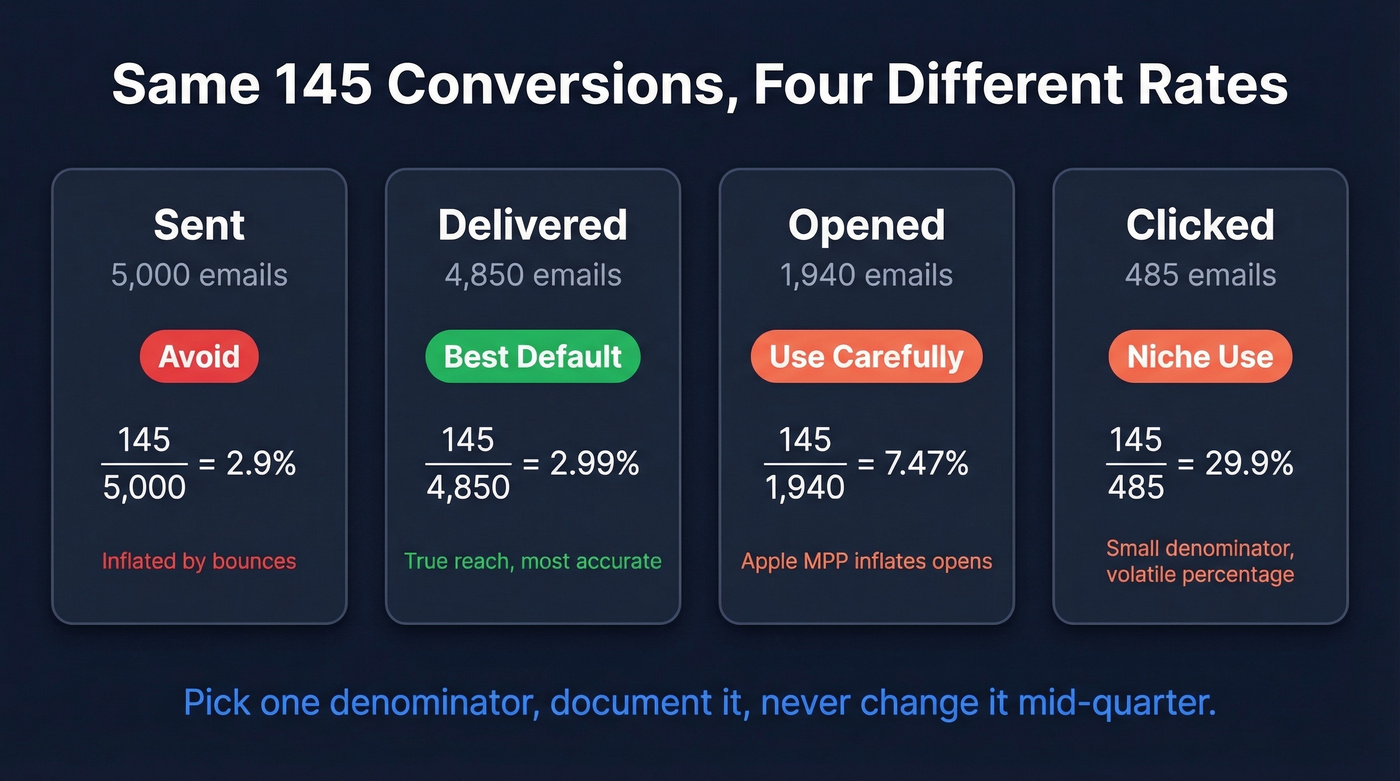
Say you send 5,000 emails. 150 bounce, leaving 4,850 delivered. 145 recipients make a purchase:
(145 / 4,850) x 100 = 2.99%
Use delivered, not sent. Bounced emails never reached anyone, so including them deflates your rate and hides real performance. This is the single biggest reason two people look at the same campaign and report different numbers - one used "sent" as the denominator, the other used "delivered." Pick delivered. Always.
Which Denominator Should You Use?
A thread on r/DigitalMarketing captures the confusion well: one team member counts conversions from opens, another only counts post-click conversions within a 7-day window. Both are defensible. They just measure fundamentally different things.
| Denominator | What It Measures | When to Use It | The Pitfall |
|---|---|---|---|
| Sent | Raw campaign reach | Almost never | Inflated by bounces |
| Delivered | True reach | Default choice | Best general-purpose |
| Opened | Engaged audience | Engagement analysis | Apple MPP inflates opens |
| Clicked | High-intent subset | Revenue attribution | Small denominator, volatile % |
Email and ad conversion rates use different denominators by default. Ads divide by clicks; email typically divides by delivered. This makes cross-channel comparisons misleading without normalized definitions. If your CMO compares email's 3% to paid search's 4%, they're comparing apples to spark plugs.
Here's the thing: if you're running deals under $10k, obsessing over denominator precision matters less than just picking one, documenting it, and never changing it mid-quarter. Consistency beats perfection.
Related Formulas Worth Knowing
| Formula | Calculation | When It Matters |
|---|---|---|
| Click-Through Rate (CTR) | (Clicks / Delivered) x 100 | Measuring email engagement |
| Click-to-Open Rate (CTOR) | (Clicks / Opens) x 100 | Content relevance for openers |
| Revenue per Email (RPE) | Revenue / Delivered Emails | Comparing campaign value |
| Email ROI | ((Revenue - Cost) / Cost) x 100 | Justifying budget to leadership |
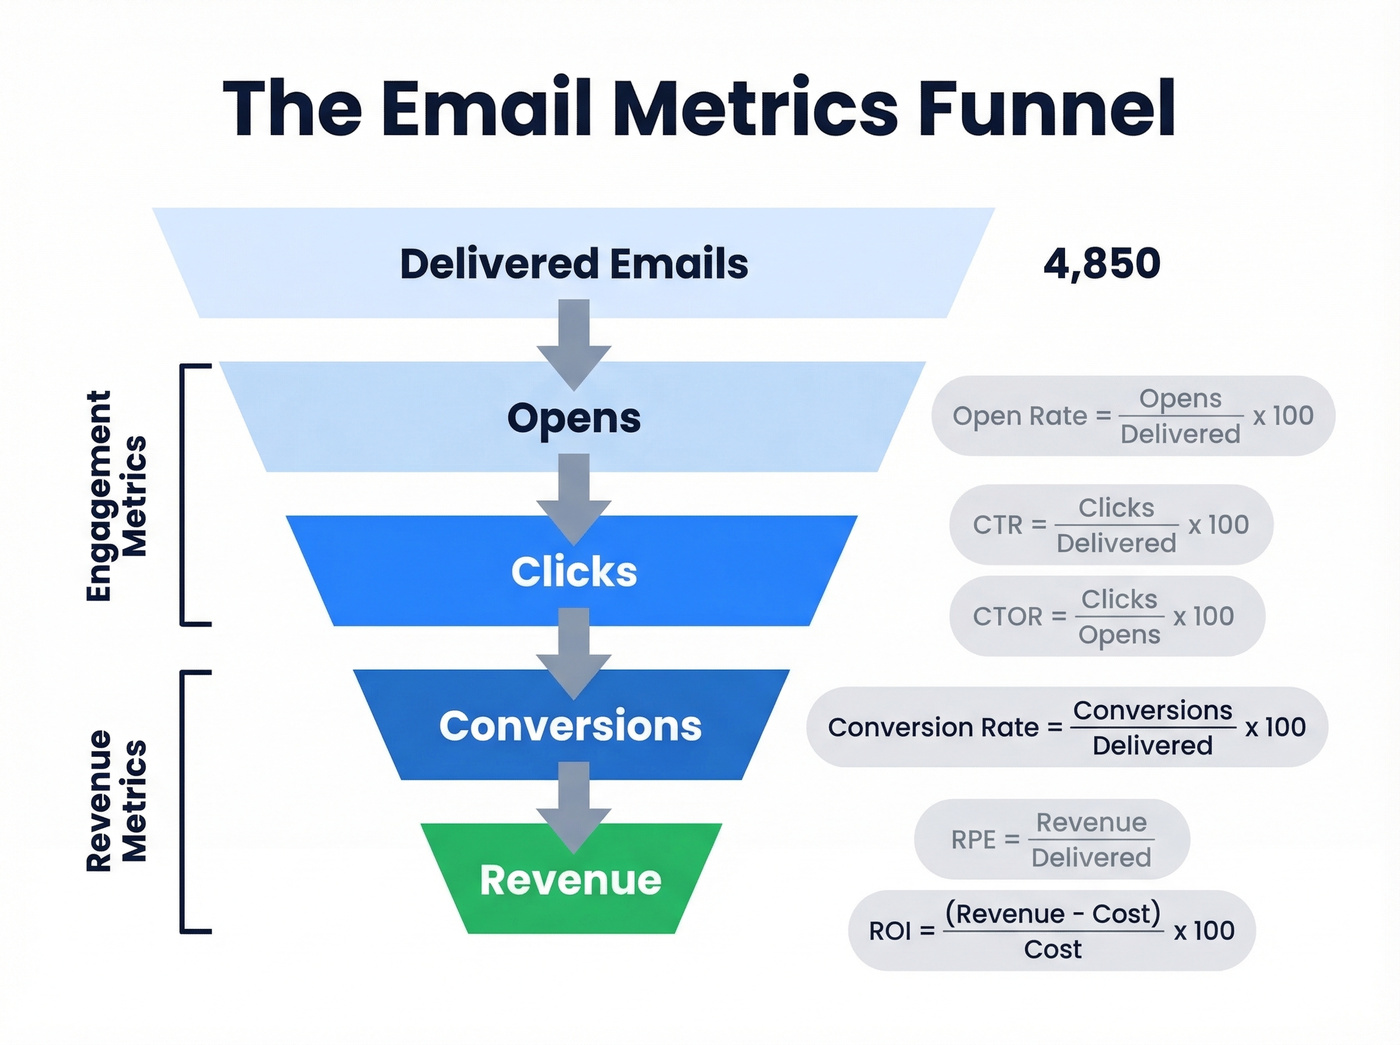
CTR tells you if people are clicking. CTOR tells you if content resonated with those who actually opened. RPE and ROI connect email to revenue - which is what your CFO cares about, not your open rate.
Your email conversion rate is only as reliable as your denominator. If bounced emails are inflating your "delivered" count, every metric downstream is wrong. Prospeo's 5-step verification with 98% accuracy and 7-day refresh cycles keeps your list clean - so your conversion rate formula actually reflects reality.
Fix the denominator before you optimize the numerator.
Benchmarks by Email Type
Automated flows crush one-off campaigns. Welcome emails are usually among the top performers, and it's not close.
| Email Type | Conversion Rate Range | Notes |
|---|---|---|
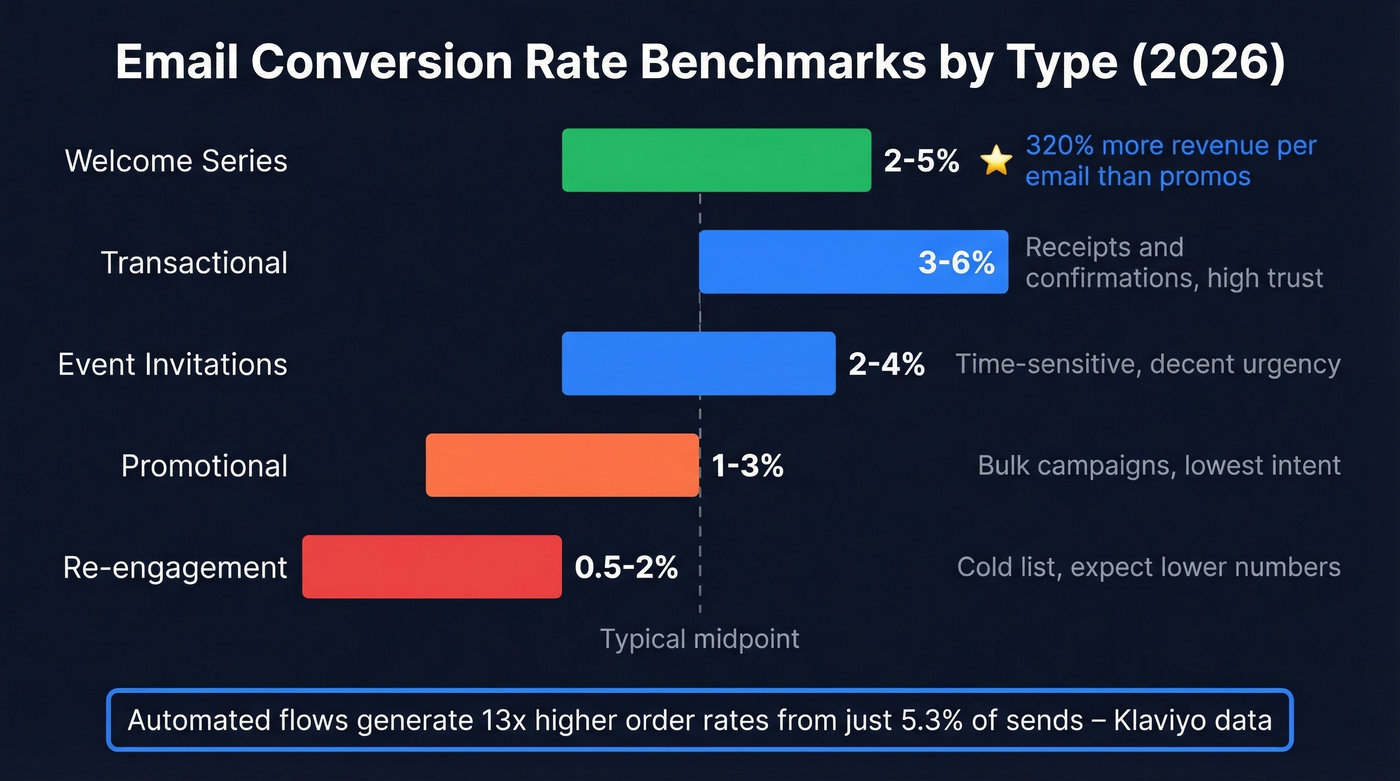
| Promotional | 1-3% | Bulk campaigns, lowest intent |
| Transactional | 3-6% | Receipts, confirmations - high trust |
| Welcome Series | 2-5% | Strong early-lifecycle performance |
| Re-engagement | 0.5-2% | Cold list, expect lower numbers |
| Event Invitations | 2-4% | Time-sensitive, decent urgency |
Welcome emails generate roughly 320% more revenue per email than promotional campaigns. Yet only 57.7% of brands actually send them. If you're not running an automated welcome sequence, you're leaving the easiest money on the table.
Klaviyo's benchmarks across 183,000+ customers tell a striking story: flows generate nearly 41% of total email revenue from just 5.3% of sends, with 13x higher placed order rates than campaigns. Automation isn't optional anymore - it's where the money lives. ActiveCampaign's 2026 dataset corroborates the engagement side, reporting a 39.26% average open rate and 6.21% click rate across industries.
E-commerce open rates average around 32.67%, while non-profits hit roughly 52.38%, according to MailerLite's analysis of 3.6M campaigns. That same analysis flags a critical measurement issue: Apple Mail Privacy Protection auto-loads tracking pixels, so "opens" don't mean what they used to. Lean on click-based and conversion-based metrics instead.
How to Track Email Conversions
The formula is useless if you can't capture conversions accurately. Here's what we've found matters most:
UTM parameters on every link. Use utm_medium=email, always lowercase. Format campaigns as YYYY-MM_promo-name. Use utm_content to differentiate CTAs within the same email.
QA in GA4 Realtime. Send yourself a test, click the link, confirm UTMs appear before you hit send to 50,000 people. We've caught broken UTMs this way more times than we'd like to admit.
Conversion tracking on your thank-you page. Use a tag or pixel to fire the conversion event you've marked in GA4. Without this, you're guessing.
CRM integration for closed-loop attribution. Connect your ESP to your CRM so you can trace email to click to opportunity to closed deal. This is where email ROI stops being theoretical. If you need a system for connecting tools cleanly, see how to connect your outreach tool to your CRM.
URL-encode all values, and don't put PII in UTMs - it's a privacy violation and a GDPR headache.
Before any of this tracking matters, though, your list needs to be deliverable. Prospeo catches invalid addresses, spam traps, and catch-all domains before they tank your sender reputation, which directly impacts whether emails reach the inbox at all.
Fixing a Low Conversion Rate
Email generates $36-$45 per $1 spent (retail at $45, software at $36), and 18% of companies achieve ROI greater than 70:1. But those numbers only happen if you're fixing the right problems.
Let's break down the most common culprits.
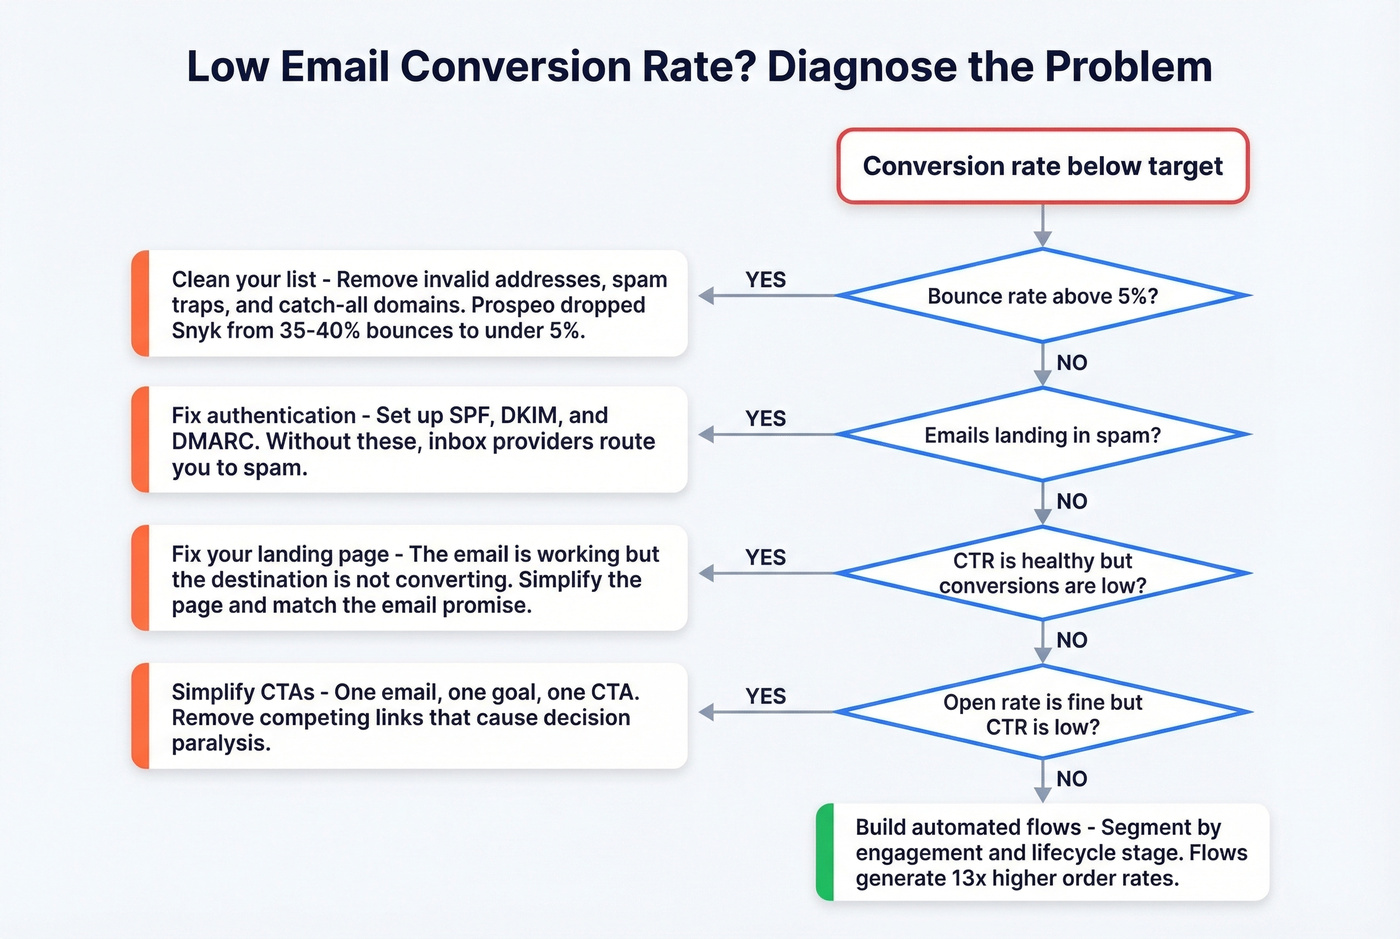
High bounce rate - clean your list. If 10-15% of your sends bounce, your "delivered" denominator shrinks and your metrics are built on bad math. Prospeo's 5-step verification process runs on a 7-day refresh cycle with 98% accuracy, catching catch-all domains, spam traps, and honeypots before they damage your sender reputation. One of our customers, Snyk, dropped their bounce rate from 35-40% to under 5% after switching - and AE-sourced pipeline jumped 180%. If you want to benchmark and diagnose this properly, start with bounce rate.

Poor deliverability - fix your authentication. SPF, DKIM, and DMARC aren't optional anymore. Without them, inbox providers route you to spam. Emails in spam don't convert. Period. For a deeper checklist, use this email deliverability guide and make sure your DMARC alignment is correct.
Competing CTAs - simplify. One email, one goal, one CTA. We've seen teams double conversion rates just by removing the secondary link. It sounds too simple to work, but cluttered emails give readers decision paralysis. If you want examples that consistently drive clicks, pull from these email subject line examples and tighten your email call to action.
No segmentation - stop blasting your full list. Segment by engagement, purchase history, or lifecycle stage. Even basic segmentation lifts conversion rates meaningfully. If you're sending the same email to a day-one subscriber and a two-year customer, you're doing it wrong. A practical framework: intent based segmentation.
No automation - build flows. Klaviyo's data shows flows generate 13x higher placed order rates from 5.3% of sends. Skip this if you enjoy doing more work for worse results.
Snyk dropped bounce rates from 35-40% to under 5% and saw AE-sourced pipeline jump 180%. Stack Optimize holds 94%+ deliverability across every client. When your list is clean, your conversion rate formula stops hiding performance - it starts revealing it.
Stop calculating conversion rates on dirty data.
FAQ
What's a good email conversion rate?
Most email campaigns convert between 1-5%. Welcome emails and automated flows hit the higher end (2-5%), while promotional blasts sit closer to 1-3%. Compare against your own historical data first - industry averages are directional, but your baseline matters more.
Should I use sent or delivered in the formula?
Delivered. Bounced emails never reached anyone, so including them deflates your rate artificially. The calculation is (Conversions / Delivered Emails) x 100 - this gives you the most accurate picture of real campaign performance.
What's the difference between CTR and conversion rate?
Click-through rate measures how many recipients clicked a link - it's an engagement metric. Conversion rate measures how many completed a desired action like a purchase, signup, or demo request. CTR diagnoses email content; conversion rate diagnoses the full funnel from inbox to landing page.
How do you track email conversions in GA4?
Tag every email link with UTM parameters (utm_medium=email), set up a conversion event on your thank-you or confirmation page, and verify tracking in GA4's Realtime report before launching. For full-funnel visibility, connect your ESP to your CRM.
How does list quality affect conversion rates?
Dirty lists with invalid addresses inflate bounce rates, shrink your delivered count, and damage sender reputation - pushing future emails to spam. Cleaning your list with a verification tool removes invalid emails, spam traps, and honeypots so more messages reach real inboxes and your conversion metrics reflect actual performance.