Your Newsletter CTR Is Probably Wrong - Here's What the Real Numbers Look Like
A newsletter operator with 60,000 subscribers posted their numbers on r/Emailmarketing recently: 28% open rate, 3.9% CTR, 13-14% CTOR. They wanted to know if that was good. The replies were all over the place - because every benchmark source gives you a different number for email newsletter click-through rates, and most of them aren't even measuring the same thing.
The Short Version
A "normal" newsletter CTR is 2-4%. If you're in that range, you're not failing. Your CTR number is probably inflated by bot clicks - 5-15% of total clicks are fake. And honestly? Stop benchmarking against ESP averages. Track your own 90-day trend instead.
What Newsletter CTR Actually Means
CTR = clicks / emails delivered x 100. If you sent 10,000 emails, 9,800 were delivered, and 196 people clicked, your CTR is 2%.
CTOR (click-to-open rate) uses a different denominator: unique clicks / unique opens. The problem is Apple Mail Privacy Protection has been inflating open counts since 2021, which means CTOR's denominator is broken for a large chunk of your list. CTR's denominator - delivered emails - stays reliable.
2026 Newsletter CTR Benchmarks by Industry
Here's what the data actually looks like, pulled from MailerLite's benchmark study covering 3.6 million campaigns across 181,000 accounts, supplemented with Designmodo's 2026 benchmarks for additional verticals.
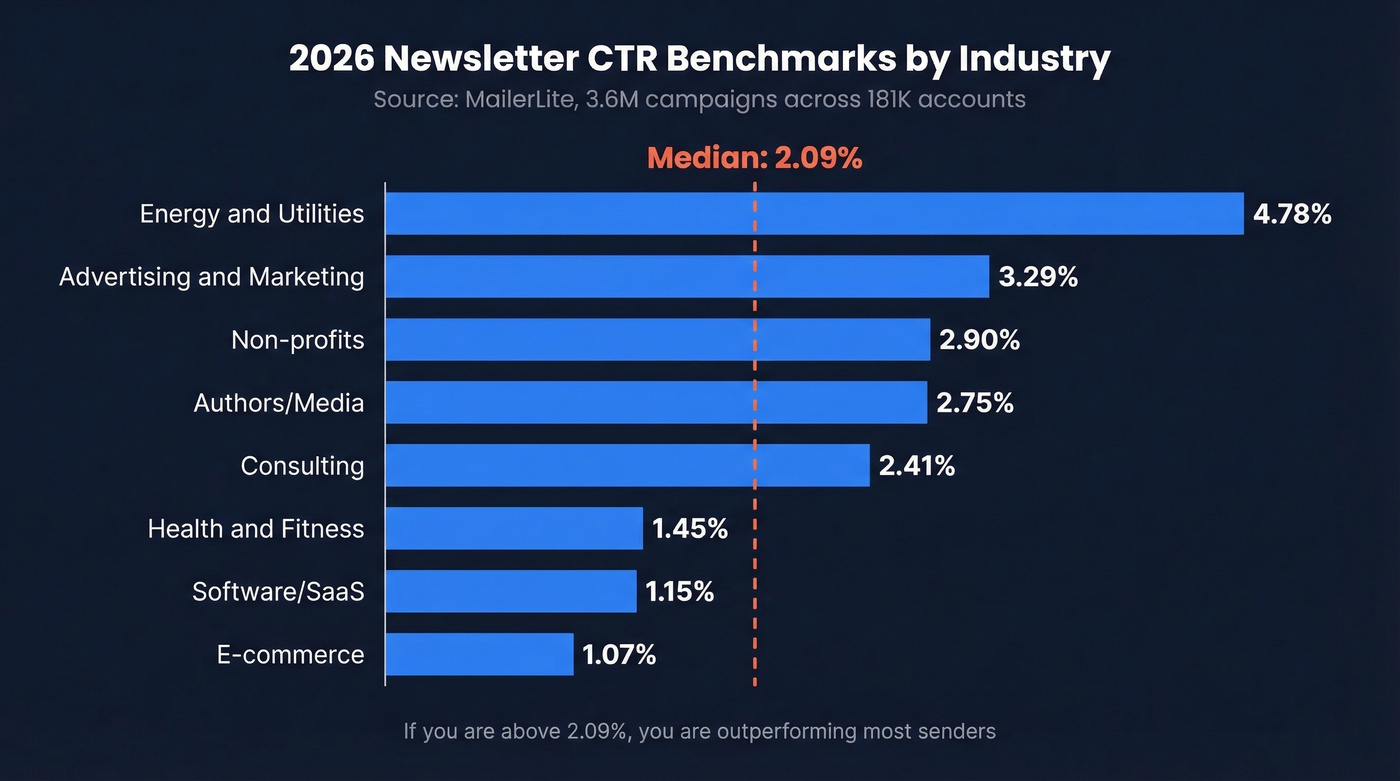
| Industry | CTR | CTOR | Notes |
|---|---|---|---|
| E-commerce | 1.07% | - | Don't panic - this is normal |
| Software/SaaS | 1.15% | - | Highly competitive inboxes |
| Health & Fitness | 1.45% | - | - |
| Consulting | 2.41% | - | - |
| Authors/Media | 2.75% | - | - |
| Non-profits | 2.90% | - | Cause-driven = higher engagement |
| Advertising & Marketing | 3.29% | 12.82% | - |
| Energy & Utilities | 4.78% | 12.85% | - |
The overall median across all industries sits at 2.09%, with an aggregate CTOR of 6.81%. CTR barely moved year-over-year (2.09% vs. 2.0% in 2024), but unsubscribe rates nearly tripled - from 0.08% to 0.22% - largely because Gmail now makes unsubscribing easier with a one-click option next to mass emails.
We've seen newsletter operators panic over a 1.2% CTR in e-commerce. That's actually normal for the vertical. If you're above the 2.09% median, you're outperforming most senders.
You just saw that e-commerce CTR benchmarks sit at 1.07% and the median across all industries is 2.09%. Every percentage point matters - and bad data is the silent killer. Prospeo's 5-step email verification catches invalid addresses, spam traps, and honeypots at 98% accuracy, so your emails actually reach real inboxes instead of dragging down your sender reputation.
Stop benchmarking against averages. Start sending to verified addresses.
Why Benchmarks Disagree So Wildly
That 2.09% median? ActiveCampaign reports 6.21% for the same year. Creator-focused newsletters run even higher - beehiiv cites a 6.17% CTR benchmark for media/creator newsletters. Same timeframe, wildly different numbers.
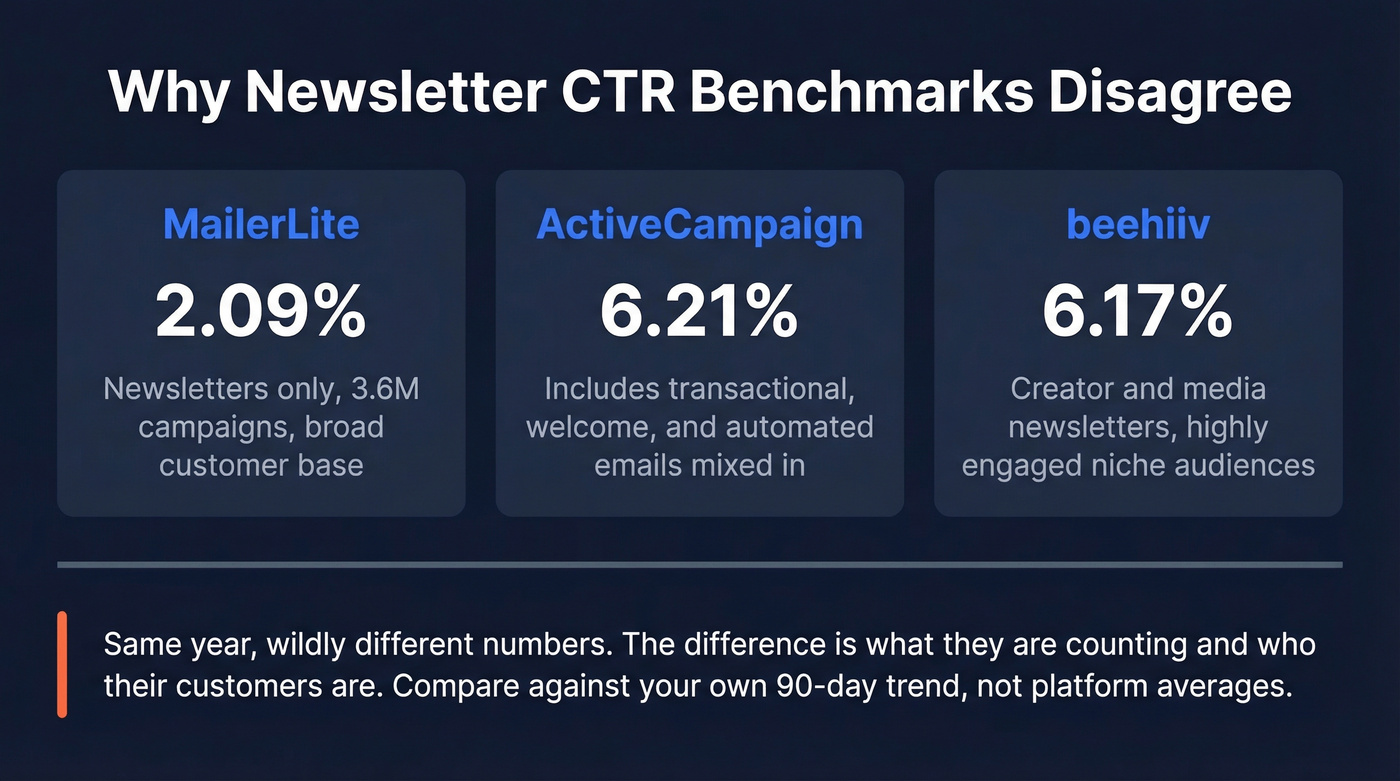
The explanation is straightforward. ActiveCampaign's benchmark explicitly includes transactional, marketing, and other campaign types - not just newsletters. A welcome email with a single "confirm your account" button will always crush a weekly roundup in CTR. So when someone asks about the average click rate for newsletters specifically, the answer depends entirely on what's being counted.
Let's be honest: ESP benchmarks are marketing, not science. Customer mix and campaign mix drive the number. Compare against your own historical data, not someone else's platform average.
Your CTR Is Probably Inflated
Apple MPP Inflates Opens (and Breaks CTOR)
Since 2021, Apple Mail has preloaded tracking pixels via proxy servers. An "open" gets registered whether or not anyone actually reads the email. If a meaningful portion of your list uses Apple Mail, your open rates are inflated and CTOR's denominator is unreliable.
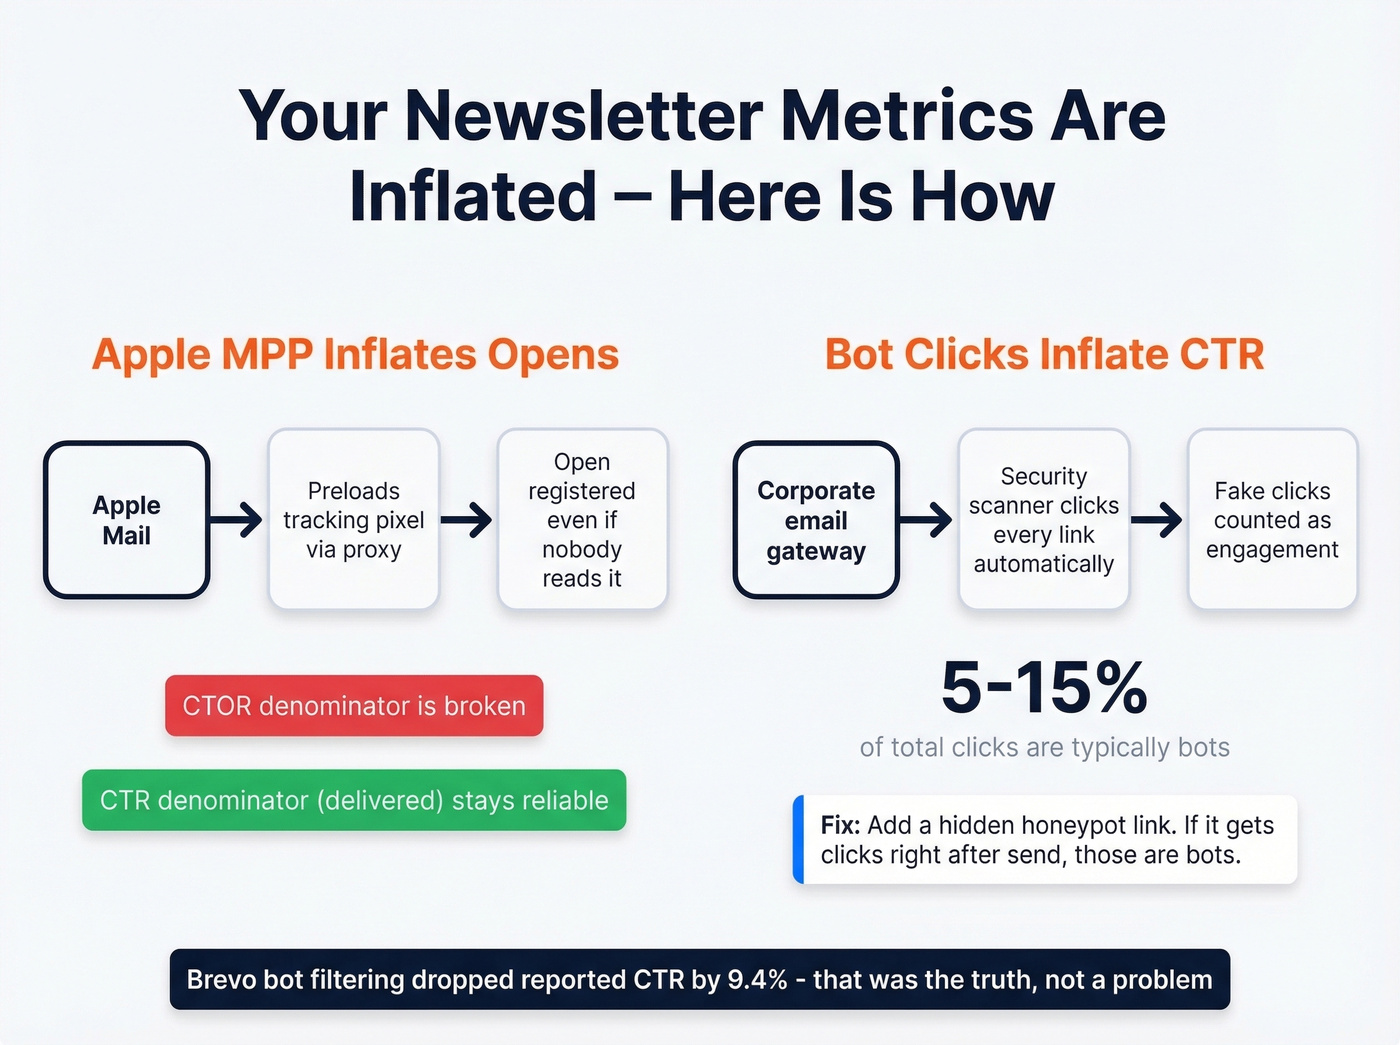
Clicks remain trustworthy because they require an intentional human action.
Bot Clicks Are a Bigger Problem Than You Think
Security scanners at corporate email gateways click every link in an email automatically. These aren't real engagement - they're phishing checks. One EmailToolTester analysis found that enabling Brevo's bot filtering caused CTR to drop by 9.4%. That's not a rounding error.
In practice, bot clicks commonly run 5-15% of total clicks, and they skew higher on enterprise-heavy lists. The detection tactic: add a hidden "honeypot" link that no human would click. If it registers clicks immediately after send, you've got bots. Check whether your ESP offers bot filtering - Brevo, ActiveCampaign (Pro/Enterprise), and Klaviyo all have options. If yours doesn't, that honeypot link is your best diagnostic tool.
How to Actually Improve Newsletter CTR
Redesign Your Email Layout
Campaign Monitor ran an A/B test on their blog notification email and saw a 127% increase in click-throughs. The biggest drivers: replacing a small text link with a high-contrast CTA button, leading with the content title instead of a logo, and using specific microcopy that beat generic copy by about 10%. Most newsletters haven't been redesigned in years. It's the lowest-effort, highest-impact lever you've got.
If you want to go deeper on what actually gets clicks, start with email subject lines and your email call to action.
Send More, Expect Less (Per Email)
Here's the hot take most newsletter advice gets wrong: higher send frequency lowers per-email CTR but can increase total monthly clicks. GetResponse modeled this with a 100,000-subscriber list - four sends per month at 4.88% CTR produced 19,520 visits, while eight sends per month at 3.53% CTR produced 28,240 visits. That's 44% more traffic despite a lower per-send rate.
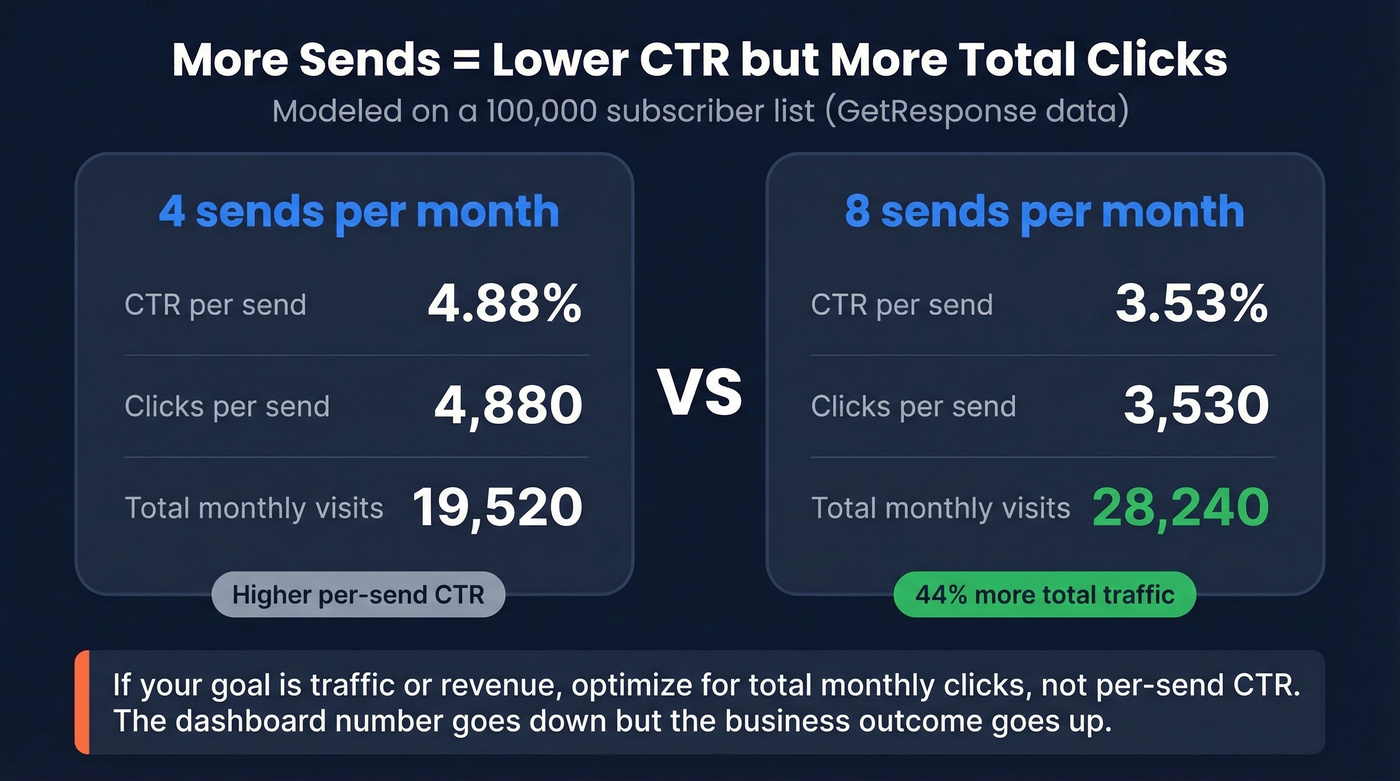
If your goal is traffic or revenue, optimize for total monthly clicks, not per-send CTR. The dashboard number goes down, but the business outcome goes up.
Clean Your List First
Email lists churn 20-40% per year. Invalid addresses don't just bounce - they damage your sender reputation, which tanks inbox placement, which tanks CTR. And here's the cost angle most people miss: dead subscribers inflate your ESP bill. If 15% of your list is invalid, you're paying for a higher subscriber tier to email addresses that will never click anything.
I've seen operators shave $50-100/month off their ESP costs just by removing dead weight, and their click-through rates went up because deliverability improved across the board. Tools like Prospeo's email verification catch invalid addresses, spam traps, and honeypots at 98% accuracy, with a free tier of 75 verifications per month - enough to audit a segment and see how much dead weight you're carrying before committing to a full list clean.
If you're troubleshooting bounces as part of that cleanup, use an email bounce rate checklist to spot patterns fast.

Lists churn 20-40% per year, and every dead address costs you twice - once on your ESP bill, again on your deliverability score. Prospeo catches invalid emails, spam traps, and honeypots with 98% accuracy on a 7-day refresh cycle. That means cleaner sends, better inbox placement, and a CTR that reflects actual engagement.
Bad deliverability kills CTR before your subject line even matters.
FAQ
What's a good email newsletter click-through rate?
2-4% is normal for most industries. Anything above 4% is strong performance. Don't compare against ESP averages that bundle in transactional and automated emails - those inflate the number significantly.
What's the average newsletter click rate across industries?
Based on MailerLite's study of 3.6 million campaigns, the cross-industry average sits at 2.09%. Industry variation is massive - e-commerce averages just 1.07%, while energy and utilities hit 4.78%. Your vertical matters more than any single aggregate number.
Is CTR or CTOR a better metric for newsletters?
CTR is more reliable in 2026. Apple Mail Privacy Protection inflates open rates, which breaks CTOR's denominator. CTR uses delivered emails - a count that stays accurate regardless of privacy settings or mail client.
How do I filter bot clicks from my newsletter reports?
Add a hidden honeypot link no human would click. If it registers clicks immediately after send, those are bots. Enable your ESP's bot filtering and expect your reported CTR to drop 5-15%. That drop is the truth - your real engagement was always lower than the dashboard said.
Can list cleaning actually improve my CTR?
Yes. Removing invalid addresses reduces bounces, which protects sender reputation and improves inbox placement. Better deliverability means more real humans see your email, which directly lifts click-through rates. We've seen teams improve CTR by 15-25% just by cleaning their lists before a major send.