Email Open Rate Calculator: Find Your Real Number (Not the Inflated One)
Most ESPs report open rates without flagging that 40-60% of those "opens" are machines. Your 42% open rate probably isn't 42%. This calculator helps you find what it actually is - and what to do about it.
Email Open Rate Calculator
Enter your campaign numbers below. Unlike most tools, this one asks for bounces separately - because using "emails sent" as your denominator gives you a wrong number.
Inputs:
- Emails Sent
- Emails Bounced
- Emails Opened (unique)
Outputs:
- Emails Delivered (auto-calculated: Sent - Bounced)
- Open Rate %
- Rating: Below Average (<20%) / Average (20-35%) / Strong (35-50%) / Exceptional (50%+)
If your audience skews toward Apple Mail users, your real human open rate is 10-30% lower than the number above.
Quick Takeaways
- Your formula: (Unique Opens / Emails Delivered) x 100 - use delivered, not sent.
- Your number is inflated 10-30% by Apple Mail Privacy Protection.
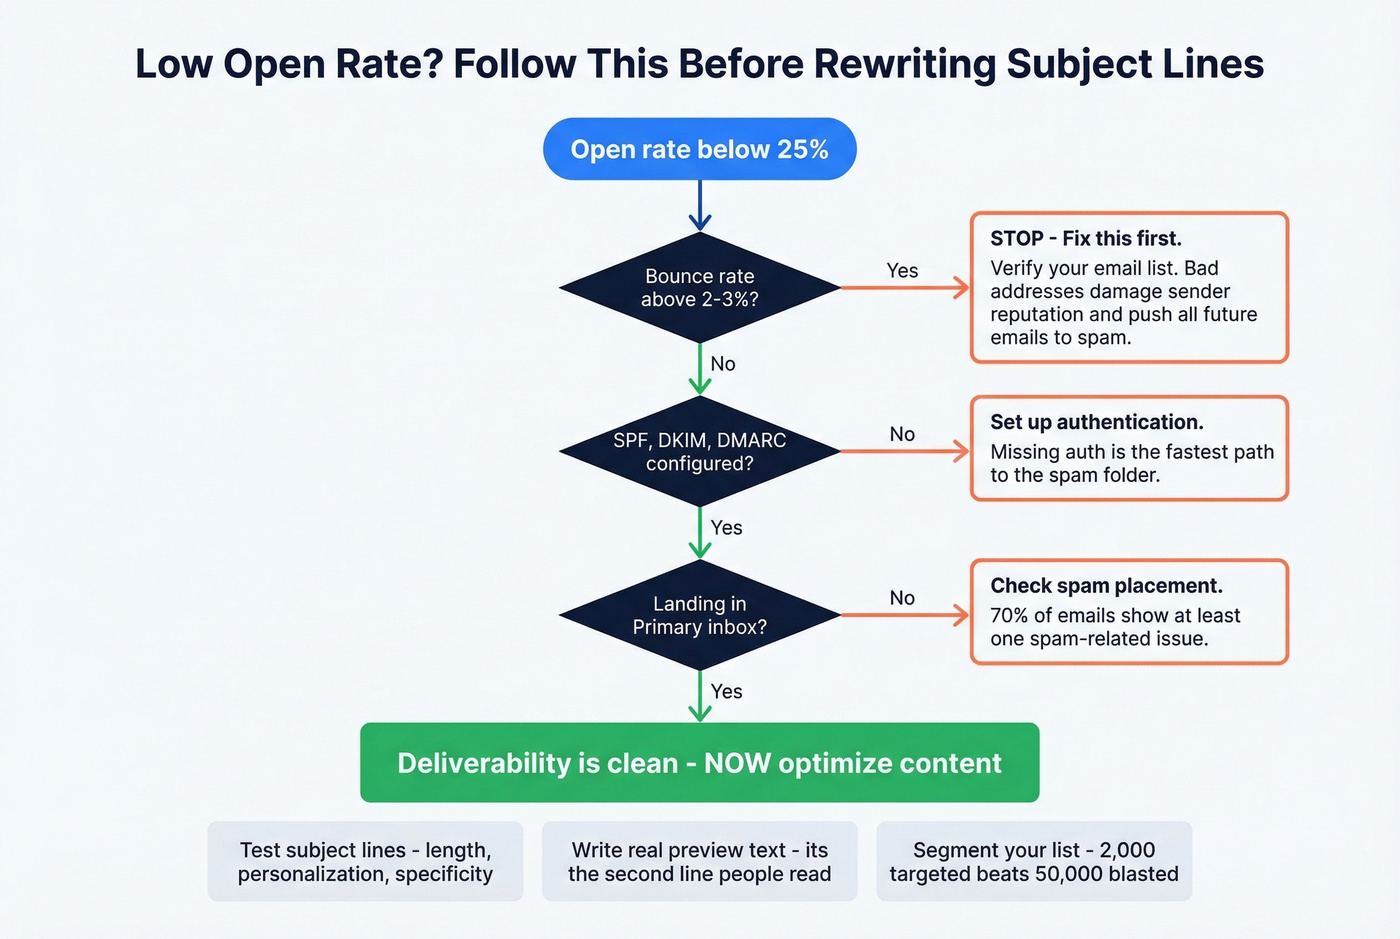
- If your open rate is below 25%, check deliverability and list quality before rewriting subject lines.
The Formula (and Why Most Get It Wrong)
Open Rate = (Unique Opens / Emails Delivered) x 100
Emails Delivered = Emails Sent - Emails Bounced
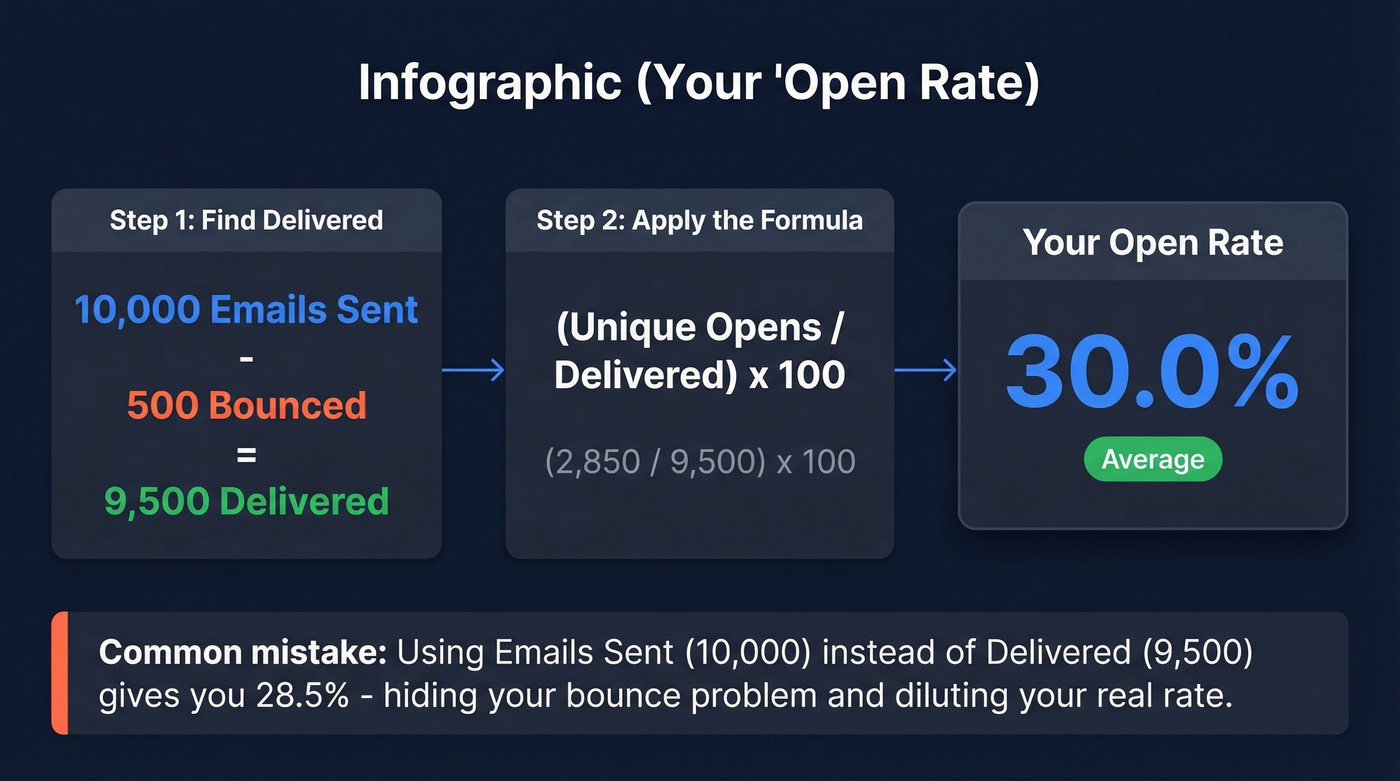
Worked example: you send 10,000 emails. 500 bounce. 2,850 unique opens. Delivered = 9,500. Open rate = 2,850 / 9,500 = 30.0%.
Here's the thing: at least three popular calculators use "sent" in their formula but "delivered" in their explanation - contradicting themselves. The difference matters. Using "sent" dilutes your rate and hides a bounce problem. Using "delivered" gives you a cleaner signal of how many people who could have seen your email actually opened it. Campaign Monitor's guide gets this right.
That single distinction - delivered vs. sent in the denominator - separates accurate measurement from misleading vanity metrics.
Why Your Open Rate Is Wrong
Apple Mail Privacy Protection launched with iOS 15 in September 2021. It's been quietly wrecking open-rate data ever since.
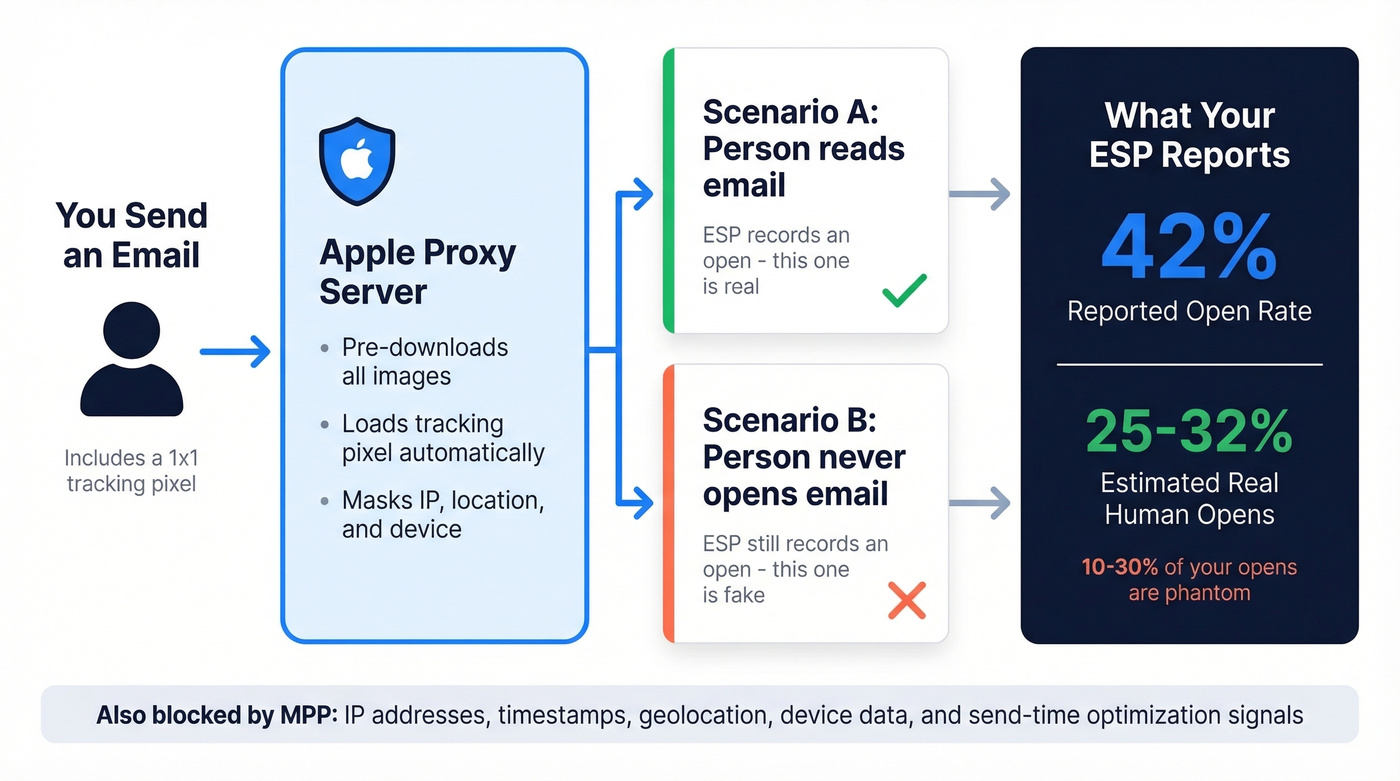
When a user enables "Protect Mail activity," Apple's proxy servers preload all images and tracking pixels in incoming emails - whether or not the person ever reads the message. Your ESP sees an "open." A human never looked at it.
MPP doesn't just inflate open counts. It blocks IP addresses, timestamps, geolocation, and device data. You can't tell when someone opened, where they are, or what device they're using. This applies to the Apple Mail app regardless of email address - a Gmail address viewed in Apple Mail is still affected. Roughly 40-60% of opens can be distorted depending on your audience's Apple Mail share.
Apple's 2026 Mail changes keep adding noise: AI-generated previews, digest-style views, branded sender icons, and inbox categories. Link Tracking Protection can also strip tracking parameters, including UTMs, in Mail and Safari. Your open rate is noisy, your attribution is broken, and your send-time optimization is guessing.
We've watched teams celebrate "record open rates" that were entirely phantom opens. In our experience, real human open rates run 10-30% lower than what your ESP reports. Plan accordingly.
You just saw that bounce rates above 2-3% destroy open rates faster than any bad subject line. Prospeo's 5-step email verification catches invalid addresses, spam traps, and honeypots - including catch-all domains most tools skip. 98% accuracy. $0.01 per email. 75 free verifications to start.
Fix your bounce rate before you rewrite another subject line.
2026 Industry Benchmarks
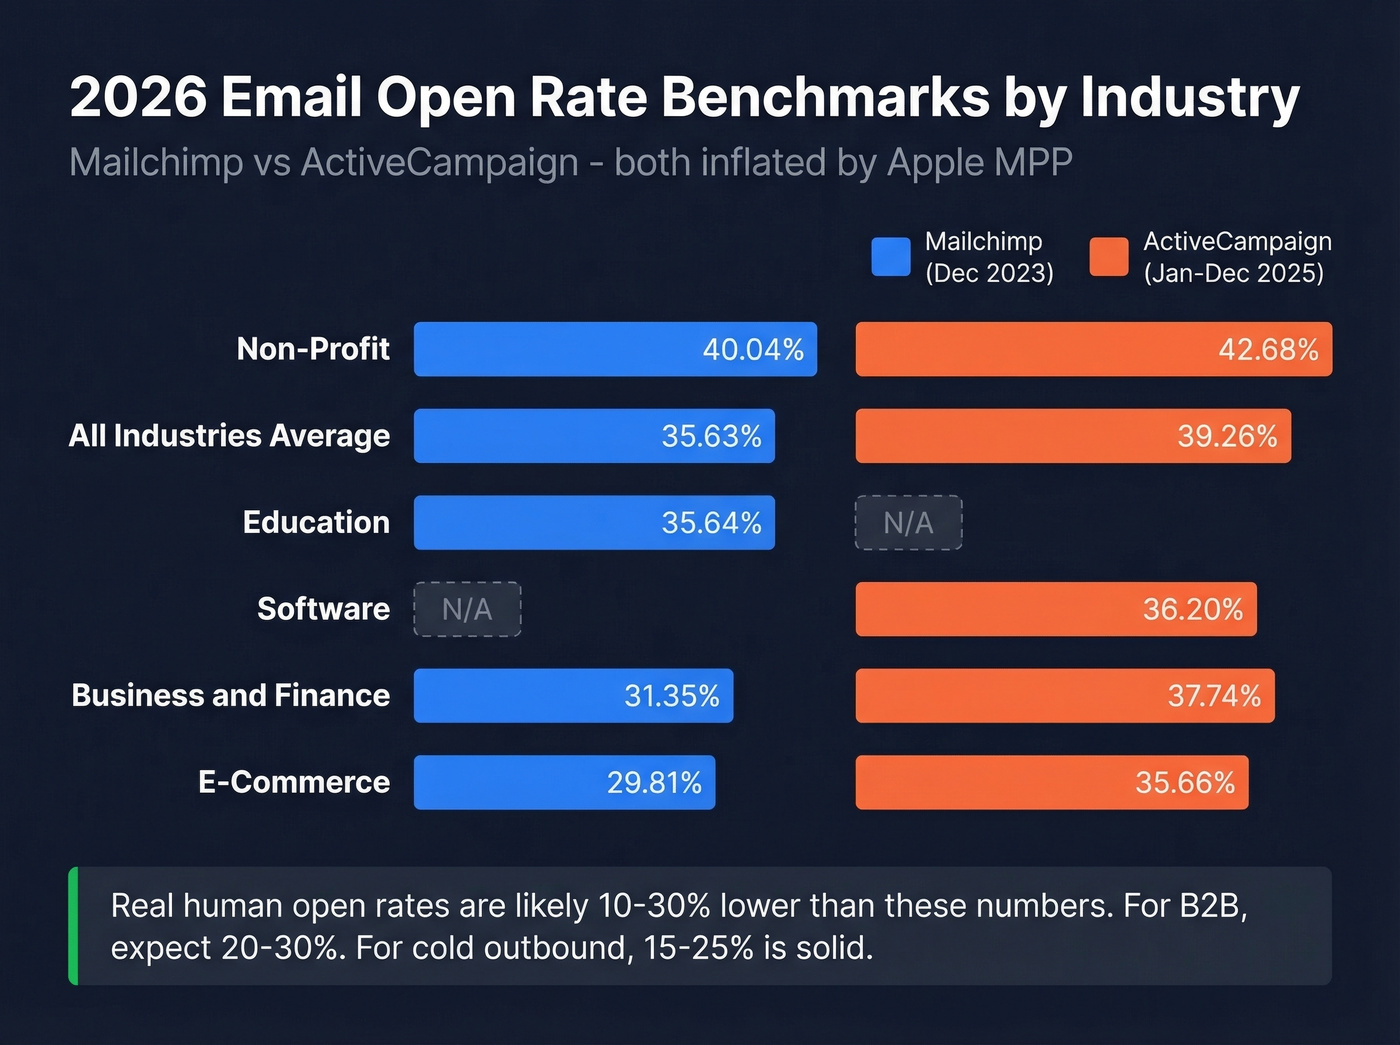
Benchmark articles all cite different numbers because they pull from different platforms with different user bases and MPP exposure levels. Here are two credible sources side by side.
| Industry | Mailchimp (Dec 2023) | ActiveCampaign (Jan-Dec 2025) |
|---|---|---|
| All Users | 35.63% | 39.26% |
| Non-Profit | 40.04% | 42.68% |
| E-Commerce | 29.81% | 35.66% |
| Education | 35.64% | - |
| Software | - | 36.20% |
| Business/Finance | 31.35% | 37.74% |
| Restaurants/Food | 32.04% | - |
| Real Estate | 28.57% | - |
Mailchimp's benchmarks draw from billions of emails across campaigns with 1,000+ subscribers. ActiveCampaign's data covers campaigns from January through December 2025. Both note that MPP inflates these numbers.
The 3-4 point gap between platforms isn't surprising - ActiveCampaign's user base skews toward engaged, smaller-list senders, while Mailchimp includes a much wider range of sender quality. When you compare your results against these benchmarks, keep that platform bias in mind.
For B2B, expect reported open rates of 30-40%, with real human opens closer to 20-30%. Running cold outbound? 15-25% is solid once you strip out machine opens.
Hot take: Open rate is the most over-discussed metric in email marketing. If your average deal size is under $10k and you're spending more than 30 minutes per week analyzing opens, you're optimizing the wrong thing. Skip to reply rate and conversion.
Unique Opens vs. Total Opens
One person opening your email five times counts as one unique open and five total opens. Always use unique opens in your calculation. Total opens inflate your rate and tell you nothing useful.
The distinction matters even more for click-to-open rate (CTOR), which measures how well your email content converts openers into clickers: CTOR = unique clicks / unique opens. If you're using total opens in that denominator, your CTOR looks artificially low and you'll misdiagnose content problems that don't exist.
Low Open Rate? Diagnose First
We've seen teams waste weeks rewriting subject lines when the real problem was a 15% bounce rate. Don't start with content fixes. Start with infrastructure.
Deliverability Problems
Work through this checklist first - it catches the root cause most of the time:
- Authentication: Are SPF, DKIM, and DMARC properly configured? Missing authentication is the fastest way to land in spam. (If you need a quick reference, start with SPF and DMARC.)
- Bounce rate: If it exceeds 2-3%, this is your problem. Bad addresses compound - every bad send damages sender reputation and pushes future emails toward spam. (More on email bounce rate benchmarks and fixes.)
- Inbox placement: Are you landing in Primary, Promotions, or Spam? Litmus found that 70% of emails show at least one spam-related issue.
Before optimizing subject lines, verify your list. Prospeo's 5-step email verification catches invalid addresses, spam traps, and honeypots with 98% accuracy - including catch-all domains most tools miss. The free tier gives you 75 verifications per month to test it.
Content Problems
Only move here after deliverability checks out clean:
- Subject lines: Test length, personalization, and specificity. Generic subject lines get generic results. (Use these email subject line examples if you need fresh angles.)
- Preview text: Most senders ignore this. It's the second line your recipient reads - use it. (See preview text A/B testing.)
- Send time and segmentation: A 50,000-person blast will always underperform a 2,000-person segment with a relevant message. The consensus on r/emailmarketing backs this up - segmentation beats subject line tricks every time.
Phantom opens from Apple MPP mean the only metric you can trust is replies - and replies require real inboxes. Prospeo verifies 143M+ emails on a 7-day refresh cycle, so you're never sending to stale data that inflates bounces and tanks sender reputation.
Stop celebrating machine opens. Start reaching real buyers.
Beyond Open Rate: Metrics That Actually Drive Decisions
Opens are a deliverability pulse check. Clicks and replies are engagement. Conversion is revenue. Open rate is a distant fourth in the metrics that actually matter.
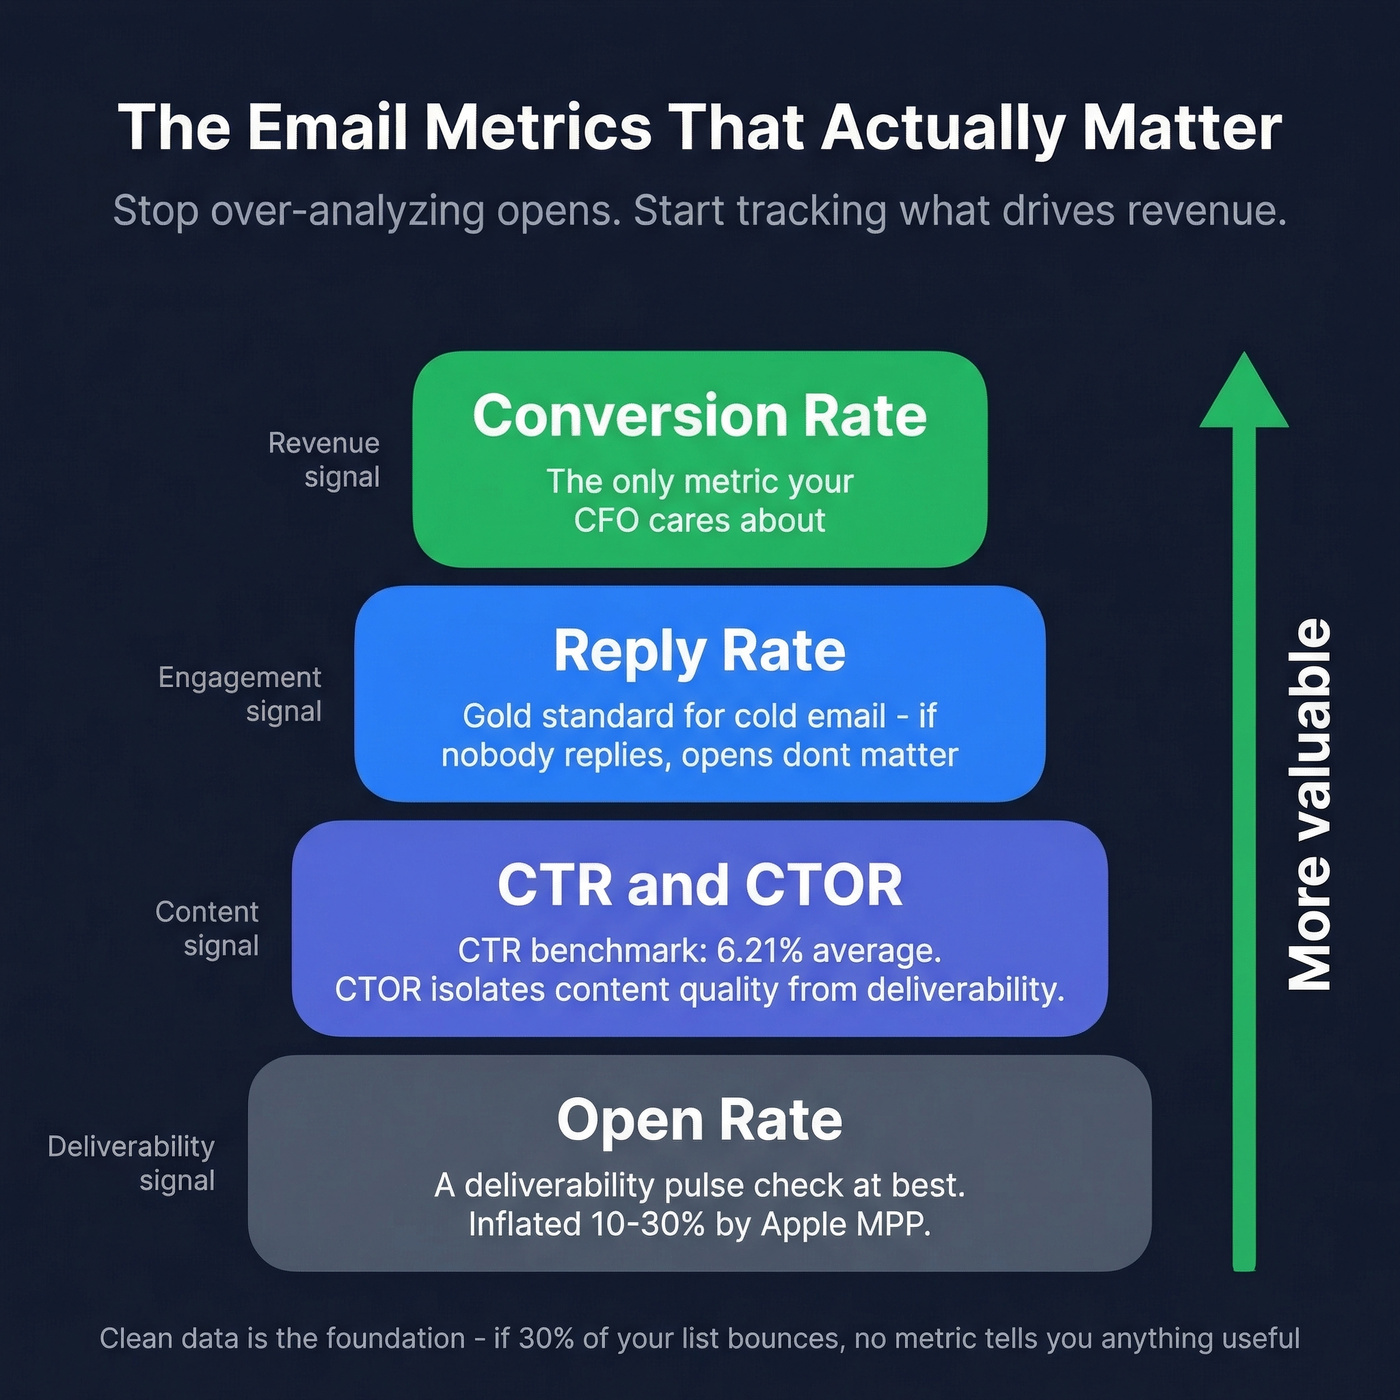
Track these instead:
- CTR = (Total Clicks / Emails Delivered) x 100. ActiveCampaign's 2025 benchmark average: 6.21%. (If you want the math and variations, see the click rate formula.)
- CTOR = (Unique Clicks / Unique Opens) x 100. Isolates content quality from deliverability.
- Reply rate - the gold standard for cold email. If nobody's replying, opens don't matter.
- Conversion rate - the only metric your CFO cares about.
Clean data is the foundation every other metric sits on. If 30% of your list bounces, no metric tells you anything useful - keeping that number under 2-3% through verification is table stakes.
FAQ
What's a good email open rate in 2026?
Industry averages range from 35-39% across major platforms, but both figures include MPP-inflated opens. A realistic human open rate is 20-30% for most senders. Cold outbound should target 15-25% after stripping machine opens.
How do you calculate email open rate?
Open Rate = (Unique Opens / Emails Delivered) x 100. Use delivered (sent minus bounced), not total sent, as your denominator. This gives you a cleaner signal of actual recipient engagement.
Why is my open rate suddenly so high?
Apple Mail Privacy Protection preloads tracking pixels through proxy servers, creating phantom opens. If your audience skews toward Apple Mail users, your reported rate is inflated by 10-30%. Check your subscriber device breakdown to estimate the distortion.
How does list quality affect open rates?
Bad email addresses bounce, which damages sender reputation, which pushes future emails to spam. Keeping bounce rates under 2-3% through verification protects inbox placement and makes every metric meaningful.
What's the difference between open rate and click-to-open rate?
Open rate measures how many recipients opened your email. Click-to-open rate (CTOR) = unique clicks / unique opens - it isolates how well your content converts openers into clickers, removing deliverability from the equation.