Excel Pipeline Template: Build & Download (2026)
It's Monday morning. Your VP asks for a pipeline number. You open the spreadsheet, squint at 47 rows of stale data, multiply some deal values by gut-feel probabilities, and report a number you don't believe. Everyone nods. Nobody trusts it.
That's the reality of most Excel pipeline templates - glorified column headers pretending to be forecasting tools. We've spent enough time building and breaking these things to know what separates a useful pipeline tracker from a pretty spreadsheet that lies to you. What follows: downloadable templates that actually work, step-by-step build instructions with real formulas, forecasting models, and the specific mistakes that turn pipelines into fiction.
What You Need (Quick Version)
Pick your path:
- Just want a template now - Grab Microsoft's Detailed Sales Pipeline Management template (it includes premade calculations and a forecast graph).
- Want to build your own in 10 minutes - Jump to How to Build a Pipeline Template.
- Already have a pipeline spreadsheet but it's broken - Jump to Pipeline Health Metrics for the formulas and benchmarks that actually matter.
Best Free Templates for Excel
The biggest complaint on Reddit about pipeline templates? They're impossible to customize. Users download something polished, try to add a stage or tweak a status, and realize they can't figure out how the thing was built.
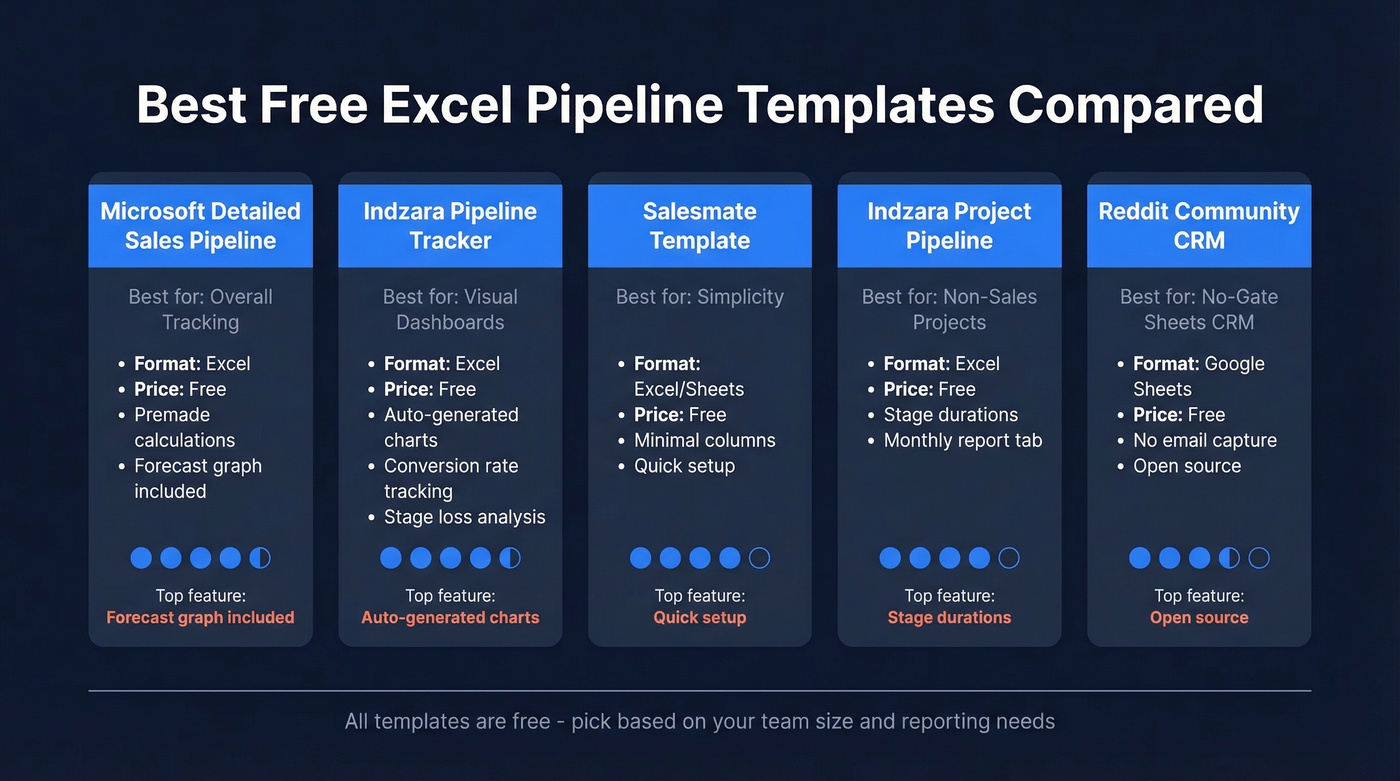
| Template | Best For | Format | Price | Key Feature |
|---|---|---|---|---|
| Microsoft Detailed Sales Pipeline Management | Overall tracking | Excel | Free | Premade calculations + forecast graph |
| Indzara Pipeline Tracker | Visual dashboards | Excel | Free | Conversion rates + auto-charts |
| Salesmate Template | Simplicity | Excel/Sheets | Free | Clean, minimal columns |
| Indzara Project Pipeline | Non-sales projects | Excel | Free | Stage durations + report tab |
| Reddit Community CRM | No-gate Sheets CRM | Google Sheets | Free | No email capture, open source |
Microsoft's Detailed Sales Pipeline Management template is a solid starting point. It ships with premade calculations and a forecast graph that updates as you maintain the sheet. For most teams under 50 deals, this is enough.
Indzara's Sales Pipeline Tracker is the pick if you care about dashboards. It auto-generates charts showing pipeline value by stage, average conversion rate, average time to close, stage loss rates, and total value versus expected value based on win confidence. For a free template, the reporting depth is impressive - we've seen paid tools with worse analytics.
Salesmate's template strips everything to essentials: deal name, stage, value, close date. If your team has three reps and under 30 deals, this is all you need. Search "Salesmate sales pipeline template" to find their download page.
For non-sales use cases, Smartsheet's Project Pipeline Template uses stages like Research, Approval, Develop, Test, Execute, and Launch, with auto-calculated durations plus "Active Pipeline" and "Monthly Report" tabs.
And if you want zero email gates, a community member on r/CRM shared a free Google Sheets CRM template - no paywall, with a blog post explaining usage.
How to Build a Pipeline Template in Excel
Pre-built templates break the moment your process doesn't match their assumptions. One r/excel thread captured this perfectly: a user wanted "Unqualified" available beyond the earliest stage because leads can become unqualified after discovery calls, not just at first contact. The template wouldn't allow it. Building your own takes 10 minutes and gives you full control.
Step 1: Set Up Your Table
Select your data range and hit Ctrl+T (Format as Table). This isn't cosmetic. Excel Tables give you dynamic ranges that auto-expand when you add rows, structured references in formulas, and easier filtering. Every formula you write later depends on this.
Your core columns: Deal Name, Company, Contact, Stage, Value ($), Probability (%), Close Date, Owner, Next Follow-Up, Notes. That's ten columns. Resist the urge to add more on day one.
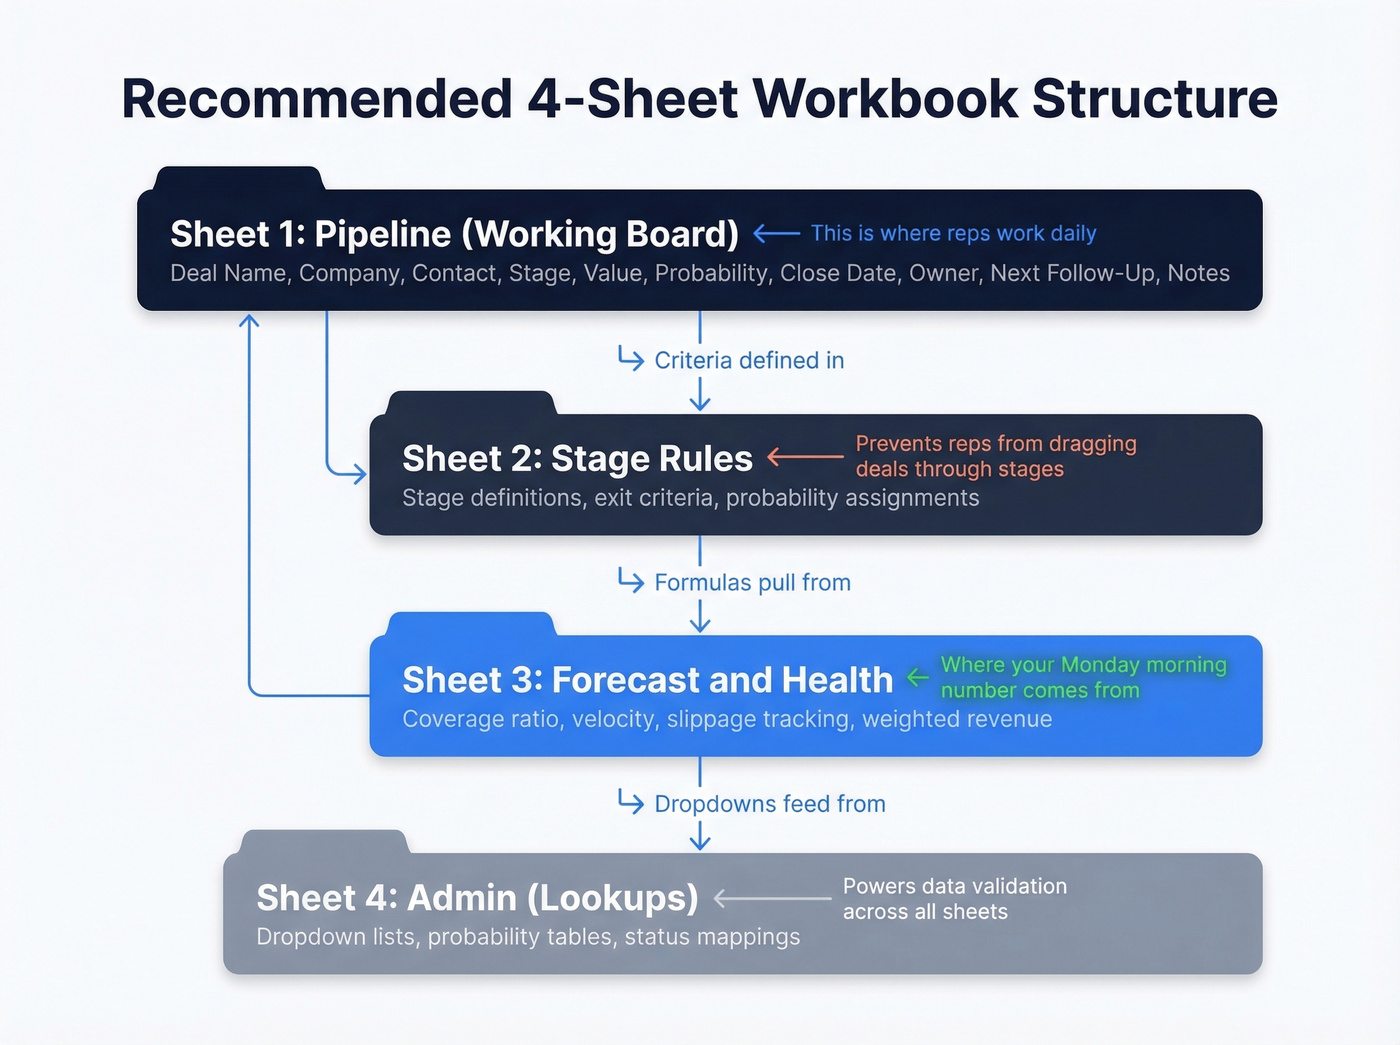
For teams managing more than 20 deals, consider a 4-sheet workbook: Pipeline (working board), Stage Rules (definitions + exit criteria), Forecast & Health (coverage, velocity, slippage), and Admin (lookups + probabilities). This keeps your working sheet clean while housing the logic elsewhere.
Step 2: Add Data Validation
Create a separate sheet called "Lists." In column A, type your stages: Prospecting, Qualification, Discovery, Proposal, Negotiation, Closed Won, Closed Lost. In column B, add statuses: Open, Won, Lost, On Hold.
Back on your Pipeline sheet, select the Stage column, go to Data > Data Validation > List, and point it to your Lists sheet. Do the same for Status. Now reps pick from dropdowns instead of free-typing "Closed-won," "closed won," "Won!!" and twelve other variants that break every formula you'll write.
To auto-derive status from stage, add this formula in your Status column:
=IF(C2="Closed Won","Won",IF(C2="Closed Lost","Lost","Open"))
One less manual input. One less source of inconsistency.
Step 3: Apply Conditional Formatting
Select your Status column. Add three rules:
- Cell value equals "Won" - green fill
- Cell value equals "Lost" - red fill
- For stalled deals, add a rule on a Stage Aging column (we'll build this): value greater than 30 - yellow fill
Color-coding gives you instant visual scanning. You'll spot a pipeline full of "Proposal" deals with no movement in seconds.
Step 4: Build a Mini Dashboard
Add a "Dashboard" section at the top of your sheet or a separate tab with these four formulas:
Total open pipeline value:
=SUMIF(Pipeline[Status],"Open",Pipeline[Value])
Number of open deals:
=COUNTIF(Pipeline[Status],"Open")
Total won revenue:
=SUMIF(Pipeline[Status],"Won",Pipeline[Value])
Win rate:
=COUNTIF(Pipeline[Status],"Won") / (COUNTIF(Pipeline[Status],"Won") + COUNTIF(Pipeline[Status],"Lost"))
These four numbers tell you more than most CRM dashboards. Update them weekly and you've got a pulse on your pipeline without logging into anything.
Pipeline Stages and Exit Criteria
B2B deals aren't linear. The average B2B purchase involves 6-10 stakeholders influencing the decision, and cycles typically run 60-120 days. Your stages need to reflect that complexity.
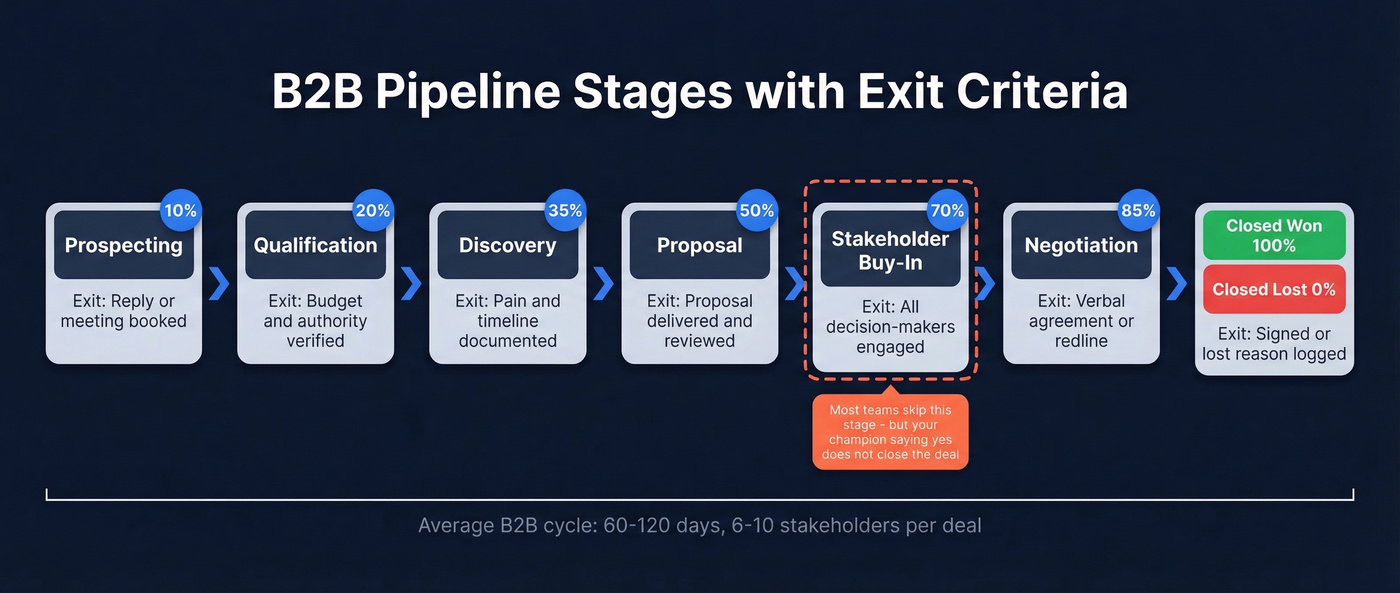
| Stage | Definition | Exit Criteria | Probability |
|---|---|---|---|
| Prospecting | Initial outreach | Reply or meeting booked | 10% |
| Qualification | Fit confirmed | Budget + authority verified | 20% |
| Discovery | Needs mapped | Pain + timeline documented | 35% |
| Proposal | Solution presented | Proposal delivered + reviewed | 50% |
| Stakeholder Buy-In | Multi-thread consensus | All decision-makers engaged | 70% |
| Negotiation | Terms discussed | Verbal agreement or redline | 85% |
| Closed Won / Lost | Deal resolved | Signed or lost reason logged | 100% / 0% |
The stage most teams miss is Stakeholder Buy-In. In B2B, your champion saying "yes" doesn't close the deal. Legal, procurement, the CFO, and two VPs who weren't in the room all have opinions. Making this a distinct stage forces reps to multi-thread before they celebrate.
Exit criteria matter more than stage names. A deal shouldn't move from Discovery to Proposal until pain, timeline, and decision process are documented. Without exit criteria, stages become meaningless labels reps drag deals through to make the pipeline look healthy.
A pipeline full of stale contacts is worse than no pipeline at all. Prospeo refreshes 300M+ profiles every 7 days - so the emails and direct dials in your spreadsheet actually connect you to real buyers, not dead inboxes.
Fill every row in your pipeline with contacts that convert.
Add Forecasting to Your Spreadsheet
A pipeline without forecasting is just a to-do list. The weighted revenue formula turns it into a prediction. In a new column called "Expected Revenue":
=B2*D2
Where B2 is Deal Value and D2 is Probability. A $50,000 deal at 35% probability contributes $17,500 to your forecast. Simple, but it immediately separates wishful thinking from weighted reality.
To bucket deals by urgency, add a "Timeline" column:
=IF(E2<=TODAY()+30,"Short-Term",IF(E2<=TODAY()+90,"Medium-Term","Long-Term"))
Now you can see at a glance which revenue is expected this month versus this quarter versus "someday."
For reporting, build a pivot table: drag Close Date to Rows, Expected Revenue to Values, and Status to Columns. Filter by Sales Stage. Add a PivotChart and you've got a visual forecast that updates every time you refresh. Pivot tables are more flexible than most CRM reporting tools - this is where a pipeline report template in Excel genuinely earns its keep.
Pipeline Health Metrics and Benchmarks
Most teams track pipeline value but ignore pipeline health. Here's the thing: a $2M pipeline means nothing if 60% of it has been sitting in "Proposal" for 90 days.
Conversion Benchmarks
MarketJoy's B2B conversion data gives useful stage-to-stage benchmarks:
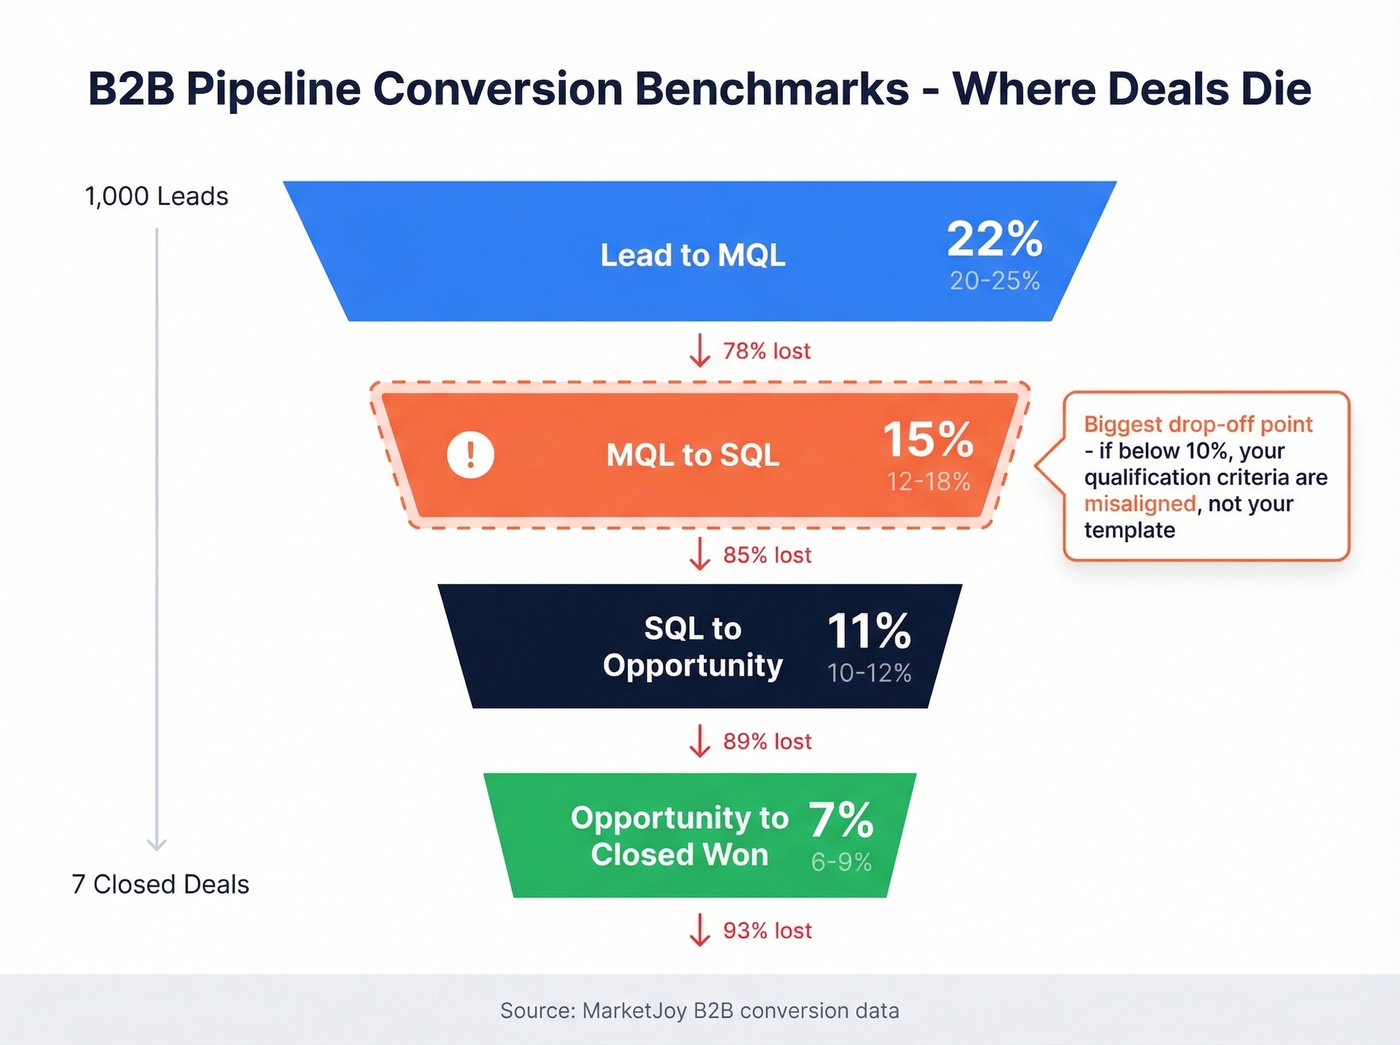
| Stage Transition | Range | Benchmark |
|---|---|---|
| Lead to MQL | 20-25% | 22% |
| MQL to SQL | 12-18% | 15% |
| SQL to Opportunity | 10-12% | 11% |
| Opp to Closed Won | 6-9% | 7% |
The biggest drop-off is MQL to SQL. That's where qualification breaks down - marketing says it's a lead, sales says it's not. If your MQL-to-SQL rate is below 10%, your qualification criteria are misaligned, not your pipeline template.
Pipeline Velocity
GTMnow calls pipeline velocity "the mother of all sales metrics," and they're right. The formula:
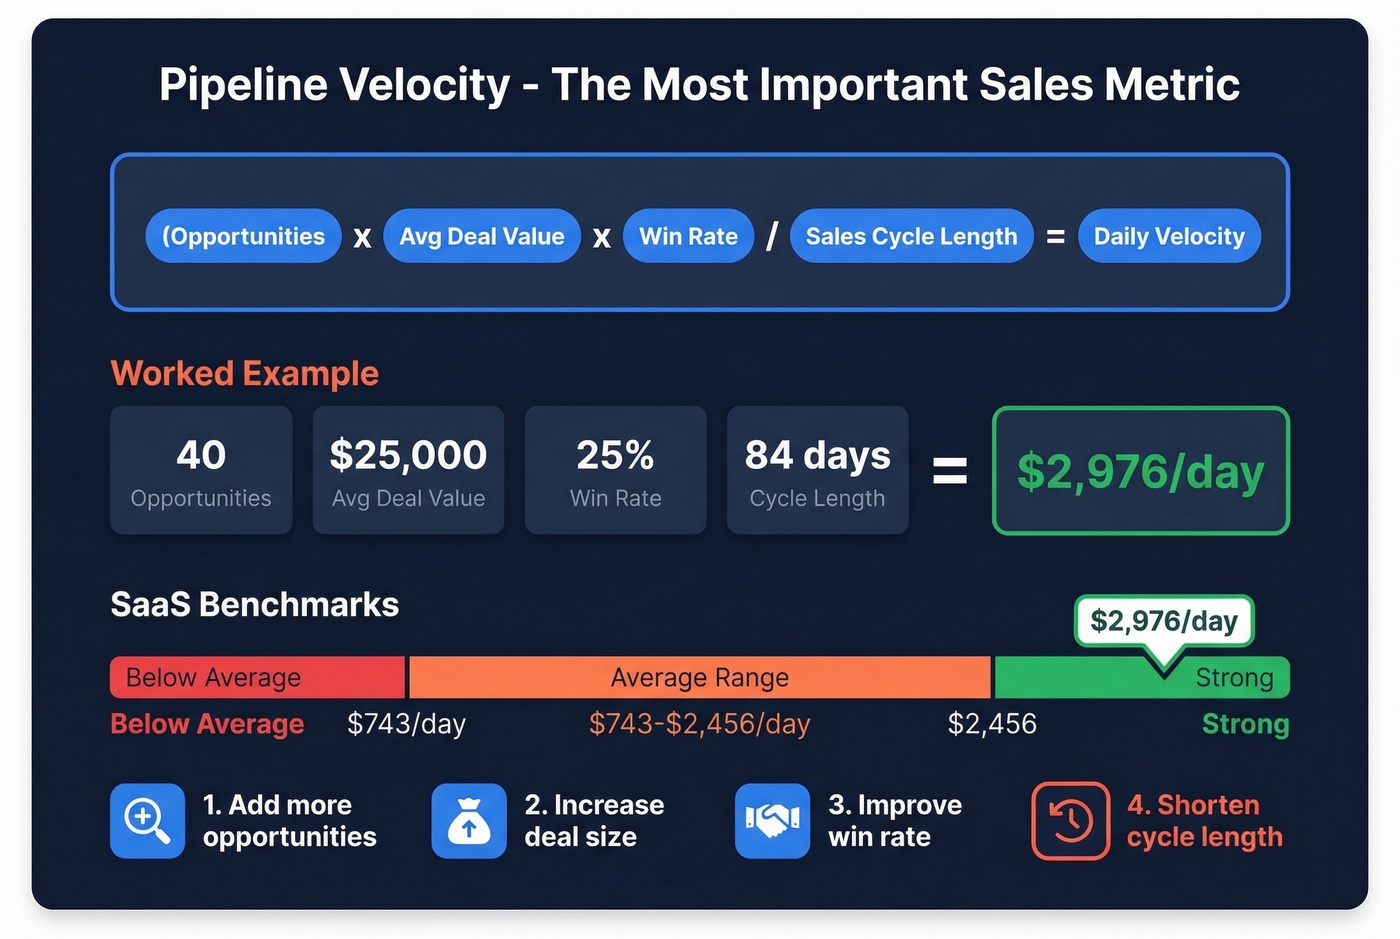
(Number of Opportunities x Average Deal Value x Win Rate) / Sales Cycle Length
Worked example: 40 opportunities x $25,000 average deal x 25% win rate / 84 days = $2,976/day in pipeline velocity.
SaaS benchmarks from The Digital Bloom put typical velocity at $743-$2,456/day, with win rates of 20-30% and a median sales cycle of 84 days. If your velocity is below $743/day, one of those four inputs needs work. In our experience, cycle length is the most overlooked lever - teams obsess over deal count and win rate but rarely ask why deals take 90 days when they should take 60.
Coverage Ratio
Track your coverage ratio: Current Quarter Pipeline / Quarterly Target. Aim for 3-5x. If your quota is $200K, you need $600K-$1M in active pipeline. Below 3x and you're relying on every deal closing. They won't.
Add a stage aging column to catch zombie deals:
=TODAY()-[Stage Entered]
Anything over 2x your average cycle length for that stage is dead weight. Remove it or re-qualify it.
Power User Tips for Your Tracker
Follow-up auto-sort. Add a helper column with =E2-TODAY() where E2 is Next Follow-Up date. Sort ascending. Today's priorities float to the top. This is a common request on Reddit - and it takes 30 seconds to build. If you need copy-paste messaging, keep sales follow-up templates handy.
Daily work queue views. Use Excel's SORT/FILTER functions or custom views to create a "Today" view filtered to follow-ups due today or overdue. Save it as a named view so you don't rebuild it every morning.
Push count tracking. Add a "Push Count" column. Every time a rep moves a close date out, increment by 1. Deals with 3+ pushes are lying to you. Flag them in your weekly review.
Weekly pipeline review cadence. Block 30 minutes every Friday. Remove dead deals, update stages, verify close dates. A pipeline tracking spreadsheet that isn't reviewed weekly decays fast - we've watched teams go from accurate forecasts to pure fiction in three weeks of skipped reviews.
Mistakes That Kill Your Forecast
Inconsistent prospecting. Pipeline is a lagging indicator. If you stop prospecting this week, you'll feel it in 60-90 days when the top of your funnel dries up. Treat prospecting like a daily habit, not a campaign - use proven sales prospecting techniques to keep the top of funnel full.
Poor qualification. Without BANT or MEDDIC criteria baked into your stage exits, reps advance deals based on vibes. "They seemed interested" isn't qualification - it's hope.
Letting leads go cold. A lead that doesn't hear from you within 24 hours is already cooling. Contacting leads within that window increases conversion by 5x. Your spreadsheet should surface overdue follow-ups automatically using the helper column trick above.
Keeping zombie deals. That $80K deal that's been in "Negotiation" for four months? It's dead. Keeping it inflates your pipeline number and destroys forecast accuracy. If a deal hasn't moved in 2x your average stage duration, move it to Lost or re-qualify from scratch.
Garbage data in, garbage forecast out. Your pipeline metrics are meaningless if your contact data is wrong. Bounced emails and wrong phone numbers mean deals stall at outreach, and your conversion rates look artificially terrible. Verify your list before it enters the pipeline - tools like Prospeo check emails in real-time with 98% accuracy and refresh data every 7 days, which keeps your pipeline inputs clean from the start. (If you're comparing vendors, see data enrichment services and lead enrichment.)
Let's be honest: most pipeline problems aren't pipeline problems. They're data quality and qualification problems wearing a pipeline disguise. Fix your inputs and the spreadsheet practically fixes itself.
You just built a pipeline template with forecasting formulas and health metrics. Now it needs deals - real ones. Prospeo's 30+ search filters (intent data, technographics, headcount growth) let you find decision-makers at $0.01/email with 98% accuracy.
Stop forecasting on empty rows. Fill your pipeline in minutes.
When to Ditch the Spreadsheet
You've usually outgrown spreadsheets when you grow beyond 1-2 salespeople, start losing deal information, or multiple people accidentally call the same prospects. Specific failure modes that signal it's time:
- Concurrency conflicts - two reps editing the same file, one overwrites the other
- Version proliferation - "Pipeline_Final_v3_reallyfinal_UPDATED.xlsx"
- No relational structure - you can't link contacts to companies to deals without VLOOKUPs that break
- No automation - follow-up reminders, activity logging, and stage updates are all manual
For teams that want pipeline tracking without a full CRM, tools like Airtable and Monday.com sit between spreadsheets and CRMs - more structure than Excel, less overhead than Salesforce. If you're evaluating options, start with a quick scan of examples of a CRM and contact management software.
When you're ready for a full CRM, here's what entry-level options cost:
| CRM | Plan | Price |
|---|---|---|
| HubSpot CRM | Free | $0 |
| HubSpot Sales Hub | Professional | ~$90/user/mo |
| folk | Standard | $20/user/mo |
Pipedrive and folk are the lightest lifts from a spreadsheet. HubSpot Free is the obvious first step if you want to stay at $0. But skip the switch if your only problem is messy data or inconsistent updates - a CRM won't fix habits, it'll just give you a more expensive place to ignore them. If forecasting is the main pain, consider dedicated sales forecasting solutions.
FAQ
Can I use an Excel pipeline template in Google Sheets?
Yes. Most formulas in this guide work in Google Sheets with minimal syntax changes. Sheets adds real-time collaboration and Zapier integrations across 2,000+ connections, making it ideal for remote teams editing the same pipeline simultaneously.
How many pipeline stages should I have?
Five to seven for most B2B teams. Fewer than five and you lose visibility into where deals stall. More than eight and reps stop updating because the process feels bureaucratic. Match stages to your actual sales process, not a template's assumptions.
What's a good pipeline coverage ratio?
Aim for 3-5x your quarterly revenue target. If your quota is $200K, you need $600K-$1M in active pipeline. Below 3x means you're relying on nearly every deal closing, and statistically, they won't.
How do I keep pipeline data accurate?
Two habits: weekly reviews where you remove dead deals and update stages, and verified contact data at the point of entry. Bad emails and wrong numbers corrupt your conversion metrics from the start - verify before you import.
Is there a free project pipeline template (not sales)?
Yes. Smartsheet's Project Pipeline Template uses stages like Research, Approval, Develop, Test, Execute, and Launch, with auto-calculated durations plus "Active Pipeline" and "Monthly Report" tabs. It's built for project managers tracking initiative portfolios, not sales deals.