Expansion Revenue: 2026 Benchmarks & Playbook
Most SaaS teams treat expansion revenue as a nice-to-have. That's a mistake.
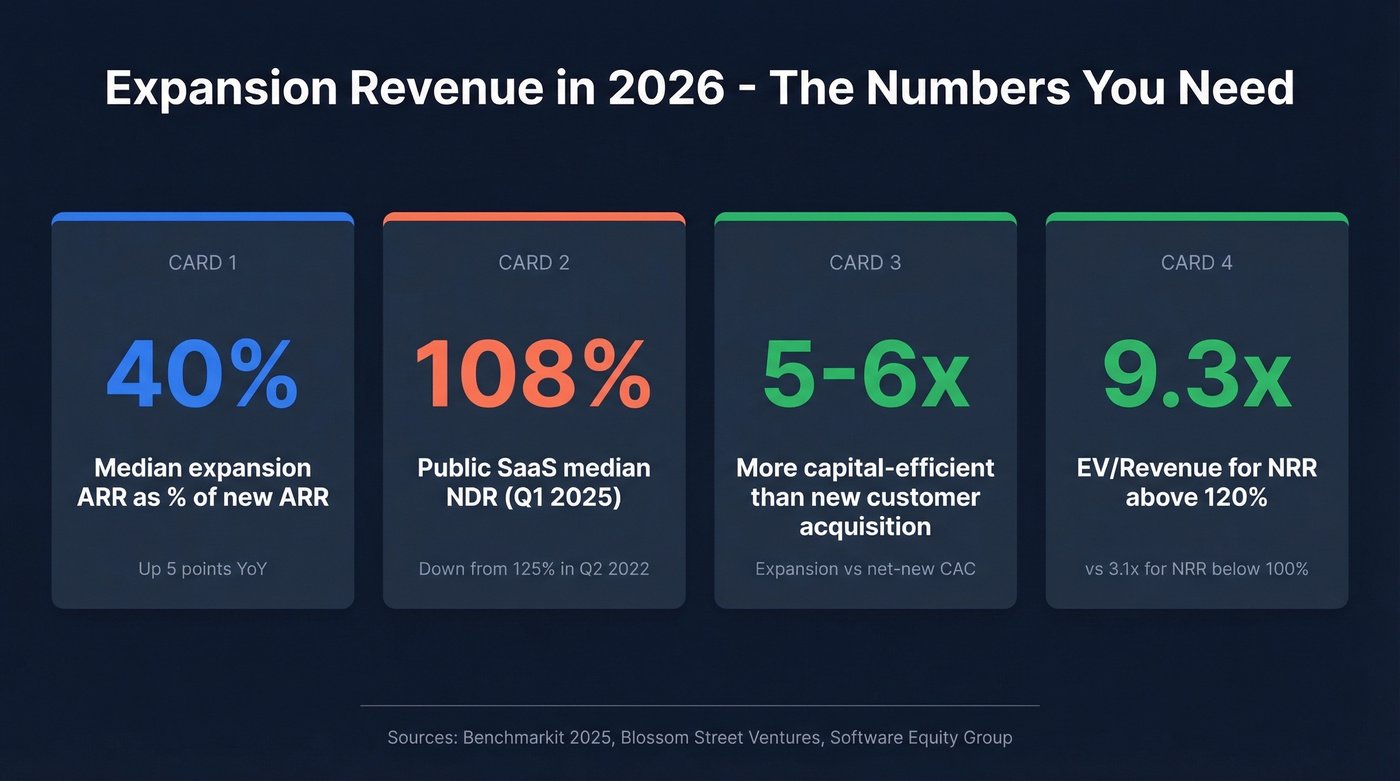
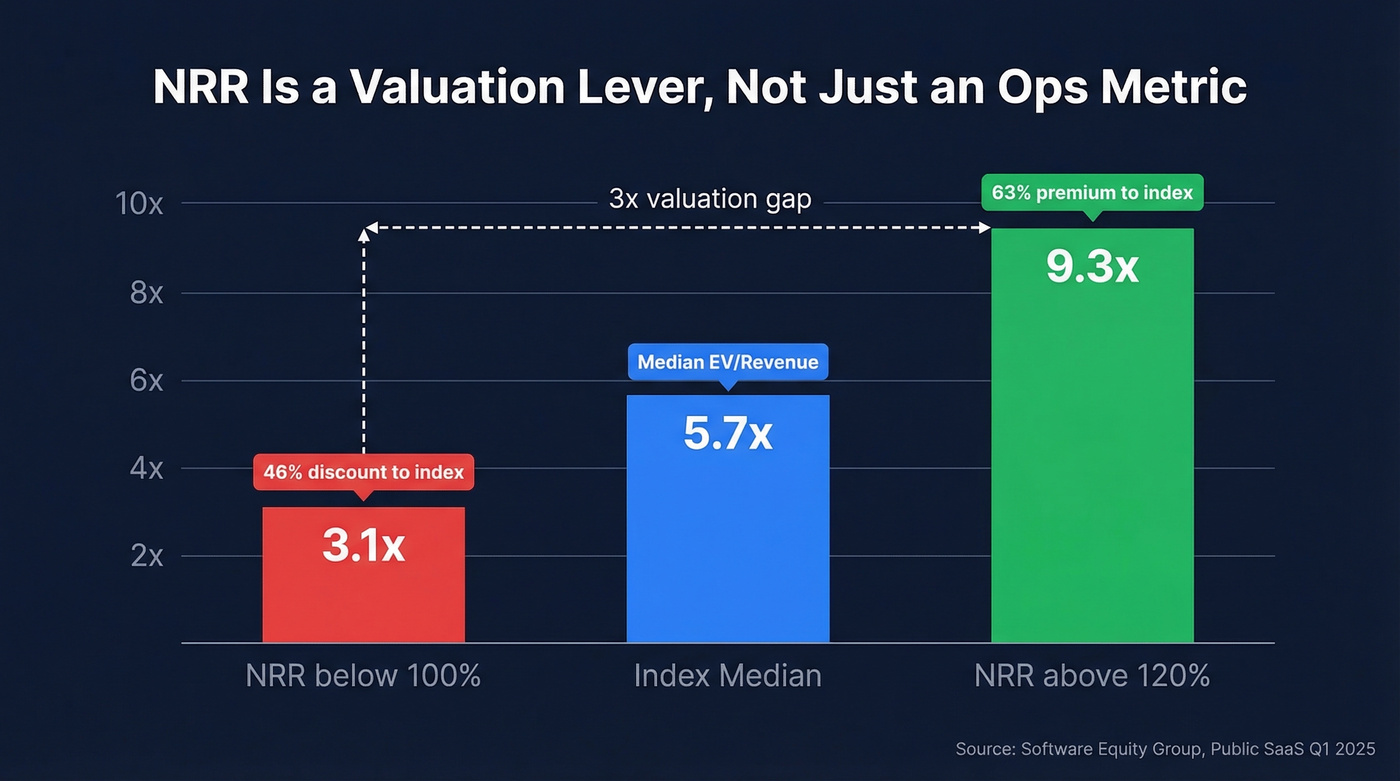
Public SaaS median NDR dropped from 125% in Q2 2022 to 108% in Q1 2025, and in public markets, retention leaders get dramatically higher valuation multiples - 9.3x EV/TTM revenue for NRR above 120% versus a brutal 3.1x for NRR below 100%. The gap between companies that grow their existing accounts and those that don't isn't narrowing. It's widening.
The Short Version
Median expansion ARR now sits at 40% of new ARR, up 5 percentage points year-over-year. If you're below 30%, you're over-indexed on acquisition. Public SaaS median NDR fell to 108% across 33 reporting companies. Expansion is harder now, which makes it more valuable.
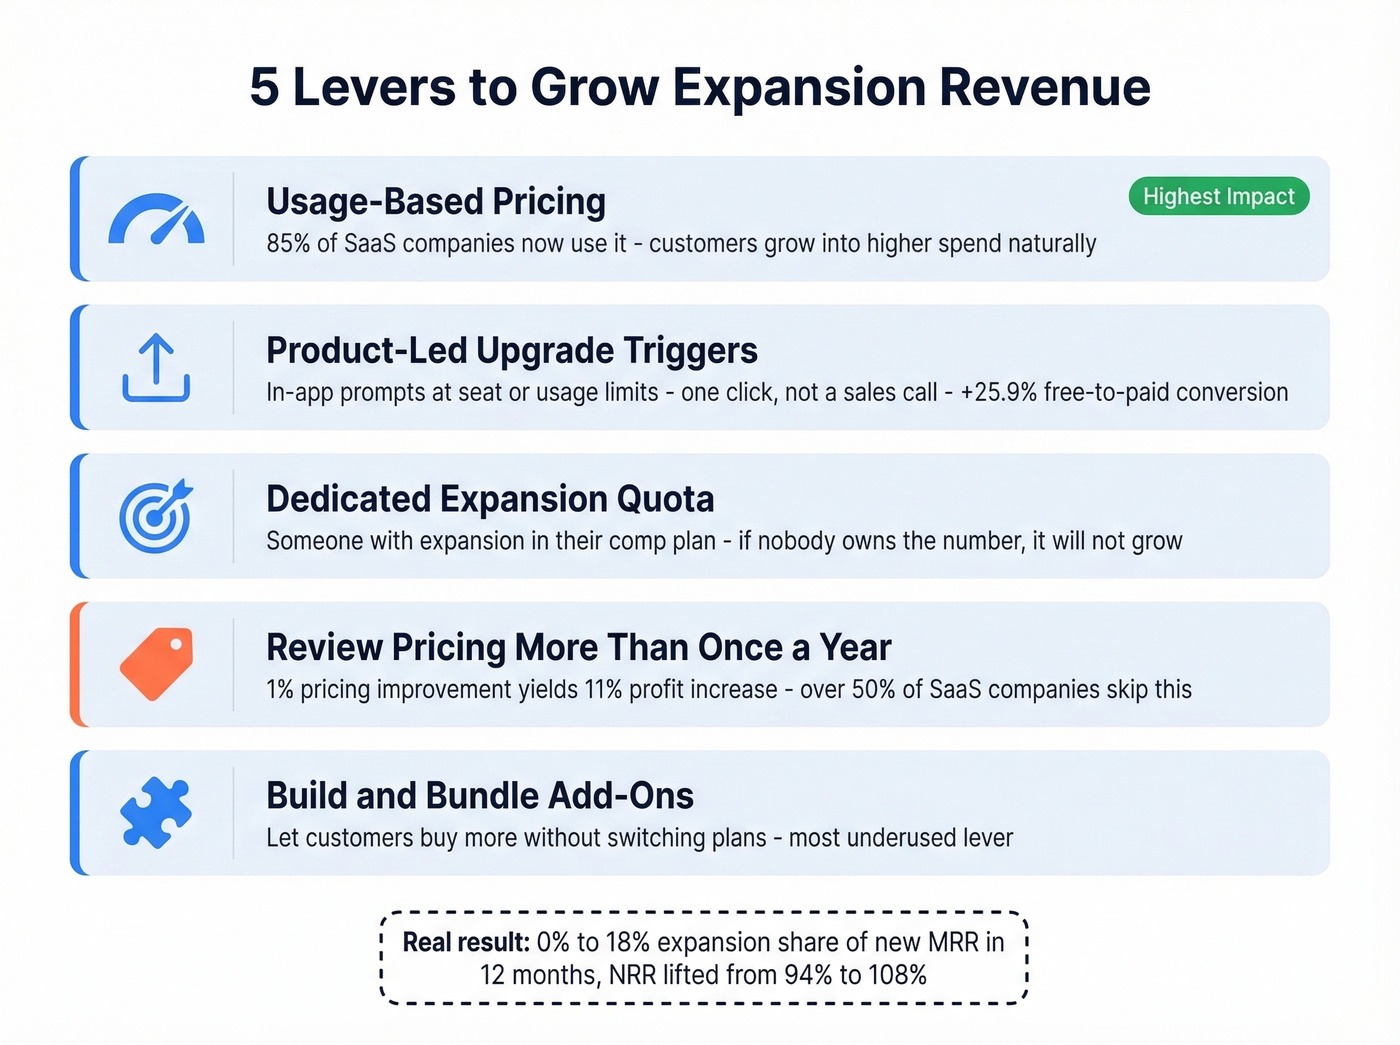
The playbook: usage-based pricing, product-led upgrade triggers, add-on products, and someone with "expansion" in their comp plan. If nobody's comped on it, you don't have an expansion strategy - you have a hope.
What Is Expansion Revenue?
Expansion revenue is the additional recurring revenue you generate from existing customers beyond their original contract value. It's the growth that happens after the initial sale.
There are four types. Upsells move a customer to a higher-tier plan. Cross-sells add a different product line. Add-ons layer new features or modules onto an existing plan. Usage growth captures the natural increase when customers consume more of a metered product. What it doesn't include: revenue from brand-new customers, standard renewals at the same contract value, or one-time professional services fees. If the customer was already paying you and now they're paying you more on a recurring basis, that counts.
How to Calculate Expansion MRR
The core formula:
Expansion MRR = End-of-period MRR from the same starting customers - Start-of-period MRR from those customers (exclude any MRR from new customers added during the period)
To get the rate:
Expansion MRR Rate = (Expansion MRR / Starting MRR) x 100
Say you start the month with $100K MRR from existing customers. By month's end, those same customers generate $103K. Your expansion MRR is $3K, your monthly expansion rate is 3%, and annualized you're running roughly a 36% expansion rate.
One thing we see teams mess up: counting reactivations as expansion. Churned customers who come back are a separate line item. Mixing them in inflates your numbers and hides the real story (if you need a clean framework, start with churn analysis).
2026 Benchmarks That Matter
The stat everyone cites for expansion economics - Pacific Crest's $0.20 per $1 ACV for expansion vs $1.13 for new customers - is from 2016. Directionally right, but the numbers have shifted. Here's what current data shows.
Benchmarkit's 2025 report puts median expansion ARR at 40% of total new ARR, up 5 percentage points year-over-year. For companies above $50M ARR, expansion exceeds 50% of new ARR. Paddle's benchmark data across 5,000 companies points to a 20-30% north star for expansion as a share of total revenue. Twilio remains the poster child: existing customers spend 59% more revenue each year, compounding inside the relationship.
The valuation impact is stark. Companies with NRR above 120% trade at a median 9.3x EV/revenue - a 63% premium to the index median of 5.7x. Below 100% NRR? You're at 3.1x, a 46% discount. Growing revenue from existing accounts isn't just an operational metric. It's a valuation lever.
| Metric | Median | Top Quartile | Source |
|---|---|---|---|
| Expansion as % of new ARR | 40% | >50% | Benchmarkit 2025 |
| Public SaaS NDR (Q1 2025) | 108% | >120% | Blossom Street Ventures |
| EV/Revenue (NRR >120%) | 9.3x | - | Software Equity Group |
| EV/Revenue (NRR <100%) | 3.1x | - | Software Equity Group |
PeakSpan and Ibbaka's research on mid-market SaaS companies found even stronger numbers in that segment: average NRR of 131%, churn of just 7%, and expansion at 24% of total revenue.
Growing existing accounts requires knowing every stakeholder in the buying committee. Prospeo gives you 300M+ profiles with 30+ filters - including headcount growth, department size, and job changes - so you can spot upsell opportunities the moment they appear.
Stop guessing which accounts are ready to expand. Start seeing the signals.
Why Account Growth Matters More Than Ever
Let's be honest: expansion is getting harder, which is exactly why it's more valuable.
Public SaaS median NDR has fallen 17 points since Q2 2022. GRR slipped from 90% to 88% over three years. Customers are consolidating vendors, scrutinizing renewals, and pushing back on price increases. The easy expansion era - where usage just grew and nobody questioned the bill - is over.
Acquisition costs keep climbing. Benchmarkit's 2025 data shows a median new CAC ratio of $2.00 in S&M spend per $1 of new customer ARR. Even if the real cost of growing existing accounts has drifted upward since that 2016 Pacific Crest figure, it's still roughly 5-6x more capital-efficient than net-new acquisition and it directly improves your LTV:CAC ratio from the 3-5x range toward 5x+ (if you want to pressure-test your inputs, use a standard cost to acquire customer breakdown).
If your average deal size is under $15K, growing existing accounts matters more than your new-logo pipeline. At that price point, you can't afford the CAC to replace churned customers. You have to grow the ones you have.
How to Increase Expansion Revenue
We've seen teams approach this five different ways. The best ones combine at least three.
Add a Usage-Based Pricing Component
Metronome's 2025 survey found 85% of SaaS companies have adopted usage-based pricing, with nearly half adopting in the last two years. Usage-based components create a natural path to higher spend - customers grow into it without a sales conversation. It's the single most effective structural change you can make for expansion, and it's why companies like Twilio, Datadog, and Snowflake post NRR numbers that make everyone else jealous.
Build Product-Led Upgrade Triggers
One SaaS founder on r/SaaS shared that account growth surpassed new customer revenue after roughly three years - driven entirely by in-product triggers when customers hit seat or usage limits. The key: make the upgrade path frictionless. One click, not a call with sales. ProductLed's 2025 dataset across 446 companies backs this up - companies transitioning to self-serve see +25.9% free-to-paid conversion and 68% profitability versus 36.4% without self-serve.
Give Someone Expansion as a Quota
PeakSpan and Ibbaka's research across 500+ B2B SaaS companies found that dedicated teams responsible for account growth outperform other org designs. If expansion lives in the gap between CS and sales with nobody owning the number, it won't grow. This is especially true in B2B, where multi-stakeholder buying committees mean someone needs to actively manage the account relationship and spot the right moment to pitch a bigger commitment (this is where account-based selling best practices tend to outperform generic outbound).
Review Pricing More Than Once a Year
Price Intelligently research shows a 1% improvement in pricing yields an 11% increase in profits. Yet over 50% of SaaS companies review pricing less than once a year. Annual pricing reviews - adjusting tiers, packaging, and value metrics - are one of the highest-leverage activities most teams skip. If you haven't touched your pricing page in 12 months, start there before building anything new.
Build and Bundle Add-On Products
Add-ons are the most underused expansion lever. They let customers buy more without switching plans, and they give your product team a forcing function to ship features that map to willingness-to-pay. The r/SaaS practitioner who went from 0% to 18% expansion share of new MRR? Add-ons contributed 3% of that - and they were the last lever implemented.
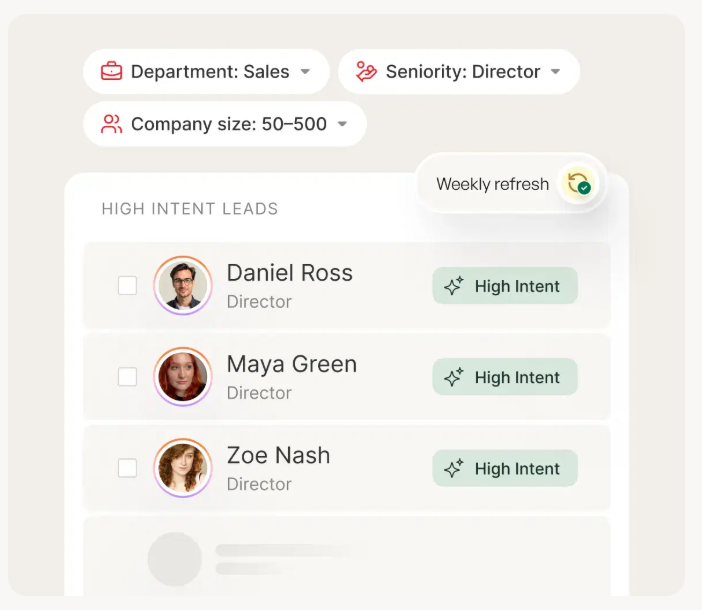
Once you have these levers in place, the question becomes which accounts to target first. Prospeo's intent data tracks 15,000 topics, so CS teams can see which existing accounts are actively researching solutions you already sell them and prioritize those conversations instead of guessing (if you want a practical framework, see identifying buying signals and intent based segmentation).
The proof this works: Another r/SaaS practitioner documented going from 0% to 18% expansion share of new MRR over 12 months, lifting NRR from 94% to 108%. Usage overages contributed 8%, plan upgrades 6%, add-ons 3%, and monthly-to-annual conversions 1%. Average customer revenue increased 23% over lifetime.
If expansion is 40% of new ARR, your account growth team needs direct access to decision-makers - not gatekeepers. Prospeo delivers 98% accurate emails and 125M+ verified mobiles with a 30% pickup rate, so your expansion reps actually connect with buyers.
Your best revenue is already in your customer base. Reach the right people inside it.
Five Expansion Mistakes to Avoid
In our experience, mistake #1 is the most common - and the most damaging.
Treating expansion as just renewals. Renewal is retention. Expansion is growth. They require different motions, different conversations, and different skills. Skip this distinction and you'll wonder why your "expansion" number tracks perfectly with your renewal calendar (for the clean definition and benchmarks, use renewal rate).
No executive sponsor alignment. If your champion leaves and you haven't built relationships above them, expansion conversations stall. We've watched six-figure upsells die because the only person who cared about the product got promoted to a different division.
Not demonstrating measurable ROI. Customers expand when they can see the value they've already received. If you can't quantify it, they can't justify spending more.
Leaving expansion to sales alone. CS teams have the trust and usage visibility. Sales teams have the deal skills. It works best when both are involved.
CSMs not equipped for revenue conversations. If your CS team isn't trained and comped on expansion, you're leaving money on the table every quarter.
Expansion Revenue vs. Related Metrics
These three metrics get confused constantly.
| Metric | What It Measures | Includes Expansion? | Use It For |
|---|---|---|---|
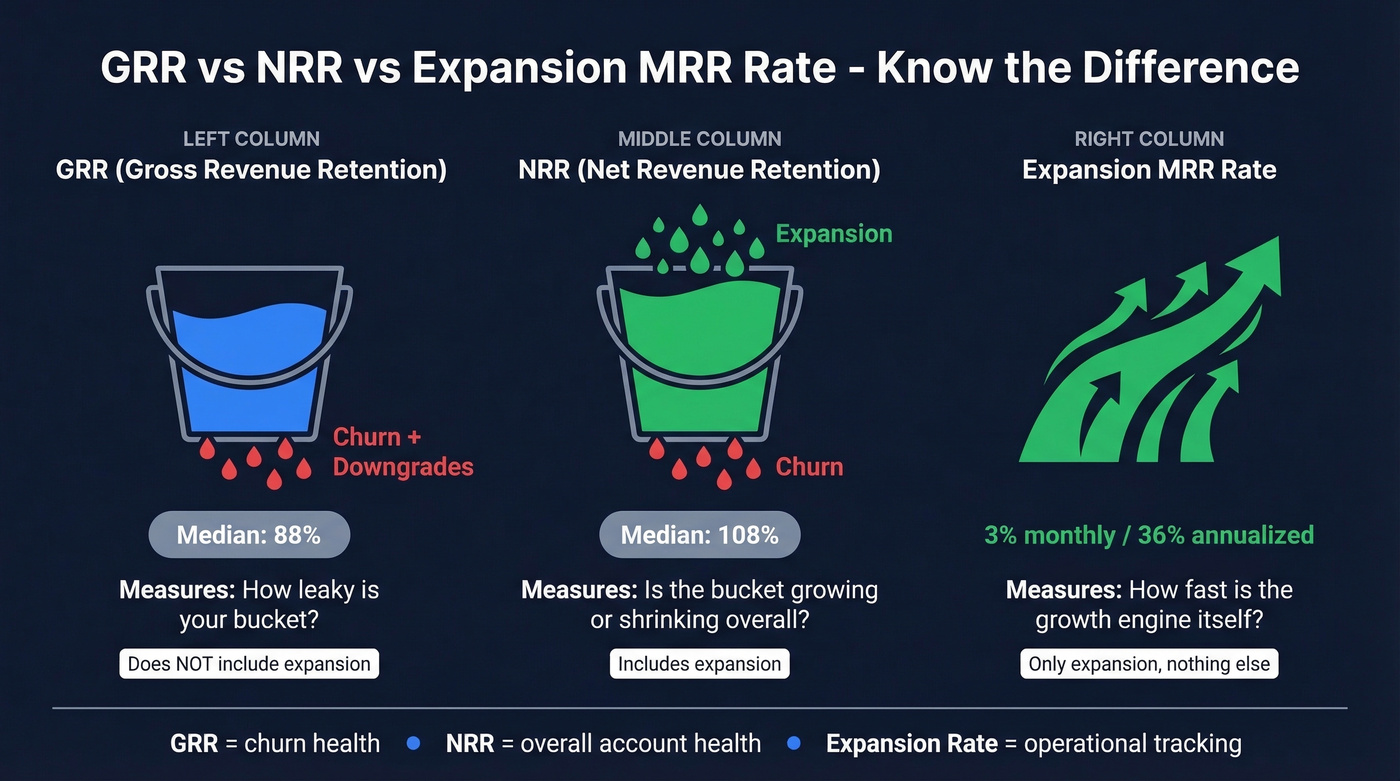
| GRR | Retained revenue, no expansion | No | Churn health |
| NRR | Net revenue from existing customers | Yes | Overall account health |
| Expansion MRR Rate | Period-over-period expansion growth | Yes (only expansion) | Operational tracking |
GRR tells you how leaky your bucket is. NRR tells you whether the bucket is growing or shrinking overall. Expansion MRR Rate isolates the growth engine itself.
NRR is cohort-based, tracking the same customers over time. Expansion MRR Rate is a period-over-period operational metric your expansion team should be measured against week to week. If you're only watching NRR, you're seeing the outcome but not the input - and you can't manage what you can't see at the operational level (this is also why teams formalize sales operations metrics instead of relying on a single north-star KPI).
FAQ
What's a good expansion revenue rate?
Median expansion ARR is 40% of new ARR per Benchmarkit's 2025 data. Aim for 30%+ as a floor - companies above $50M ARR typically exceed 50%. Below 30% signals over-indexing on new-logo acquisition at the expense of account growth.
How does expansion revenue differ from upsell revenue?
Upselling is one type of expansion. The broader category also includes cross-sells, add-ons, seat increases, and usage-based growth - any incremental recurring revenue from existing customers beyond their original contract value.
What tools help identify upsell-ready accounts?
Intent data platforms surface which accounts are actively researching solutions you sell. CRM enrichment tools that refresh data weekly also help flag job changes and headcount growth at existing accounts - both strong signals that an account's needs are evolving beyond their current plan.
Why has net dollar retention declined since 2022?
Public SaaS median NDR fell from 125% to 108% as buyers consolidated vendors, tightened budgets, and pushed back on automatic price increases. GRR also slipped from 90% to 88%, meaning the base is eroding faster - making a deliberate expansion strategy even more critical.