Firmographic Data Examples: What It Actually Looks Like (With Sample Datasets)
Most firmographic data guides hand you a definition, a bulleted list of attributes, and zero actual data. That's not helpful. You want firmographic data examples - company records with real values you can reference, copy, and adapt. Companies that personalize outreach generate 40% more revenue than those that don't, and firmographic segmentation is where that personalization starts.
The quick version: Firmographic data is the set of measurable company attributes - industry, size, revenue, location, ownership, growth - you use to segment and qualify accounts. Below you'll find a filled-in dataset, 8 core attribute types with examples, and four segmentation scenarios you can steal outright.
What Is Firmographic Data?
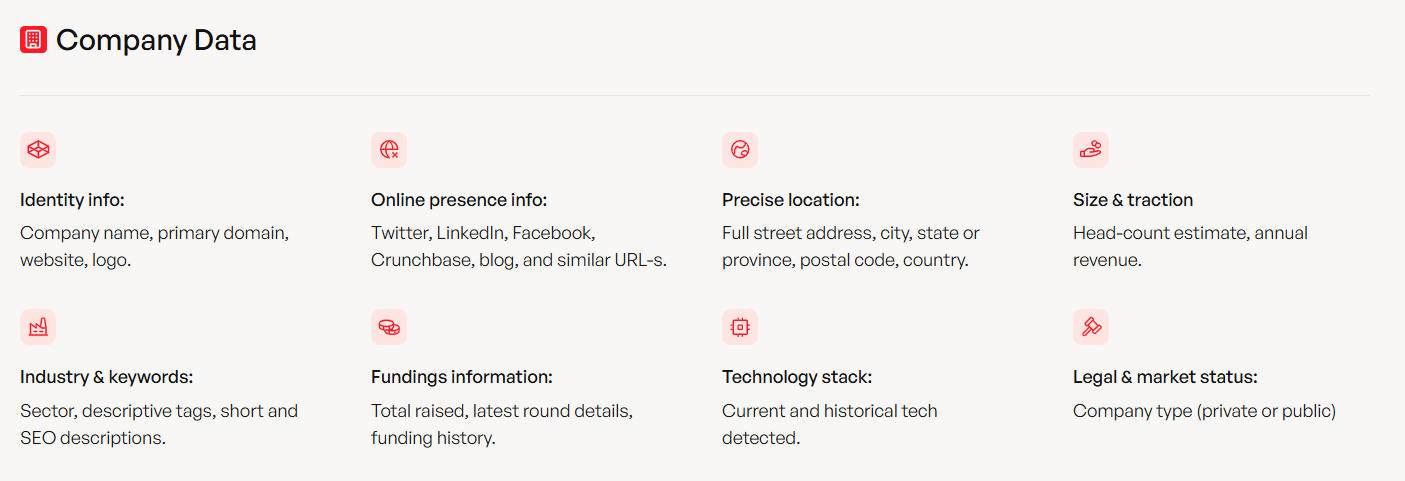
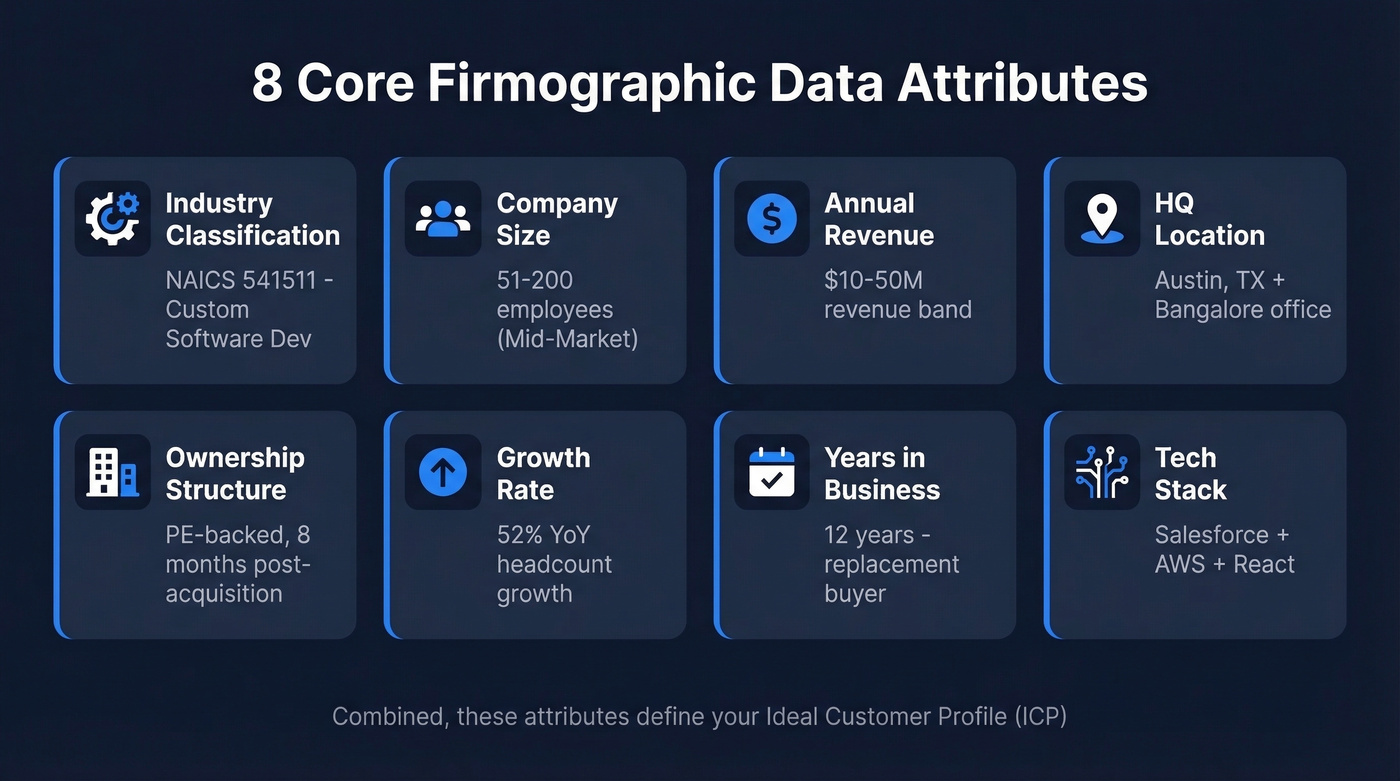
Firmographic data is the B2B equivalent of demographics. Instead of describing individuals (age, income, location), it describes companies - the measurable attributes you use to segment, qualify, and prioritize business accounts. The core attributes are industry classification, company size, annual revenue, geographic location, ownership structure, growth rate, years in business, and technology stack.
Every ICP you've ever built is firmographic data, whether you called it that or not. A simple example: knowing that a prospect is a 200-person SaaS company headquartered in Austin with $15M in revenue immediately tells you how to position, price, and prioritize. That single row of data changes your entire approach.
Sample Dataset With Real Values
Here's what a real firmographic dataset looks like when it's actually filled in - not a list of column headers, but records with values you can model your own data against.
| Company | Industry (NAICS) | Employees | Revenue | HQ |
|---|---|---|---|---|
| MedVault | 541511 | 51-200 | $5-10M | Austin, TX |
| Ridgeline FS | 523110 | 1,001-5,000 | $500M-1B | Charlotte, NC |
| Apex Mfg | 332710 | 11-50 | $1-5M | Toledo, OH |
| CloudSecure | 541512 | 201-500 | $25-50M | San Francisco, CA |
| Greenfield Ed | 611710 | 51-200 | $1-5M | Denver, CO |
| Patriot Logistics | 484110 | 5,001-10,000 | $1B+ | Memphis, TN |
Additional attributes per record: Domain, ownership type (Private, Public, PE-backed, Nonprofit), and YoY headcount growth. MedVault is private with 38% growth. CloudSecure is PE-backed at 52%. Patriot Logistics is public at 4%.
Each row is a prospect you can score, route, and message differently. The same dataset drives completely different outreach strategies: MedVault gets HIPAA-focused copy, Ridgeline gets enterprise compliance messaging, and CloudSecure's 52% headcount growth is a buying signal on its own.
8 Core Firmographic Attribute Types
Industry Classification
NAICS uses a 6-digit system - 541611 is Administrative Management & General Consulting Services, 812112 is Beauty Salons, 541214 is Payroll Services. SIC is the older 4-digit system (7371 = Computer Programming). The biggest mistake we see teams make: using only 2-digit NAICS codes, which are so broad they're useless. "54" covers everything from legal services to advertising. Go to at least 4 digits. And verify your codes against the latest revision - NAICS updates every 5 years.
Company Size
Employee count is the most common sizing metric because it's publicly observable. Standard brackets: 1-50 (SMB), 51-200 (mid-market), 201-1,000 (upper mid-market), 1,001+ (enterprise). Your sales motion should change at each threshold. A 30-person startup doesn't buy the way a 3,000-person bank does, and treating them the same wastes everyone's time.
Revenue and Location
Revenue bands tell you budget capacity: under $1M, $1-10M, $10-50M, $50-250M, $250M+. Revenue is harder to verify than headcount for private companies, so expect some fuzziness in that data. HQ location is the baseline, but office footprint matters more for field sales - a company headquartered in San Francisco with 200 employees in Bangalore presents two different selling motions. Which team you're targeting changes everything.
Ownership Structure
Public, private, PE-backed, nonprofit, government - each has different procurement cycles, budget authority, and compliance requirements.
Here's a hot take: PE-backed companies in the first 18 months post-acquisition are the single most underrated segment in B2B sales. They're consolidating vendors, under pressure to show EBITDA improvement, and making buying decisions faster than any other ownership type. If you aren't filtering for them, you're leaving pipeline on the table.
Growth Rate
Year-over-year headcount or revenue growth is the firmographic attribute most teams underuse. A company growing 50%+ is hiring, buying tools, and making decisions fast. Adding a headcount-growth filter to your existing ICP is one of the simplest ways to shift outbound toward accounts that are actually in motion. We've found this single filter does more for reply rates than any amount of subject-line testing.
Years in Business and Tech Stack
Startups (0-3 years) build their stack from scratch. Established companies (10+ years) are replacing what they have - and Gartner puts replacement buys at 60%+ of software purchases. Tech stack sits at the border of firmographic and technographic data. Knowing a company runs Salesforce, AWS, and React tells you about their sophistication, budget, and integration requirements all at once.
You just saw what a filled-in firmographic dataset looks like. Prospeo's database has 300M+ profiles with 30+ filters - industry NAICS codes, headcount growth, revenue bands, ownership type, tech stack - all refreshed every 7 days.
Stop modeling sample data. Build your actual target list in minutes.
Building a Segmentation Template
Most teams buy data platforms and then just filter by job title - never wiring firmographic signals into their actual sequences or messaging. The consensus on r/sales is brutal about this: "just dumping generic job titles into Apollo or ZoomInfo" without operationalizing the data underneath is the default, and it shows in reply rates. A reusable segmentation template fixes this by codifying your filters, thresholds, and messaging angles into a repeatable framework.

Four scenarios with specific thresholds you can copy:
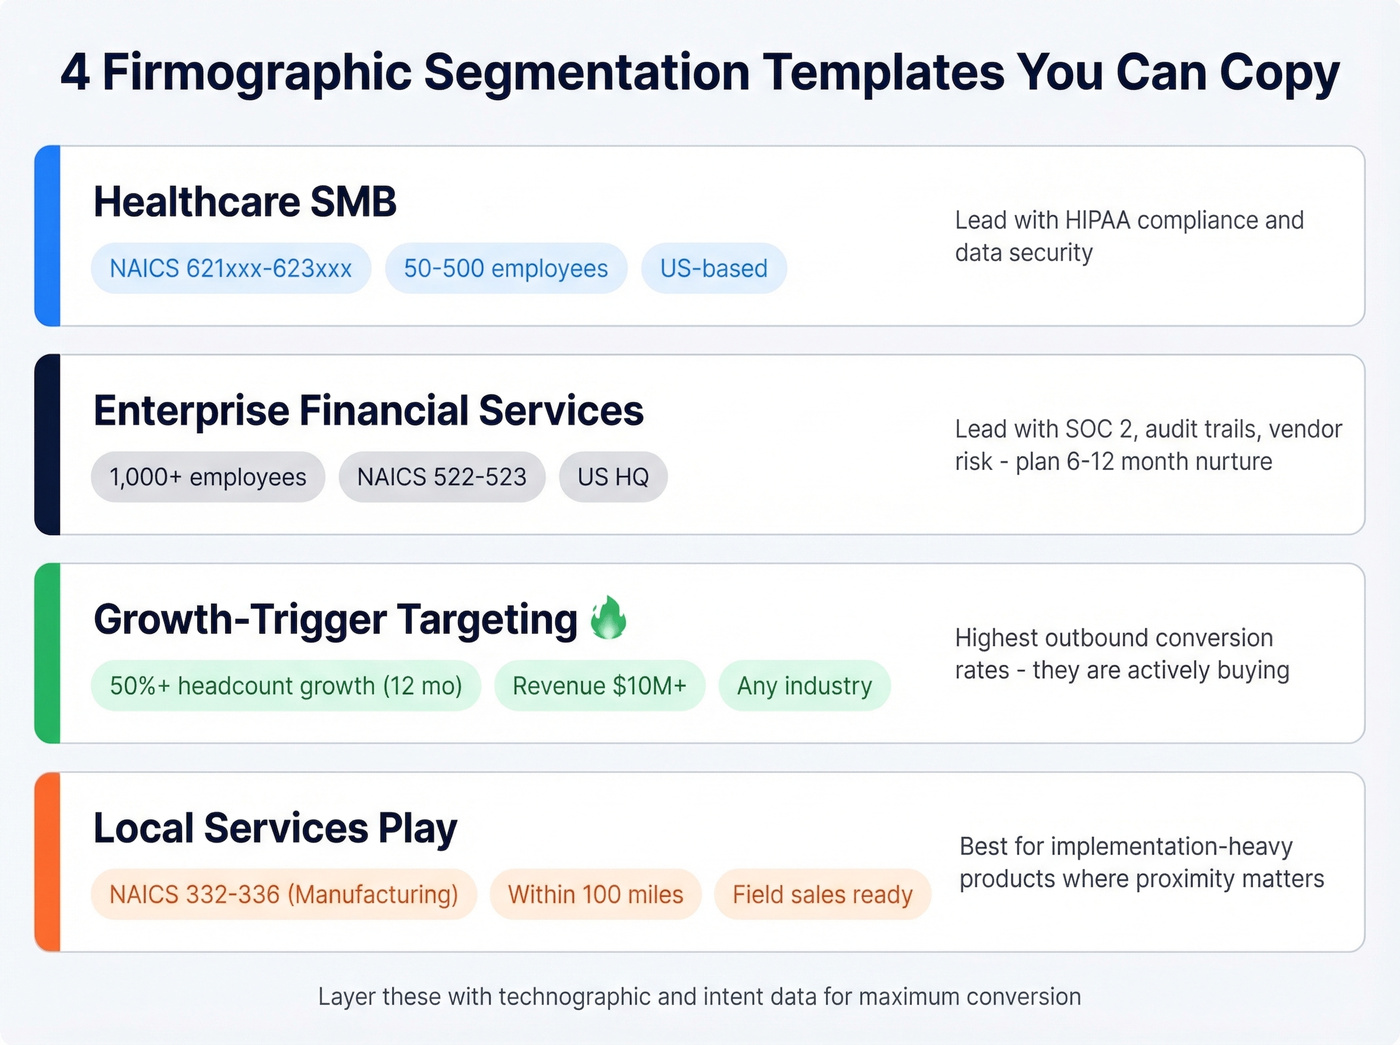
Healthcare SMB: Industry = healthcare (NAICS 621xxx-623xxx), 50-500 employees, US-based. Your messaging leads with HIPAA compliance and data security. Skip companies under 50 - they rarely have dedicated IT buyers.
Enterprise Financial Services: 1,000+ employees, NAICS 522-523, US headquarters. Lead with SOC 2, audit trails, and vendor risk management. Decision cycles here run 6-12 months, so plan your nurture accordingly.
Growth-Trigger Targeting: Primary filter is 50%+ headcount growth in the last 12 months, regardless of industry. Layer in revenue band ($10M+) to ensure budget exists. This is the segment where we've seen the highest outbound conversion rates in our own campaigns.
Local Services Play: Manufacturing companies (NAICS 332-336) within 100 miles of your offices. This works for field sales teams selling implementation-heavy products where proximity matters.
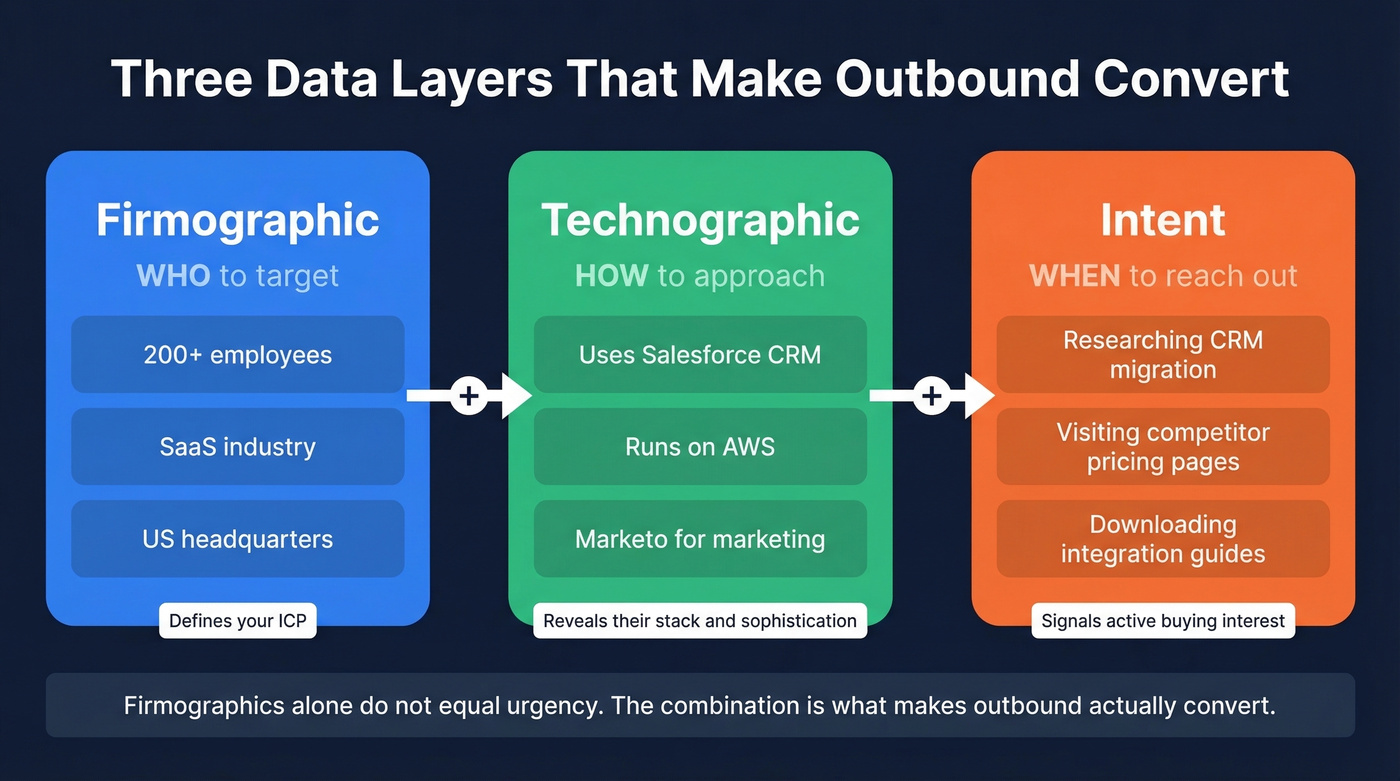
Firmographics vs. Technographics vs. Intent
These three data types answer different questions, and the teams that combine them outperform those relying on company attributes alone.
| Data Type | Question | Example |
|---|---|---|
| Firmographic | Who to target? | 200+ employees, SaaS, US |
| Technographic | How to approach? | Uses Salesforce + Marketo |
| Intent | When to reach out? | Researching "CRM migration" |
Firmographics tell you a company fits your ICP. Technographics tell you they're running a competitor's product you can displace. Intent data tells you they're actively looking right now. Let's be honest: firmographic attributes alone don't equal urgency. A company can match your ICP perfectly and have zero buying intent for the next 18 months. Some teams call this the Minimum Viable Segment - the smallest group sharing the same struggle, same moment, and same urgency. The combination is what makes outbound actually convert.
Where to Source Firmographic Data
Free and public sources get you started. SEC EDGAR covers public company financials. The Census Bureau NAICS lookup provides industry codes. Crunchbase is a common starting point for funding, headcount, and company facts, especially in tech. These are fine for one-off research but don't scale.
Self-serve platforms are where most teams should live. Prospeo covers 300M+ professional profiles with 30+ firmographic search filters, a 7-day data refresh cycle, and 98% email accuracy - the free tier gives you 75 verified emails per month, and paid plans start at ~$39/mo with no contracts. Apollo offers a generous free plan with 1,200 credits/month and paid tiers from ~$49/mo billed annually. Crunchbase starts at $49/mo billed annually for company-level data. For teams building enrichment pipelines via API, data-layer providers like Coresignal (75M+ company profiles) and People Data Labs (70M+ company profiles) are worth evaluating.

Enterprise platforms like ZoomInfo ($15-40K/year) and Dun & Bradstreet (from $49/mo for 300 credits) offer deep datasets but come with complexity and cost. Reddit threads consistently flag D&B's product catalog as confusing, and ZoomInfo's annual contracts lock you in before you know if the data quality holds up for your specific market.
Look, single-source enrichment leaves 40-60% of records incomplete. If you're serious about coverage, use at least two sources - one for breadth, one for verification. If you're comparing vendors, start with a ranked list of the best B2B databases and then narrow by your must-have filters.
Keeping Your Data Accurate
B2B data decays at ~22.5% per year - roughly 2.1% per month. Email addresses decay 23-30% annually. Phone numbers change 18% yearly.
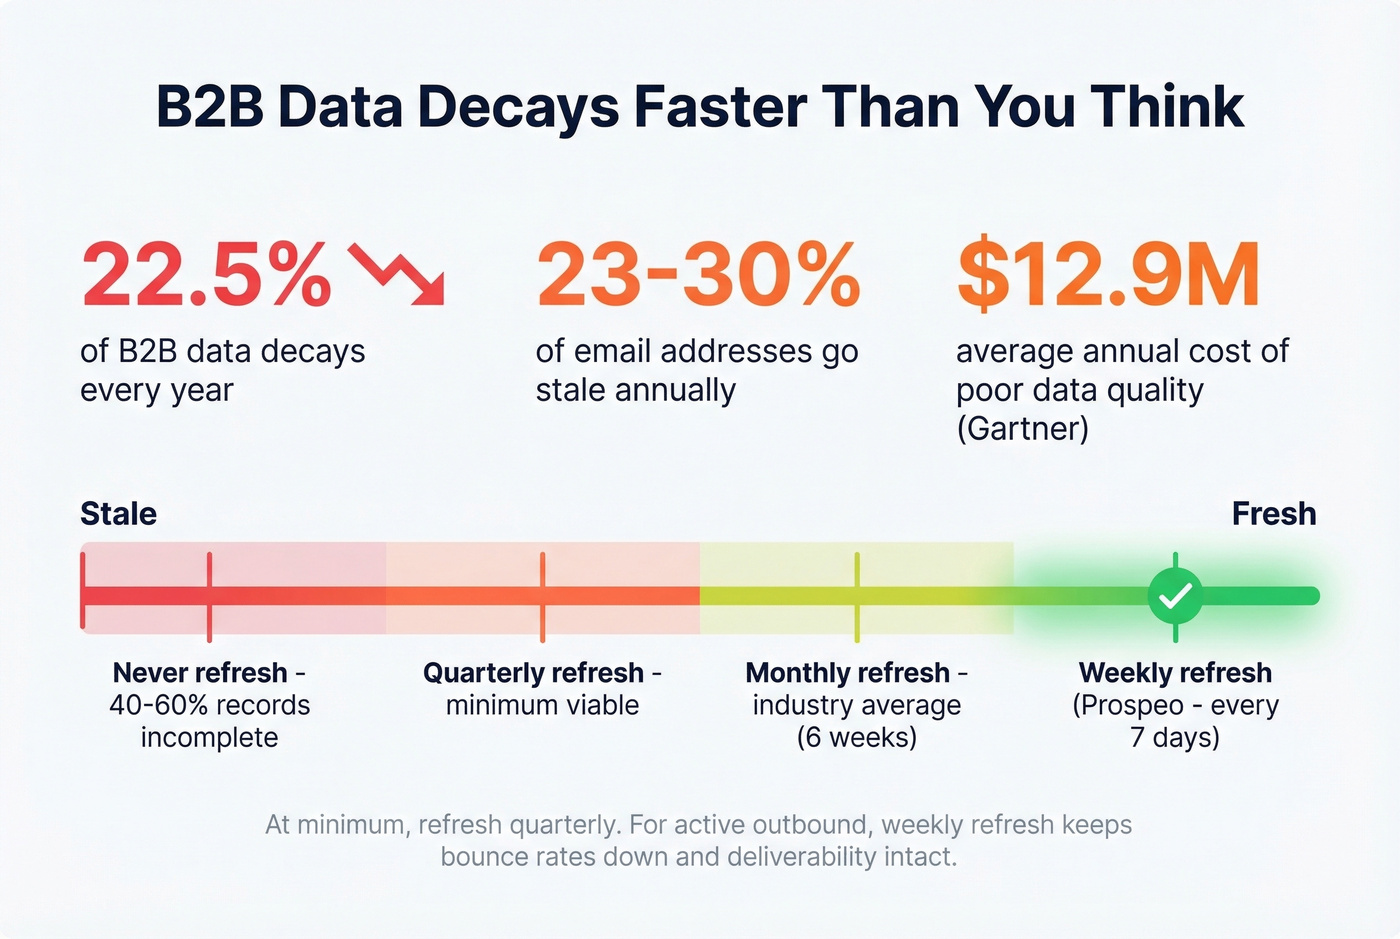
Gartner estimates poor data quality costs organizations $12.9M per year on average. That's not a theoretical risk - it's bounced sequences, wasted rep hours, and burned domain reputation. At minimum, refresh your firmographic data quarterly. For active outbound campaigns, continuous enrichment with a platform that refreshes weekly rather than monthly is what keeps bounce rates down and deliverability intact. If you're running outbound at scale, pair enrichment with data validation automation and a dedicated email verifier to keep bounce rates predictable.
Growth-trigger targeting works when the data is fresh. Prospeo refreshes every 7 days (industry average: 6 weeks), so headcount growth signals are current - not stale snapshots from last quarter. Layer firmographic filters with intent data across 15,000 topics.
Every segmentation template above runs natively inside Prospeo at $0.01 per lead.
FAQ
What's the difference between firmographic and demographic data?
Demographic data describes individuals - age, gender, income. Firmographic data describes companies - industry, employee count, revenue, location, and ownership structure. Firmographics are the B2B equivalent, used to segment and prioritize business accounts rather than consumers.
How many firmographic attributes should an ICP include?
Four to six attributes work best: typically industry, company size, revenue band, location, and one growth signal like headcount change. More than six usually over-narrows your addressable market and starves your pipeline.
What's the best free source of firmographic data?
SEC filings and the Census Bureau are completely free for basic company attributes like revenue and industry codes. For enriched records with verified contact information, Prospeo's free tier provides 75 verified emails per month with 30+ search filters - enough to build and test initial target lists.
How often should I refresh firmographic records?
Refresh quarterly at minimum, since B2B data decays at ~22.5% per year. For active outbound campaigns, monthly or continuous enrichment prevents bounced emails and wasted rep time. Platforms with weekly refresh cycles cut manual maintenance significantly.