How to Design Geographic Sales Territories That Actually Work
Field reps spend just 35-39% of their time actually selling. The rest vanishes into routing confusion, ownership disputes, and chasing accounts that were never a good fit. Most guides on geographic sales territories obsess over drawing boundaries and completely ignore the data layer underneath - the part that determines whether reps actually reach anyone once they open their territory list.
Here's how to get both right.
The Short Version
Geographic territory models work best for field-heavy teams running in-person deal motions. Design them using drive-time zones or ZIP codes (not state lines), balance by potential rather than raw area, and rebalance quarterly. The biggest killer isn't bad boundaries. It's stale data behind the assignments.
What Are Geographic Sales Territories?
Geographic sales territories divide your market by physical location, assigning reps to specific regions defined by ZIP codes, counties, or drive-time zones. They're one of the most common territory models, and for good reason: geography directly controls travel cost, meeting density, and route efficiency.
At its core, this is a location-based sales strategy. Everything else - account potential, vertical, deal size - layers on top.
When They're the Right Choice
Use geographic territory design when:
- Your team runs field sales with in-person meetings and route-dependent operations
- Account density varies significantly across regions, like urban vs. rural
- Travel burden is a real cost driver - 89% of clients prefer modern location-aware scheduling
- You need clear ownership to eliminate overlap and turf wars
Skip them when your sales motion is fully remote or digital-first, when your ICP is defined by industry or company size rather than location, or when you have fewer than five reps. With a team that small, just use named accounts and save yourself the overhead.
How to Design Territories in 5 Steps
Step 1: Choose Your Boundary Method
ZIP codes hit the sweet spot between granularity and data availability, and they're widely supported in CRM and mapping workflows. Drive-time zones are better for field teams where route optimization cuts travel time by up to 25%.

Avoid state-level boundaries. Way too broad for balanced workloads.
Step 2: Score Territory Potential
Don't just count accounts. Score each territory by revenue potential, account density, whitespace opportunity, and competitive presence. Segment by potential and fit - a territory with 200 low-fit accounts isn't better than one with 50 high-fit ones. We've seen teams triple their close rates by shrinking territories to only include accounts that match their ICP, rather than padding them with names that look good on a spreadsheet.
Step 3: Match Reps to Territories
Assign based on experience, existing relationships, and bandwidth. A senior rep with deep healthcare relationships shouldn't cover a fintech-heavy territory just because they live nearby. This sounds obvious. It happens constantly.
Step 4: Balance with Algorithms, Not Whiteboards
Manual territory planning achieves roughly 78.2% coverage. Algorithmic planning hits 91.4% - with 40.8% less travel distance. A 2020 study found computational methods increase effective sales visits by 14% and decrease travel by 17%.
Let's be honest: if you're still drawing territories by hand on a whiteboard, you're giving away coverage and burning travel budget for no reason.
Step 5: Validate Your Data Before Activation
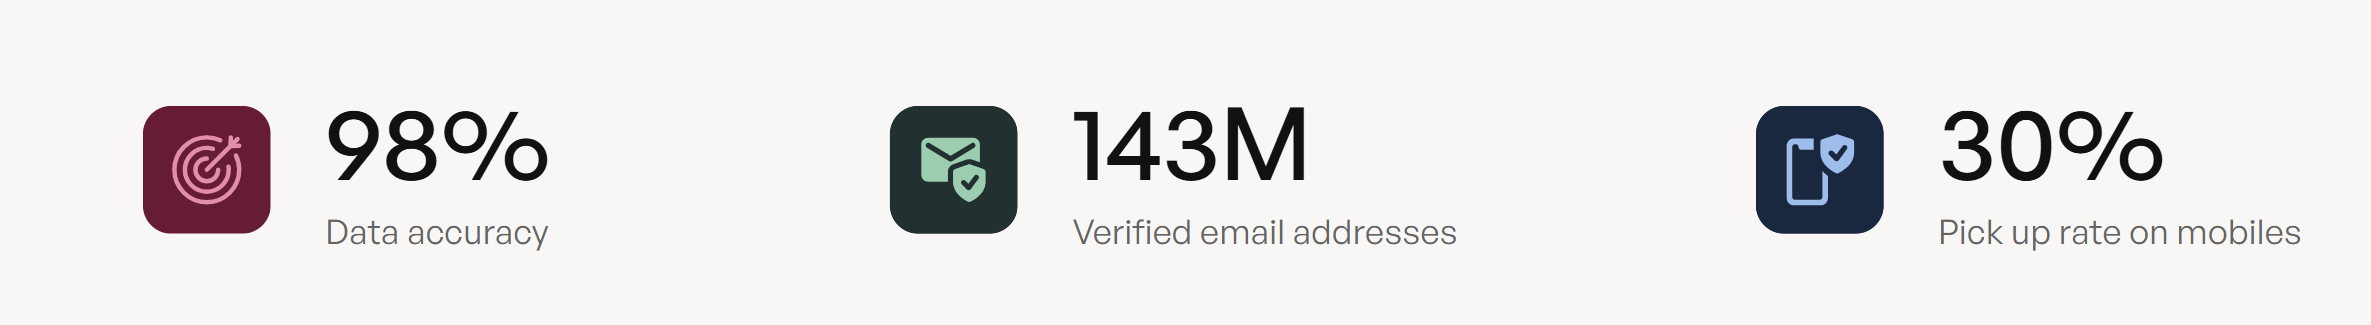
You've drawn perfect boundaries, balanced workloads, and assigned your best reps. Then they open their territory list and half the emails bounce. This is where most territory rollouts quietly fail - not at the strategy level, but at the data level. Prospeo's 98% email accuracy and 7-day refresh cycle keeps territory contact data current from day one. Use its 30+ search filters to build verified prospect lists within each territory so reps start working, not guessing.

You just balanced territories by potential, matched reps, and optimized routes. Don't let stale data undo all of it. Prospeo's 30+ search filters let you build verified prospect lists by ZIP code, industry, headcount, and buyer intent - with 98% email accuracy and a 7-day refresh cycle.
Stop handing reps territory lists full of dead emails.
The ROI of Getting It Right
Territory realignment alone can increase revenue by 2-7% without adding headcount. Optimized plans drive 10-20% higher productivity.

The case studies hit harder. Samsung achieved an $8.8M cost reduction and 50% more customer visits by optimizing territory coverage. Lobel Financial redesigned territories across 50+ field reps and quadrupled sales volume in eight months.
And the gap between average and great is staggering: outside reps average 5.1 visits per day, while the top decile hits 13.9. That's not a marginal difference - it's a completely different business.
Mistakes That Kill Territories
The #1 killer is static models that never get redrawn. We've watched teams run the same territory map for two years while the market shifted completely underneath them - new competitors entering regions, accounts churning, entire industries relocating.

Unfair workload distribution is the second biggest problem. Giving one rep Manhattan and another the Dakotas, then wondering why quota attainment varies, isn't a rep performance issue. It's a design failure. And redesigning territories without adjusting quotas creates instant fairness problems that drive rep attrition.
Here's the thing: most territory failures aren't strategy problems. They're maintenance problems. Treat territory design as a quarterly process aligned with QBRs - review QoQ growth, visits per rep, close rate, and new customer acquisition. Rebalance every quarter, or your territories decay faster than your data.
Territory Mapping Tools Compared
For Salesforce-native orgs, Salesforce Maps or Geopointe are the obvious picks. SMB field teams should look at Badger Maps or SPOTIO. For one-time mapping projects, Maptitude's perpetual license is hard to beat.
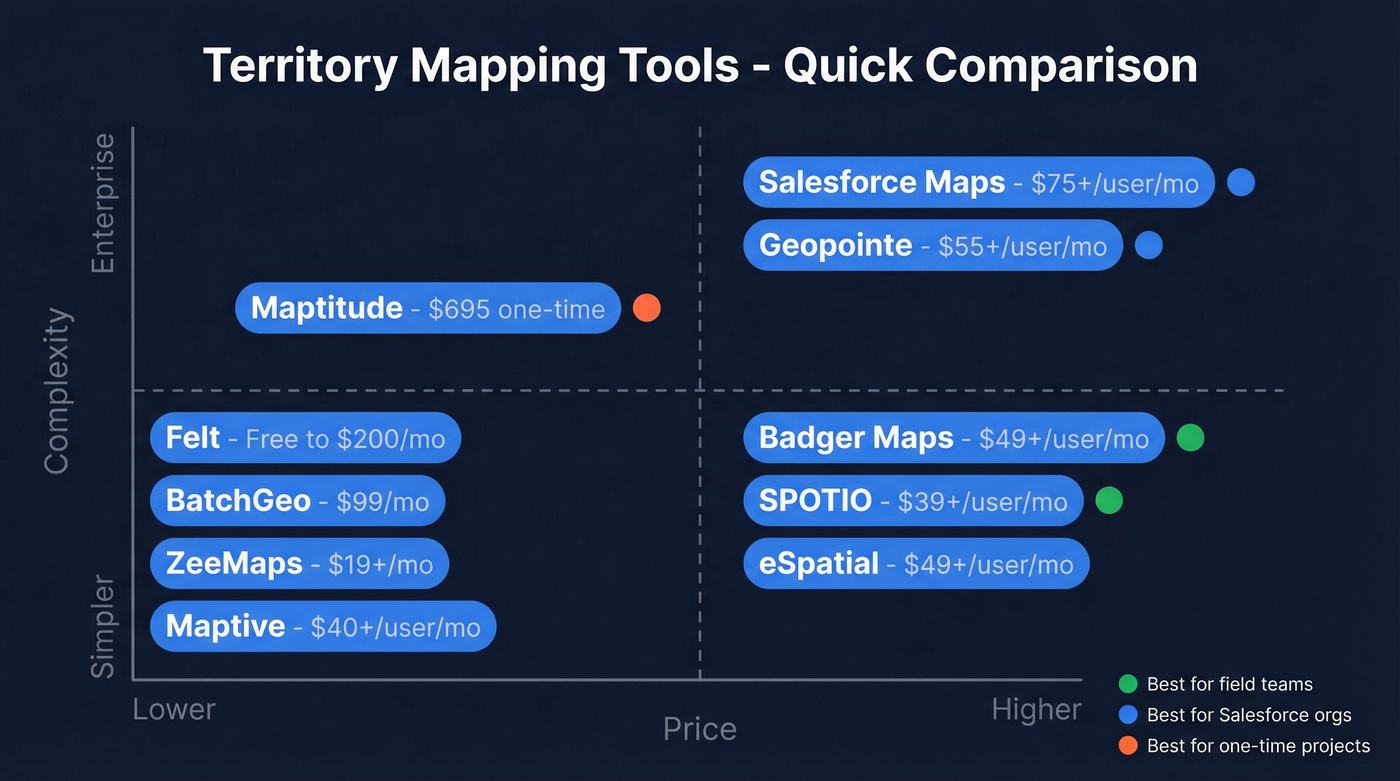
In our experience, the tool matters less than the discipline of actually using it quarterly.
| Tool | Starting Price | Best For |
|---|---|---|
| Salesforce Maps | $75+/user/mo | SFDC-native orgs |
| Geopointe | $55+/user/mo | SFDC territory analytics |
| Badger Maps | $49+/user/mo | Field sales routing |
| SPOTIO | $39+/user/mo | Field sales management |
| eSpatial | $49+/user/mo | Territory balancing |
| Maptive | $40+/user/mo | Visualization |
| Felt | Free-$200/mo | Collaborative mapping |
| BatchGeo | $99/mo | Spreadsheet-to-map |
| Maptitude | $695 one-time | GIS power users |
| ZeeMaps | $19+/mo | Lightweight mapping |
Keep Your Territory Data Fresh
Most territory guides spend 2,000 words on boundaries and zero on what actually makes geographic sales territories produce results - accurate contact data. A perfectly balanced territory is worthless if half the emails bounce. Quarterly rebalancing requires data enrichment, and Prospeo's CRM and CSV enrichment returns 50+ data points per contact at an 83% match rate, with a 7-day refresh cycle versus the 6-week industry average. That means territory data stays current between QBRs, not just on the day you load it.
If you're seeing bounce spikes, start with invalid emails and hard bounces, then run a proper CRM hygiene process. For teams that want a deeper benchmark view, B2B contact data decay is the underlying reason territory lists rot so fast.
Quarterly rebalancing means nothing if your contact data decays between cycles. Prospeo refreshes 300M+ profiles every 7 days - 6x faster than the industry average - so your geographic territories stay actionable, not just well-drawn.
Fresh territories deserve fresh data. Start at $0.01 per verified email.
FAQ
What's the best boundary method for geographic territories?
ZIP codes offer the strongest balance of granularity and data availability for most teams. Drive-time zones outperform ZIP codes for field-heavy orgs where travel burden matters more than administrative lines. Avoid state-level boundaries - they're too broad for balanced workloads.
How often should you rebalance territories?
Quarterly, aligned with QBRs. Review QoQ sales growth, visits per rep, close rate, and new customer acquisition each cycle. Static territories are the #1 reason geographic models fail - teams that rebalance quarterly see 10-20% higher productivity.
How does data quality affect territory performance?
Territory assignments are only as good as the contact data behind them. Stale emails and disconnected numbers waste 20-30% of a rep's week. Keeping territory accounts enriched with verified emails and direct dials on a regular refresh cycle means reps aren't burning days chasing dead contacts.
How is outside sales territory management different from inside sales?
Outside sales territory management puts far more weight on drive-time zones, route density, and visit frequency because reps physically travel between accounts. Inside sales territories rely more on firmographic or industry-based segmentation since travel cost isn't a factor. Algorithmic routing tools matter most for outside teams - the difference between 5.1 and 13.9 daily visits comes down to how well you've planned the routes, not how hard the rep works.