GRR vs NRR: The SaaS Metric Gap Nobody Talks About
A VP of Customer Success walks into a board meeting and presents 112% NRR. The room nods. Smiles, even. But buried three slides deep is the number nobody asks about: GRR at 82%. That means nearly a fifth of base revenue is evaporating every year - and the only reason the top-line looks healthy is because upsells are running fast enough to paper over the hole.
That GRR-NRR gap? It's the most important metric in the deck, and almost nobody's tracking it.
Quick Definitions
GRR (Gross Revenue Retention) measures how much recurring revenue you keep from existing customers, excluding any expansion. It's capped at 100%.
NRR (Net Revenue Retention) measures revenue from existing customers including expansion - upsells, cross-sells, price increases. It can exceed 100%.
The real insight isn't either number in isolation. It's the gap between them. A GRR-NRR spread wider than ~15 points is a red flag: your growth engine depends on expansion outrunning churn. That's a treadmill, not a flywheel.
If you can only track one, track GRR. It tells you whether your product actually retains customers. Then add NRR to understand your expansion engine.
Gross Revenue Retention Explained
GRR answers a simple question: if you stopped selling anything new to existing customers - no upsells, no cross-sells, no price increases - how much revenue would you keep?
The formula:
GRR = (Starting MRR - Churn - Contractions) / Starting MRR
Say you start the quarter with $1M in MRR. You lose $50K to churn and another $30K to downgrades. Your GRR is ($1,000,000 - $50,000 - $30,000) / $1,000,000 = 92%.
GRR is capped at 100% by definition - you can't "gross retain" more than you started with. That cap is what makes it so useful. There's nowhere to hide. No expansion revenue to mask a leaky bucket. A GRR of 95%+ signals strong product-market fit. Below ~88-90%, you've got a structural retention problem that no amount of upselling can sustainably fix.
Net Revenue Retention Explained
NRR takes the same starting point but adds expansion revenue back into the picture. Is your existing customer base growing or shrinking?
NRR = (Starting MRR + Expansion - Churn - Contractions) / Starting MRR
Using the same numbers: $1M starting MRR, $50K churn, $30K contractions, plus $120K in expansion revenue. NRR = ($1,000,000 + $120,000 - $50,000 - $30,000) / $1,000,000 = 104%.
NRR above 100% means your installed base generates more revenue over time without any new logos. That's the compounding engine investors love. Top-quartile SaaS companies regularly post NRR above 130%, meaning their existing customers alone drive 30%+ annual growth before a single new deal closes.
Side-by-Side Comparison
| Dimension | GRR | NRR |
|---|---|---|
| Formula | (Start - Churn - Contr.) / Start | (Start + Expand - Churn - Contr.) / Start |
| Includes expansion? | No | Yes |
| Theoretical cap | 100% | No fixed cap |
| Signals | Product stickiness | Growth from existing base |
| Who cares most | CS leaders, M&A buyers | Investors, board, growth team |
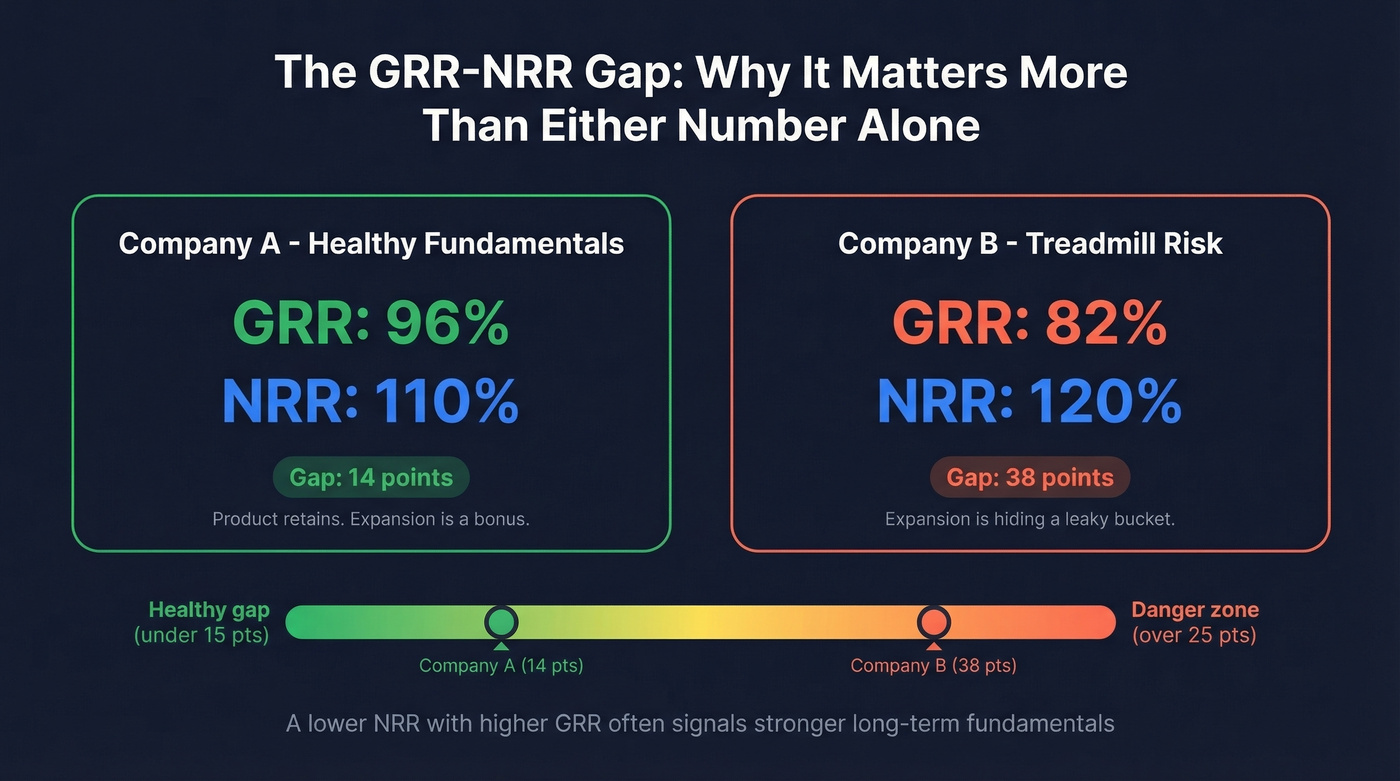
Here's the contrarian take most guides miss: the gap between these two metrics is itself a metric worth tracking. A company with 88% GRR and 115% NRR has a 27-point spread - expansion is doing heavy lifting to compensate for significant churn. Compare that to a company with 96% GRR and 110% NRR. Lower NRR, far healthier fundamentals. The gap tells you how dependent your growth story is on expansion offsetting losses.
A company with 95% GRR and 105% NRR will outlast a company with 82% GRR and 120% NRR every single time. The first company has a product people stay for. The second has a sales team running fast enough to hide the cracks - until they can't.
A leaky bucket isn't just a retention problem - it's a targeting problem. When your outbound reaches the wrong buyers, you close accounts that churn in 6 months and tank your GRR. Prospeo's 300M+ profiles with 30+ filters - buyer intent, technographics, headcount growth - let you target accounts that actually fit, so you close customers who expand instead of evaporate.
Better targeting means better GRR. Build your first list in 60 seconds.
Why Investors Obsess Over Retention
Retention metrics aren't just operational dashboards. They're valuation drivers with quantifiable premiums.
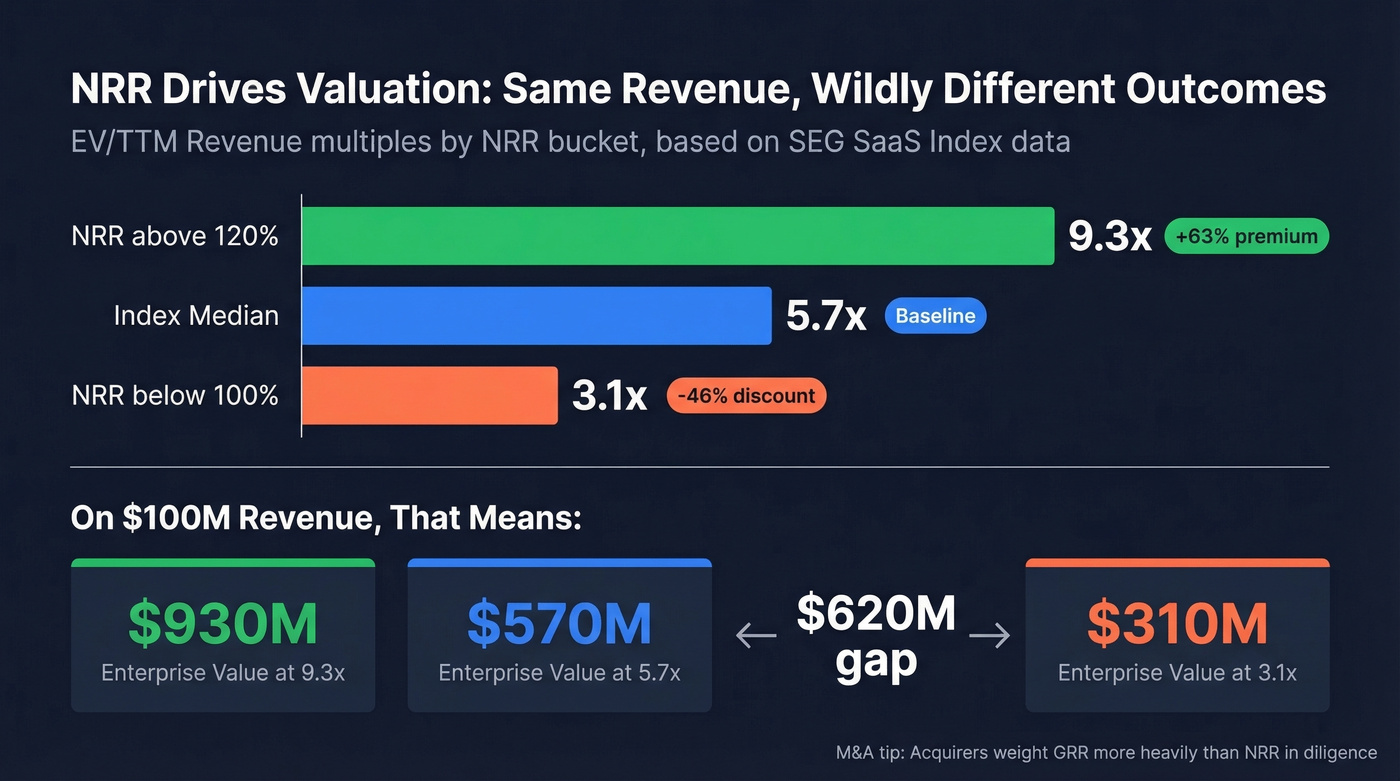
The SEG SaaS Index tracks 120+ public software companies and breaks down valuation multiples by NRR bucket. Companies with NRR above 120% trade at a median 9.3x EV/TTM revenue - a 63% premium over the index median of 5.7x. Companies with NRR below 100% trade at 3.1x, a 46% discount. On the same revenue base, that's the difference between a $500M and a $1.5B enterprise value.
But in M&A diligence, GRR gets weighted more heavily than NRR because acquirers know expansion can mask churn. A PE firm buying your company wants to know what happens to revenue if the expansion engine stalls for two quarters. GRR answers that question. NRR doesn't. From a diligence perspective, world-class means GRR ≥95% and NRR ≥115-120% at scale. "Solid mid-market SaaS" targets GRR ≥90% and NRR ≥105-110%.
In our experience, the diligence ask for segmented retention - by cohort, ACV band, and motion type - catches a lot of companies off guard. If you're prepping for a Series B and haven't been tracking these cuts, you're scrambling. Scrambling in diligence is how term sheets get repriced.
2026 Benchmarks by Segment
Every guide says "good NRR is above 100%." Compared to what? Your ACV band, your stage, your motion - context is everything.
NRR by ACV Band
| Segment | Median NRR |
|---|---|
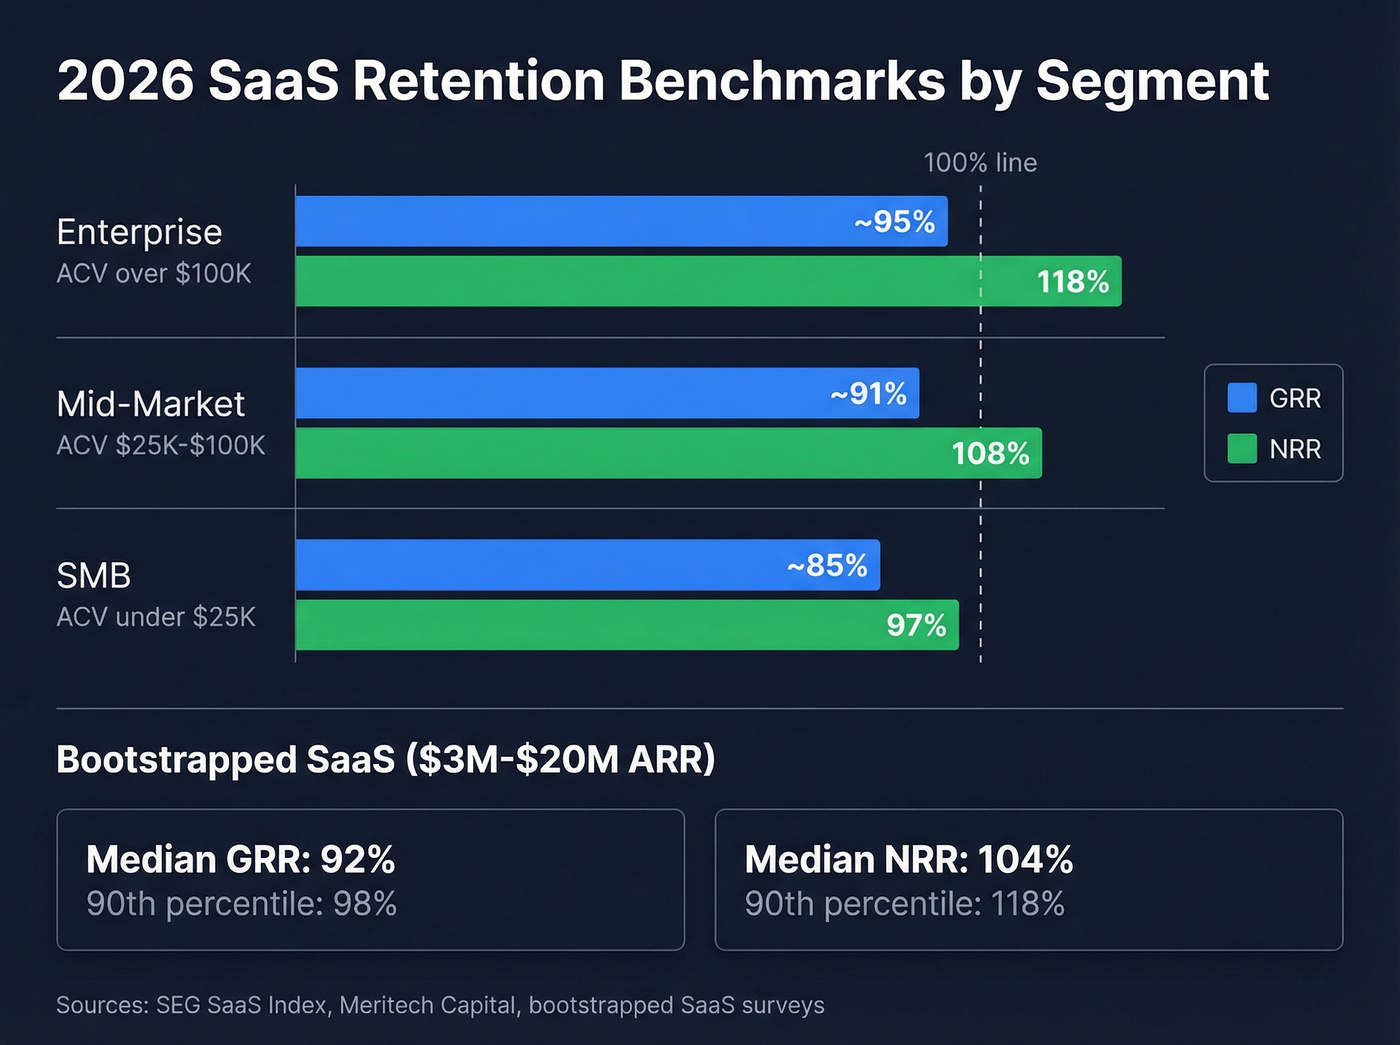
| Enterprise (ACV >$100K) | 118% |
| Mid-market ($25K-$100K) | 108% |
| SMB (<$25K) | 97% |
Enterprise accounts expand naturally - more seats, more modules, bigger contracts. SMB accounts churn faster and rarely upsell. If you're running 97% NRR on SMB deals, you're performing at median. Don't benchmark yourself against Datadog's 130%.
For private B2B SaaS in the $25K-$50K ACV range, median NRR sits at 102%, top quartile at 111%, bottom quartile at 97%.
Bootstrapped SaaS ($3M-$20M ARR)
Recent survey data from bootstrapped companies paints a realistic picture:
- Median NRR: 104% (90th percentile: 118%)
- Median GRR: 92% (90th percentile: 98%)
If you're bootstrapped and hitting 92% GRR, you're right at median. Getting to 98% puts you in the top 10%. That 6-point gap represents real money at scale - at $10M ARR, it's $600K annually.
Public Company Reference Points
Useful directional markers from Meritech Capital's SaaS data: Datadog at ~130% NRR. Veeva at ~120%. Slack at ~119%. ZoomInfo and Toast both ~115%. HubSpot ~103%. Zoom ~98%.
The macro trend matters too. Public SaaS median NDR peaked above 123% in the first half of 2022, then compressed to 108% by early 2025. The post-ZIRP hangover hit expansion budgets hard. If your NRR dropped since 2022, you're not alone - the entire market contracted.
The Diagnostic Matrix
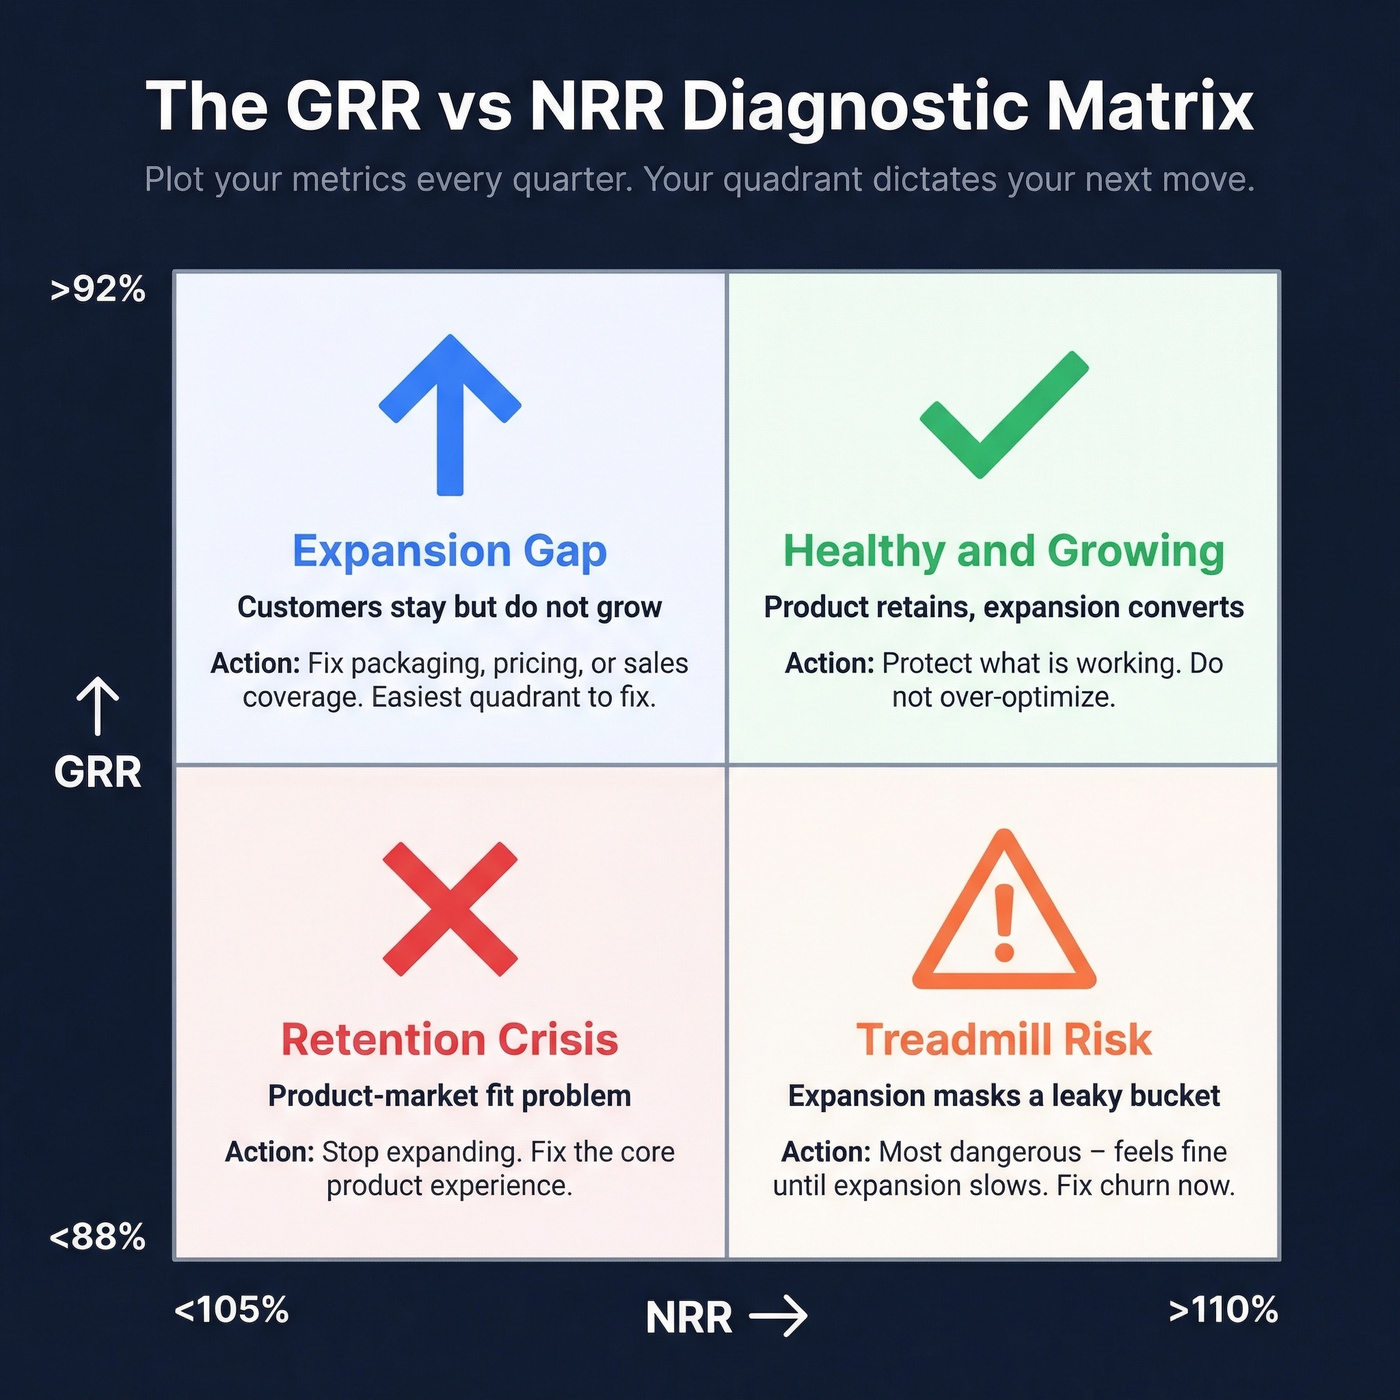
Plot your GRR and NRR on this matrix every quarter. The quadrant you're in dictates your next move.
| High NRR (>110%) | Low NRR (<105%) | |
|---|---|---|
| High GRR (>92%) | Healthy & growing | Retain well, expansion gap |
| Low GRR (<88%) | Treadmill risk | Retention crisis |
Healthy & growing (High GRR / High NRR): Protect what's working. Your product retains and your expansion motion converts. Don't break it by over-optimizing.
Retain well, expansion gap (High GRR / Low NRR): This is actually the easier fix. Your product retains well; you just haven't built the expansion motion yet. That's a packaging, pricing, or sales coverage problem - all solvable.
Treadmill risk (Low GRR / High NRR): The most dangerous quadrant because it feels fine. A company losing 20% of base revenue to churn while gaining 20% from expansion posts 100% NRR. Looks stable. But if expansion slows even slightly - a bad quarter, a budget freeze, a competitor entering your space - the churn underneath becomes immediately visible. We've seen this pattern tank companies that looked healthy on paper. If you're plotting into this quadrant, double-check your math first. It sometimes appears because price increases were accidentally included in GRR.
Retention crisis (Low GRR / Low NRR): Product-market fit or segment-fit issue. Stop expanding and fix the core product experience.
Let's add one more layer. High logo retention paired with low revenue retention means customers stay but downgrade - a pricing or adoption issue. Low logo retention paired with high revenue retention means small accounts churn while large accounts expand - a segment-fit problem that might actually be fine if you're moving upmarket deliberately.
Common Calculation Mistakes
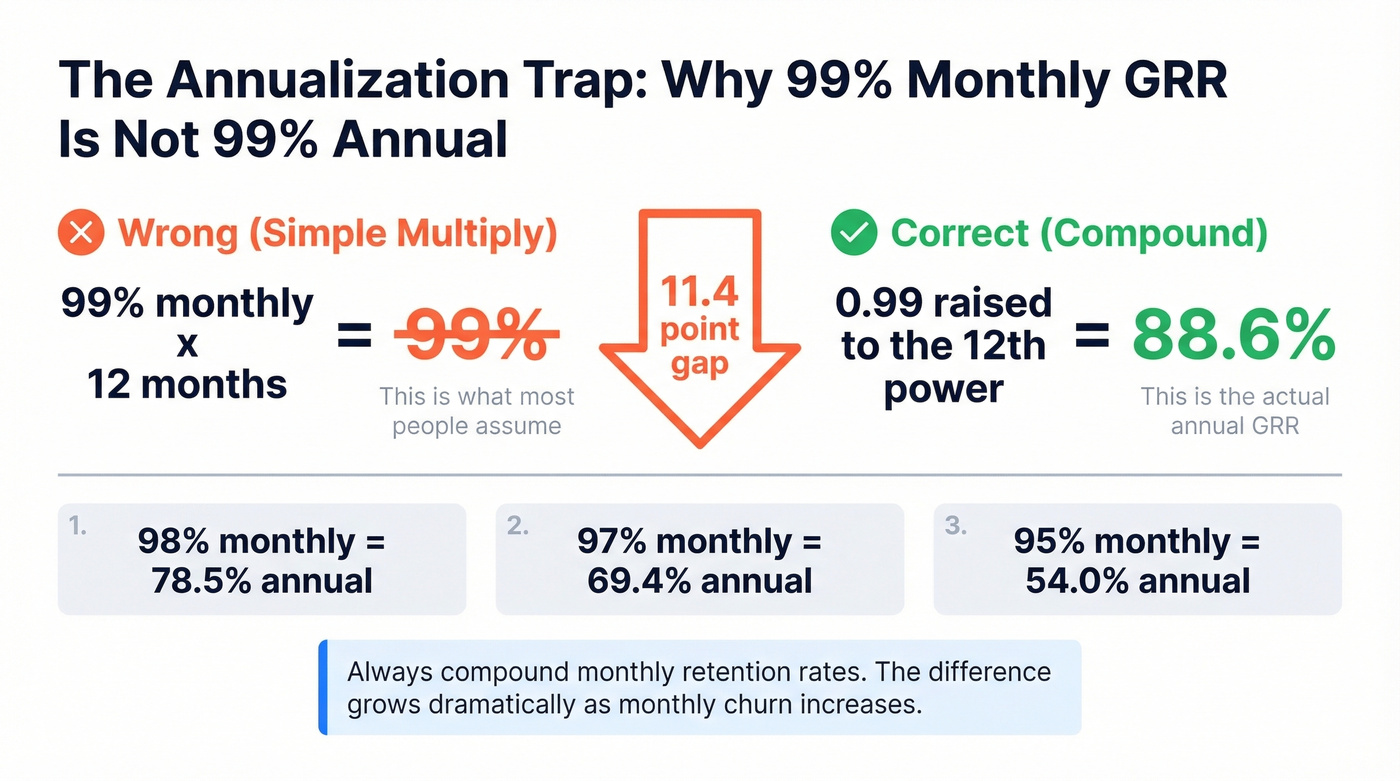
1. The annualization error. If you're annualizing monthly GRR by multiplying by 12, your board deck is wrong. A 99% monthly GRR compounds to roughly 88.6% annually (0.99^12 = 0.886). That's an 11-point gap from what "99% monthly" implies to a casual reader. Always compound: monthly rate raised to the 12th power.
2. Price increase treatment. This trips up even experienced finance teams. NRR includes price increases as expansion revenue. GRR excludes them - cap each customer's later-period MRR at their prior-period MRR when computing GRR. A 10% price hike on a $50K contract adds $5K to NRR but zero to GRR. A related confusion that shows up constantly in practitioner discussions: if a customer upgrades mid-year then downgrades later, measure GRR contraction against the starting-period MRR, not the post-upgrade MRR. A recent r/FPandA thread debated exactly this scenario, and the consensus was clear - anchor to period start.
3. Reactivation rules. A customer churns in March and comes back in June. That's a new acquisition, not retained revenue. Treat customers gone 30-90 days as new logos to avoid inflating retention numbers.
4. Usage-based models. Traditional MRR-based formulas break down with consumption pricing. Twilio compares Q1 revenue from the same customer set year-over-year and averages across quarters. Snowflake compares annual revenue for customers signed up more than a year ago. If you're running usage-based pricing, pick a methodology and document it - consistency matters more than perfection.
5. Cohort vs. aggregate. Cohort-based retention is the gold standard, but it requires enough logos per cohort to be statistically meaningful. If you're closing 3-5 enterprise deals per month, aggregate retention calculated annually is more reliable than noisy monthly cohorts.
How to Improve Both Metrics
Improving GRR
GRR improvement is fundamentally about reducing reasons to leave. Onboarding quality is one of the highest-leverage interventions - customers who don't activate properly churn at dramatically higher rates. Proactive CS investment, not reactive ticket resolution, catches at-risk accounts before they've mentally checked out. Product adoption tracking across feature usage, login frequency, and integration depth gives your CS team leading indicators instead of lagging ones.
Consistent execution on these fronts can yield 2-5% GRR improvement within six months. At $10M ARR, a 3-point GRR improvement is $300K in saved revenue annually.
Here's the thing: align CS comp to GRR, not just NRR. When CS teams are compensated on NRR alone, they push upsells on unhappy customers - which inflates expansion short-term and accelerates churn long-term. We've watched this play out at multiple portfolio companies. Tie at least half of CS variable comp to GRR to avoid this perverse incentive.
If you want a deeper breakdown of churn drivers and fixes, start with churn analysis and then pressure-test your math with a clean churn rate formula.
Improving NRR
NRR improvement requires a different muscle: expansion. The levers are upsell signals like usage thresholds and feature adoption milestones, packaging and tier design that creates natural upgrade paths, and health-score-driven expansion motions that time the ask correctly.
Multi-threading into new buying centers within existing accounts is one of the most underused expansion strategies. Your champion in engineering bought the platform - but the marketing team, the data team, and the ops team all have budgets and overlapping use cases. The problem is you can't expand into departments you can't reach. Finding the right stakeholders - department heads, budget holders, new decision-makers - requires accurate contact data. Tools like Prospeo make this practical by surfacing verified emails and direct dials across existing accounts, so CS and AE teams can identify expansion contacts without burning their domain on bad data. Teams typically target NRR of 105-120% depending on ACV band, and multi-threading is how the best teams consistently hit the upper end.
This expansion motion is basically land and expand done with discipline, and it gets easier when you treat the account like a mapped buying group (see account mapping).
If you need a dedicated reference on the metric itself (benchmarks + pitfalls), use our Net Revenue Retention guide.
Your NRR depends on reaching decision-makers inside existing accounts - the VP who controls the budget expansion, the new hire who signals department growth. Prospeo tracks job changes and department headcount shifts across 300M+ profiles, refreshed every 7 days. That's how you spot upsell signals before your competitors do.
Stop guessing which accounts are ready to expand. Start knowing.
FAQ
What's a good GRR for SaaS?
World-class gross revenue retention is ≥95%. Solid mid-market SaaS targets ≥90%. Below ~88% signals a churn problem that expansion can't sustainably offset. Always benchmark against your ACV band - an SMB company at 90% GRR outperforms an enterprise company at 90% GRR relative to their respective medians.
Can NRR exceed 100%?
Yes. NRR exceeds 100% when expansion revenue from upsells, cross-sells, and price increases outweighs churn and contractions. Top-quartile SaaS companies regularly post NRR above 130%. GRR, by contrast, is capped at 100% because it excludes all expansion.
What's the difference between NRR and NDR?
None. Net revenue retention and net dollar retention are the same metric with different names. NDR appears more often in public company filings and earnings calls. NRR is more common in SaaS operating contexts and board decks. Use whichever your stakeholders expect.
How often should I measure retention?
Calculate monthly, report to the board quarterly. Use the diagnostic matrix each quarter to identify which quadrant you're in and adjust CS and expansion strategy accordingly. Segment by ACV band and cohort for the clearest signal - aggregate numbers hide important variation.
How do you find contacts for account expansion?
Multi-threading into new buying centers requires verified contact data for department heads and budget holders you haven't engaged yet. A B2B data platform with strong email accuracy and direct dial coverage lets your team reach expansion contacts at scale without risking deliverability on bad data.