How to Calculate Inbox Placement Rate - And Actually Measure It
Your ESP says 98% delivered. Half your emails are in spam. That gap is the whole problem.
Most teams obsess over delivery rate, and roughly 87% of senders aren't even using inbox placement reports. They're flying blind. Whether you're running marketing campaigns or troubleshooting cold email deliverability, the blind spot is the same: "delivered" doesn't mean "seen."
Delivery Rate vs. Inbox Placement Rate
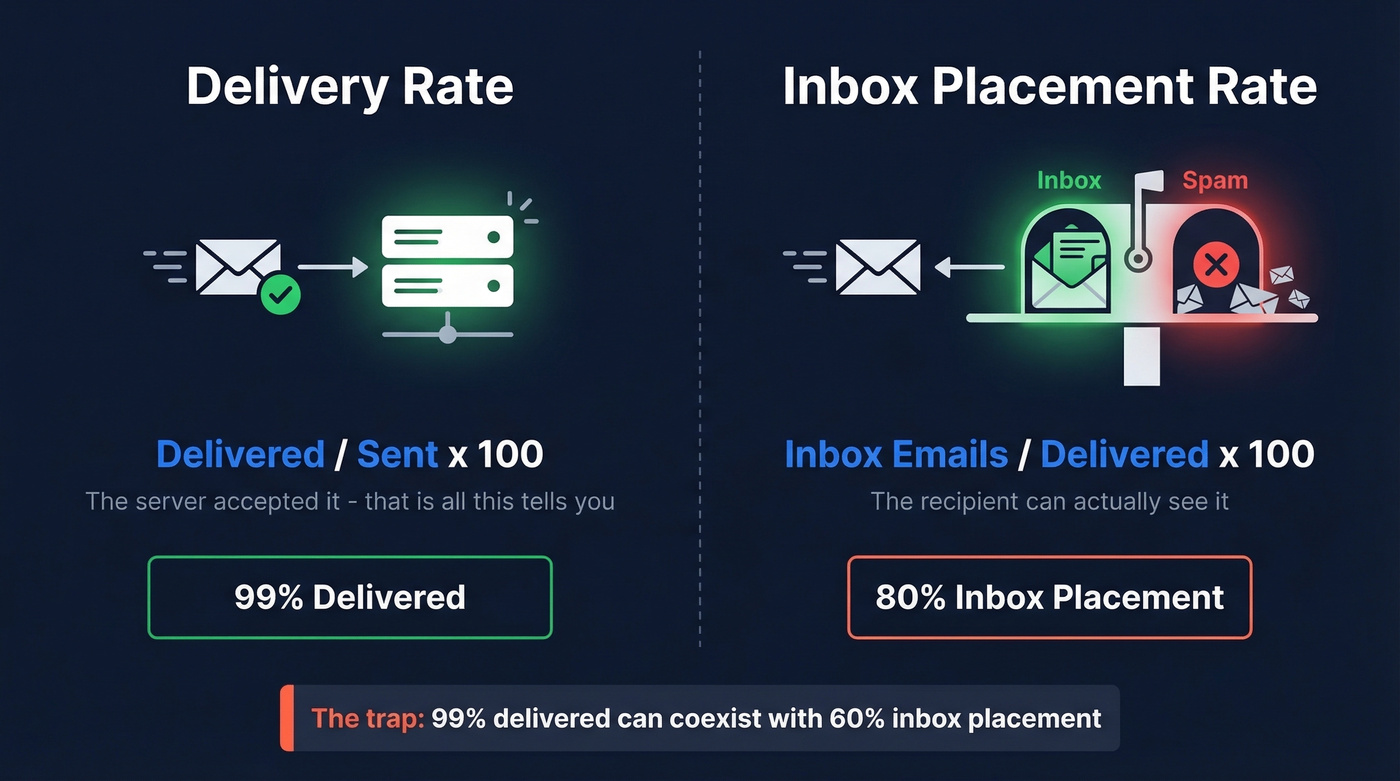
Delivery rate means the receiving server accepted the message. Inbox placement rate means the recipient can actually see it. One nuance worth calling out: most practitioners count Gmail Primary and Promotions as inbox placement. Tabs are fine. Spam isn't.
| Metric | Formula | What It Tells You |
|---|---|---|
| Delivery Rate | Delivered / Sent x 100 | Server accepted it |
| Inbox Placement Rate | Inbox emails / Delivered x 100 | Recipient can see it |
A 99% delivery rate can coexist with 60% inbox placement. That's the trap - and it's especially common in B2B, where corporate filters add another layer of unpredictability on top of the usual ISP filtering.
The Formula Most Guides Get Wrong
Use delivered as the denominator, not "sent":
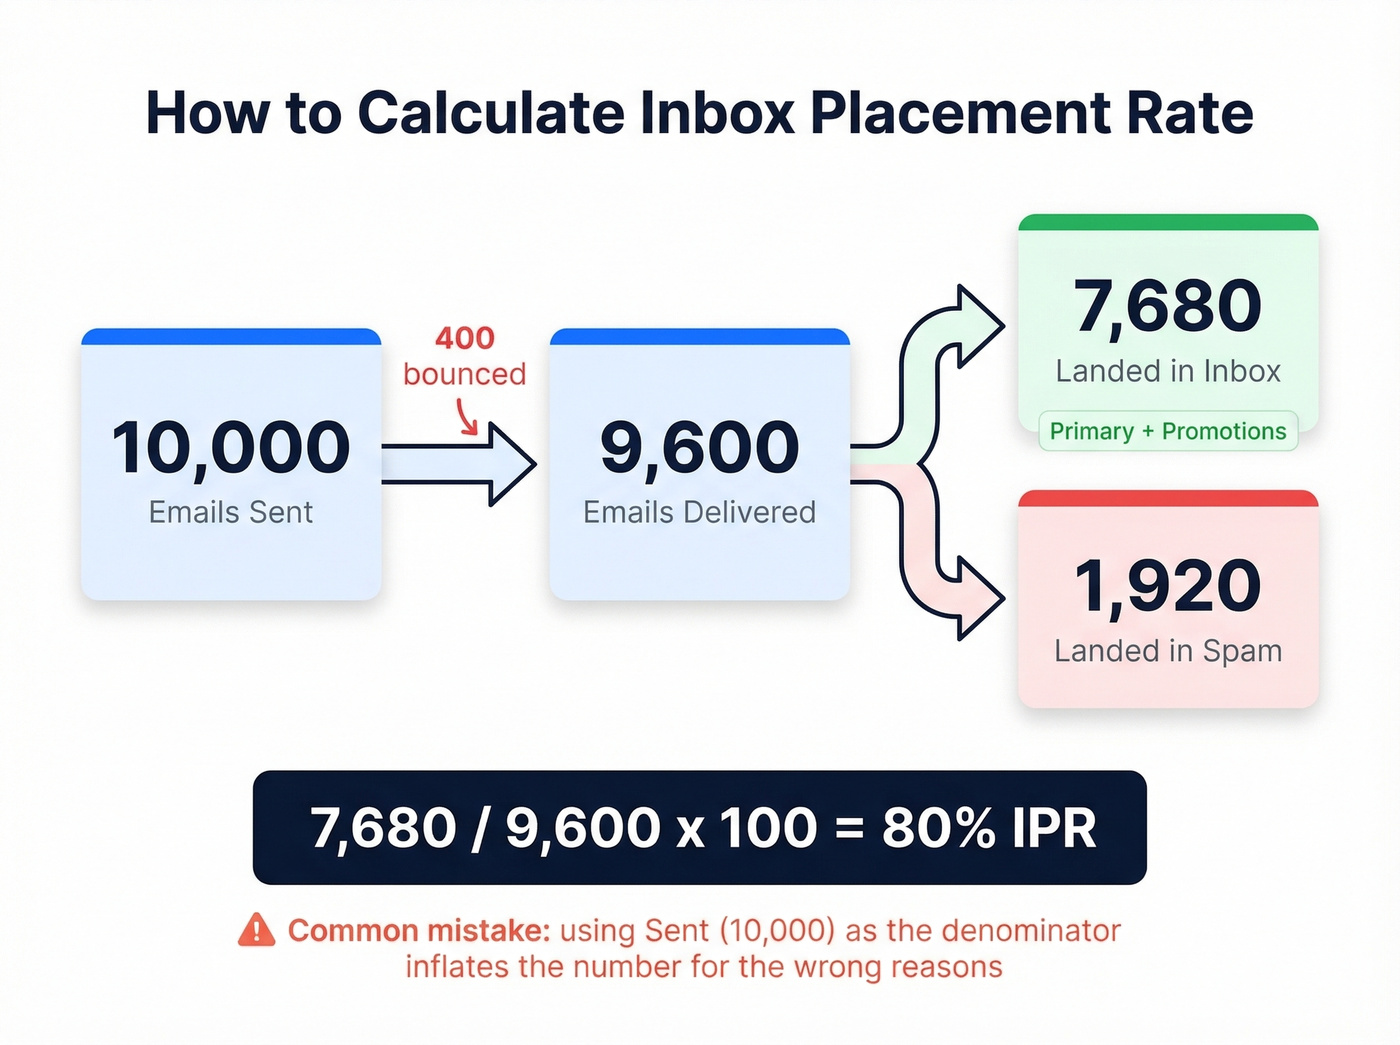
Inbox Placement Rate = (Emails in Inbox / Emails Delivered) x 100
Example: you send 10,000 emails. 400 bounce, leaving 9,600 delivered. Of those, 7,680 land in inbox (Primary or Promotions) and 1,920 land in spam. IPR = 7,680 / 9,600 x 100 = 80%.
A lot of dashboards use "sent" in the denominator instead. That hides the real issue because bounced messages never had a chance to land anywhere - they inflate the number and make placement look worse than it is for the wrong reasons. Mailjet's deliverability breakdown makes the sequence clear: acceptance happens first, placement happens after.
If you want to go deeper on the mechanics behind this, our email deliverability guide breaks down the levers that actually move placement.
Every bounced email chips away at your sender reputation - and your inbox placement rate drops with it. Prospeo's 5-step verification catches spam traps, honeypots, and catch-all domains before you hit send. Teams using Prospeo-verified data consistently keep bounce rates under 4%.
Fix your placement rate at the source - start with cleaner data.
How to Measure Placement in Real Life
Here's the thing: most ESPs can't reliably tell you which folder your email landed in across different mailbox providers. You measure it by triangulating signals, because each signal lies in a different way.
Seed List Testing
Seed List Testing is the closest thing to a direct read. You send to a set of test addresses controlled by a deliverability tool, and it reports whether each one hit Inbox, Spam, or went Missing entirely.
GlockApps is a solid, accessible option. Their Essential plan runs about $59/month with 360 test credits, and they also check against 50+ blacklists - genuinely useful when placement suddenly tanks. For B2B senders, keep your expectations calibrated: most seed networks skew consumer, so a cold email placement test won't perfectly mirror corporate gateway filtering.
Seed tests are the fastest way to catch a deliverability fire early. But they're still a lab environment, not your real audience.
Google Postmaster Tools (Free, Limited)
Google Postmaster Tools is free and worth setting up today. Verify your sending domain via a DNS TXT record, and you'll see data once you have enough Gmail volume - think 100+ messages per day to unique Gmail recipients.
In late 2025, Google retired the older Postmaster Tools (v1) interface and removed the IP Reputation and Domain Reputation dashboards. What matters now is Compliance Status (SPF, DKIM, DMARC, TLS, one-click unsubscribe) and Spam Rate, calculated as user-reported spam divided by emails delivered to the inbox.
The catch: Postmaster Tools doesn't show "Primary vs. Promotions vs. Spam." It shows complaints and compliance. That's still critical - compliance failures can lead to outright rejection - but it's not folder-level placement data.
If you’re troubleshooting auth issues, start with DMARC alignment and confirm your setup with a quick DKIM check.
A Multi-Signal Framework
No single tool gives you the full picture. Here's the stack we've found gives you a number you can actually trust:
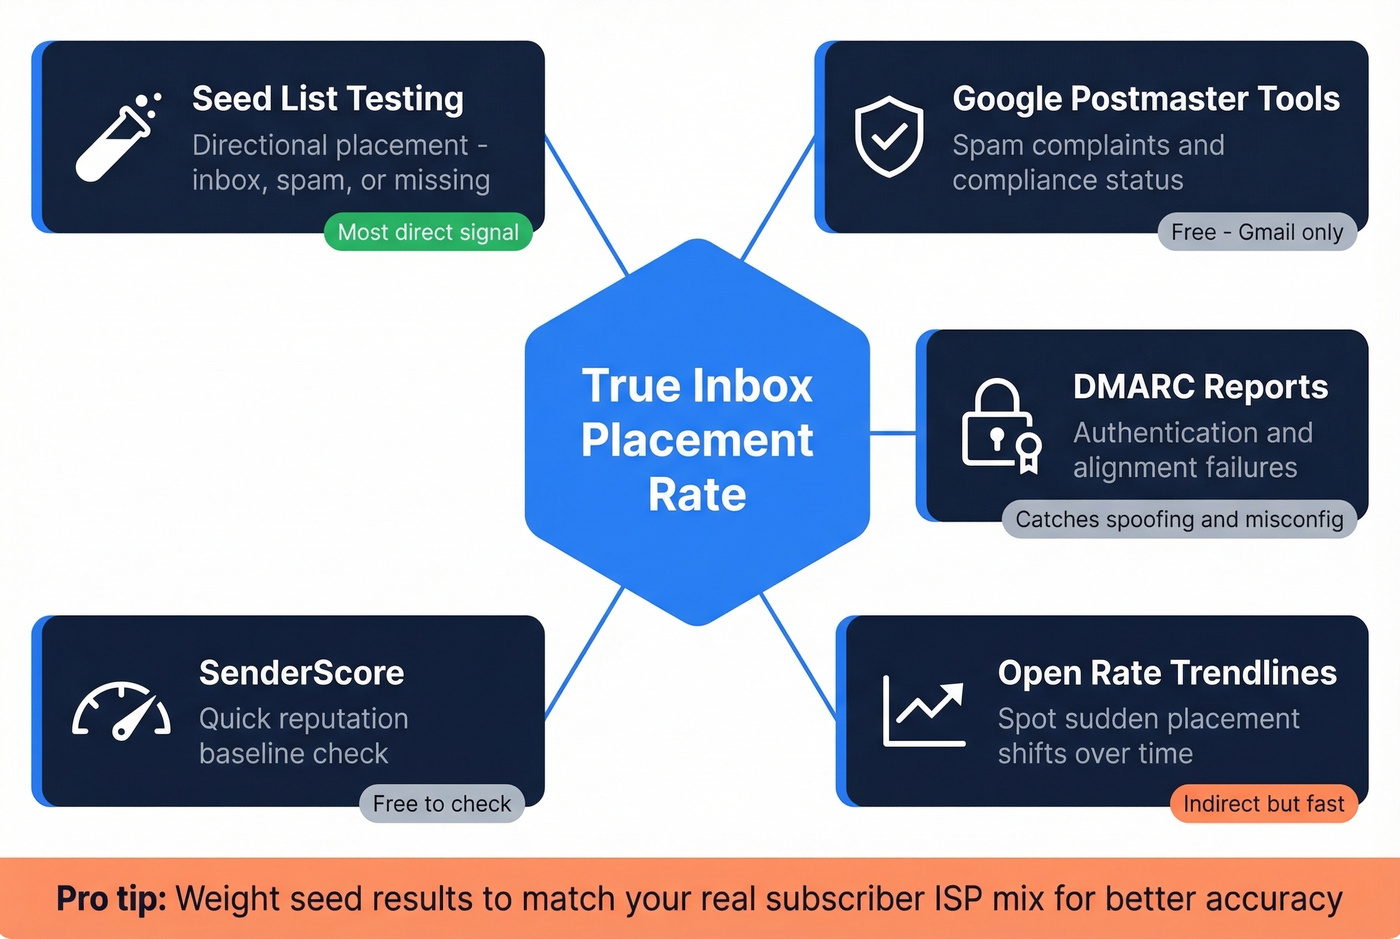
- Seed tests for directional placement (inbox/spam/missing)
- Google Postmaster Tools for complaints and compliance
- DMARC reports to catch authentication and alignment failures
- Open-rate trendlines to spot sudden placement shifts
- SenderScore as a quick reputation baseline (free to check)
For more accuracy, weight seed results to match your real subscriber ISP mix. Raw seed placement treats every provider equally, which almost never matches your actual list.
To monitor the other half of the equation, track your email bounce rate and keep an eye on email velocity as you ramp volume.
Why Inbox Placement Tools Disagree
Tool disagreement is normal, not a fluke.
On Reddit, people have shared cases where GMass's tester flagged spam while Warmup Inbox showed Primary for the same domain on the same day. Another thread shows Instantly reporting "98% deliverability" while GlockApps showed placement under 30% for the identical sending setup. We've seen this firsthand - teams celebrating a "high deliverability score" while their reply rates fell off a cliff. The score didn't change; placement did.
Different seed pools, different mailbox mixes, different definitions. And outreach platforms often use "deliverability" to mean "not bounced." That's acceptance, not placement. If your landing-in-inbox rate seems high on one tool and terrible on another, this mismatch in definitions is almost always why.
If you’re using GMass specifically, this companion guide on GMass email deliverability can help you reconcile tool readouts with real-world results.
How to Fix Inbox Placement
Get authentication perfect. SPF, DKIM, and DMARC alignment are table stakes. If Google flags compliance issues, you're fighting with one hand tied behind your back.
Keep spam complaints under 0.1%. The 0.1-0.3% range is the danger zone. Hit 0.3% and providers treat you like a spammer. There's no negotiating with that threshold.
Send to people who engage. Engagement is the filter. Dead lists train algorithms to bury you, so prune aggressively - even if it hurts to shrink the list.
Clean lists before you send. This isn't a quarterly chore. Make it part of every campaign launch. Bad addresses create bounces, bounces damage reputation, and reputation decides placement. Prospeo's 5-step verification process - including catch-all handling, spam-trap removal, and honeypot filtering - delivers 98% email accuracy, stopping that chain reaction before it starts. Stack Optimize scaled to $1M ARR while keeping client deliverability at 94%+ and bounce rates under 3% using Prospeo-verified data.
If you’re building lists from scratch, how to generate an email list and name to email are good starting points.
Test before scaling. Run a seed test on a small batch, review the results, adjust your content or sending patterns, and only then ramp volume. Iterative testing is the only reliable path to sustained inbox placement.
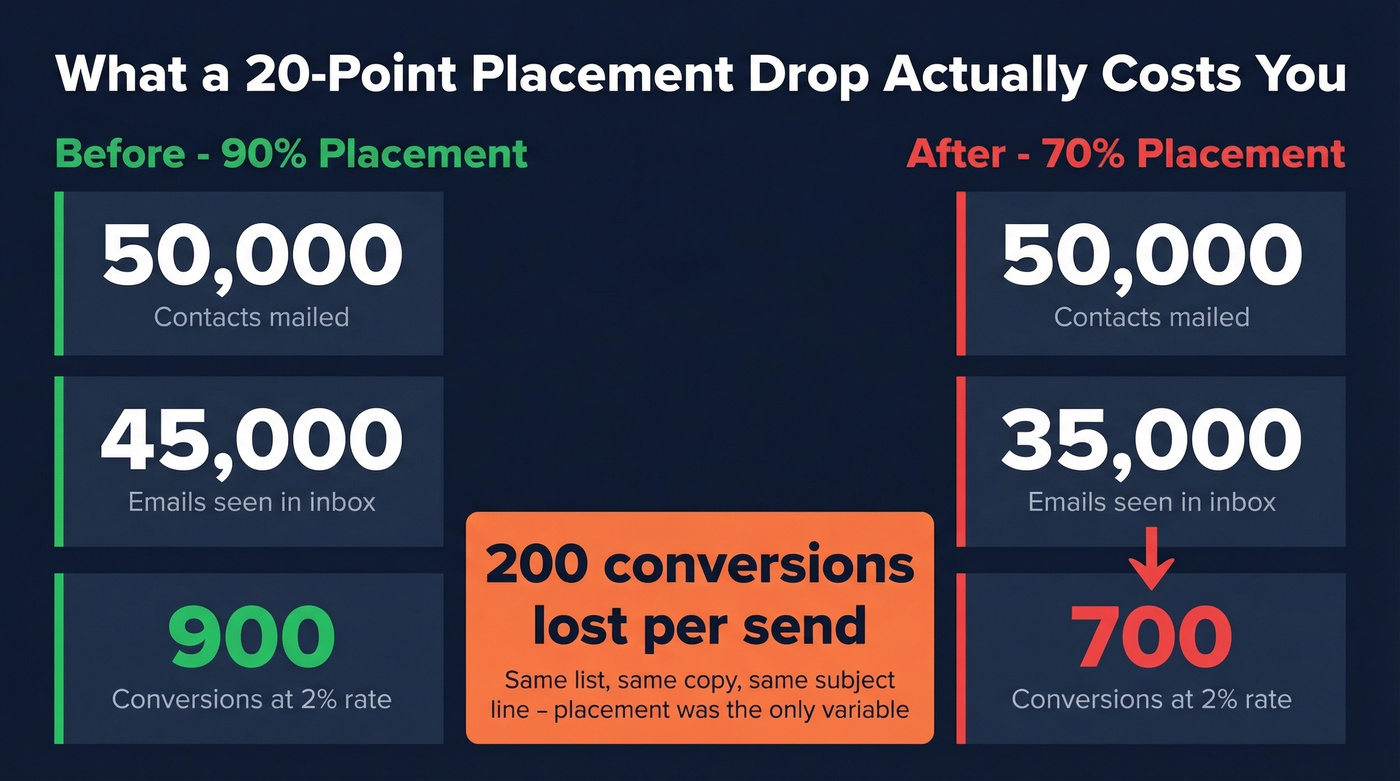
Let's put a number on the business impact. If you mail 50,000 contacts and placement drops from 90% to 70%, that's 10,000 fewer people seeing your email. At a 2% conversion rate, you just lost 200 conversions per send - before you even argue about copy or subject lines.

You just saw the math: a 20-point drop in inbox placement costs you 200 conversions per 50K send. Prospeo delivers 98% email accuracy at ~$0.01/email with data refreshed every 7 days - not the 6-week industry average that lets bad addresses pile up between sends.
Stop sending to addresses that destroy your reputation.
FAQ
How do you calculate inbox placement rate?
Divide the number of emails that landed in the inbox (Primary or Promotions tabs) by the number of emails delivered, then multiply by 100. Use "delivered" as the denominator - not "sent" - because bounced messages never had a chance to be placed. Example: 7,680 inboxed / 9,600 delivered = 80% IPR.
What's a good inbox placement rate?
80% or higher is considered good, and 90%+ is strong. Below 70% warrants immediate investigation - start with authentication compliance, spam complaint rate, and bounce rate. B2B senders often see lower baselines due to stricter corporate gateway filtering.
Is inbox placement the same as delivery rate?
No. Delivery rate measures server acceptance; inbox placement measures whether the recipient can actually see the email. You can have 99% delivered and still land mostly in spam. The two metrics answer fundamentally different questions.
How do I reduce bounces that hurt placement?
Verify addresses before every send, remove role accounts and obvious bad data, and stop hammering inactive segments. A verification process that handles catch-all domains, spam traps, and honeypots is essential - without it, you're guessing which addresses are safe to send to.
Does video email affect inbox placement?
Most mailbox providers strip embedded video, so senders typically use a thumbnail image linking to a hosted video. The real risk is that image-heavy emails with minimal text can trigger spam filters. Balance your media-to-text ratio and test placement before scaling any video email campaign.