How to Improve Sales Operations: The Data-Backed Playbook
A Fortune 100 VP once told his team: "If you want to improve sales, improve operations." Twenty years later, a single operational failure from that era - a botched delivery - had moved a major customer from the "good quote list" to the "last resort quote list." Estimated cost: $1-4M in lost revenue from one relationship. That's what broken sales ops does. It doesn't just lose deals. It erodes relationships that never recover.
The numbers confirm it. 69% of reps fell short of quota in recent years, and Forrester pegs average B2B quota attainment at roughly 47%. Meanwhile, 17% of reps still generate 81% of revenue. The gap between functional and dysfunctional sales ops isn't incremental - it's the difference between a team that scales and one that stalls.
Here's the framework, compressed:
- Audit - Map your data quality, pipeline definitions, tool stack, and win/loss patterns.
- Fix the foundation - Clean your data first, consolidate tools, standardize processes.
- Automate and optimize - Shift from activity metrics to outcome metrics. Let AI handle the repetitive work.
- Measure and iterate - Track the KPIs that matter. Review quarterly.
Now, the contrarian take nobody wants to hear: fix your data before buying AI. Every AI tool amplifies whatever you feed it. Garbage in, confidently wrong garbage out.
Three Root Causes of Ops Failure
Your Data Is Worse Than You Think
70% of sales organizations don't have a data strategy, per Korn Ferry research. And 73% of B2B buyers actively avoid sellers who send irrelevant outreach. That's the real cost of dirty data - it's not just bounced emails, it's prospects who mentally blacklist you before you ever get a conversation.
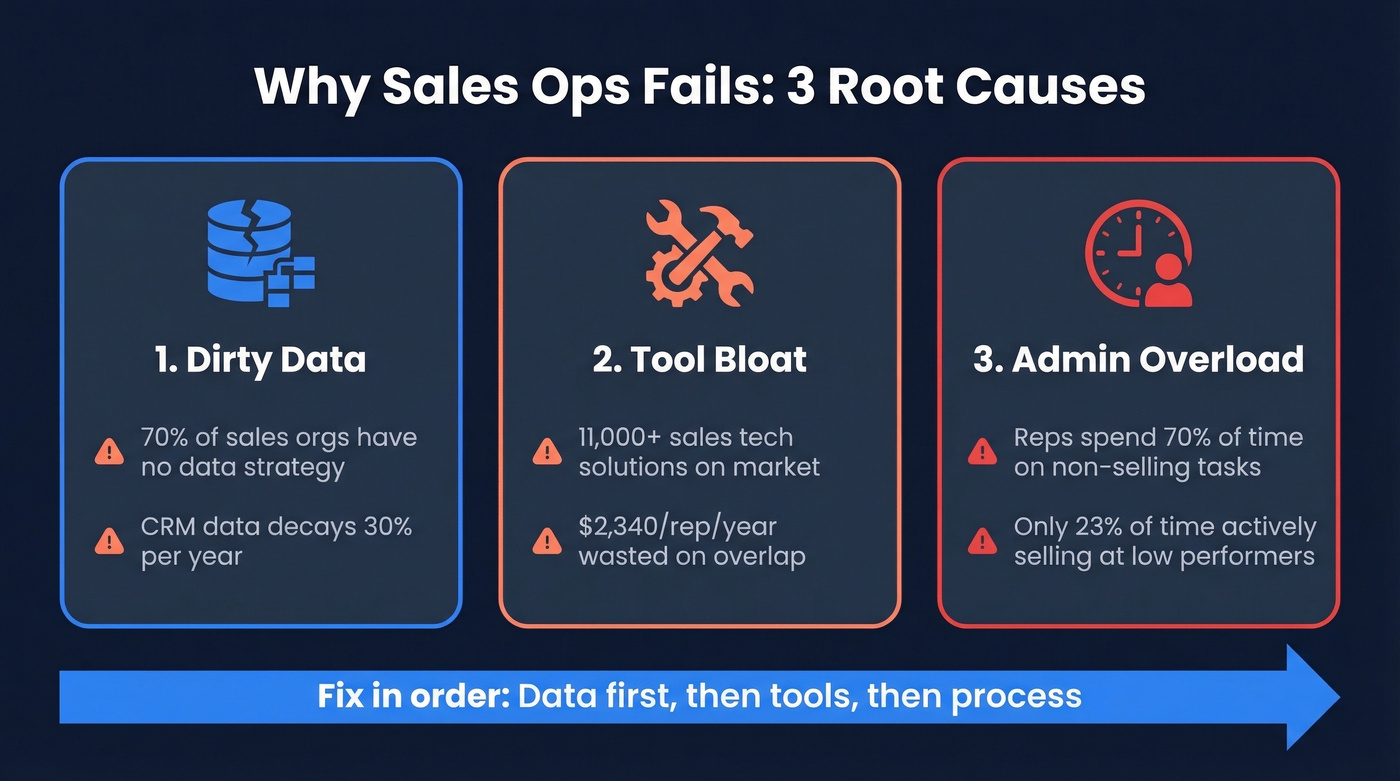
Industry estimates put CRM data decay at roughly 30% per year. People change jobs, companies merge, emails go stale. If you haven't enriched or verified your database in six months, a meaningful chunk of it is already wrong. In our experience, most teams discover the damage is worse than they expected once they actually run the audit.
Too Many Tools, Zero Integration
There are now over 11,000 sales technology solutions on the market. The average sales tech stack runs 8.3 tools at $187/rep/month - that's $2,244/rep/year - and 73% of teams report tool overlap wasting an additional $2,340/rep/year. Only 28.4% of organizations have actually integrated their sales applications with their CRM.
Jake Spear, a senior sales ops manager, put it bluntly: "The biggest headache for someone in sales operations is managing multiple tools that don't integrate well. At my last company, I used four different tools for something I now do in one platform." We've heard variations of that story from dozens of ops leaders. The tool sprawl problem is universal.
Ops Buried in Admin, Not Strategy
Reps spend 70% of their time on non-selling tasks, per Salesforce's State of Sales. High-performing orgs get 34% of sales time spent actively selling versus 23% at lower-performing ones. That 11-point gap is the difference between a team that hits quota and one that doesn't.
The second most common sales ops mistake, per MarketStar's research, is burying ops teams in comp administration and exception management instead of strategic work. When your ops team spends all day fixing spreadsheets, nobody's optimizing the machine.
Let's be honest about where most teams actually land:
| Metric | Struggling | Average | Best-in-Class |
|---|---|---|---|
| Quota attainment | <35% | 47% | 70%+ |
| Rep selling time | 23% | 30% | 34%+ |
| Forecast accuracy | <50% | 70% | 90%+ |
| Email bounce rate | 15%+ | 8-10% | <5% |
| Tool overlap waste | $2,340/rep/yr | $2,340/rep/yr | Near zero |
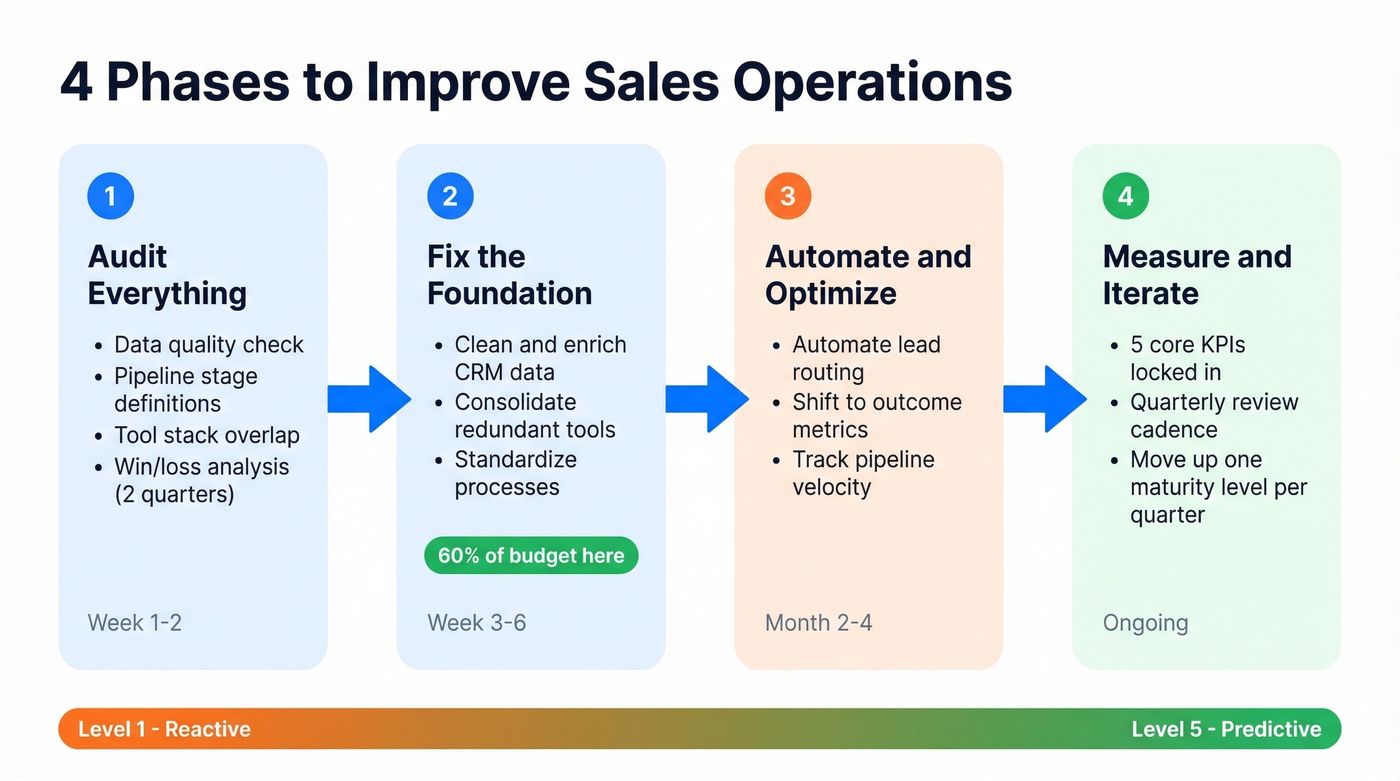
4 Phases to Improve Sales Operations
Phase 1 - Audit Everything
You can't fix what you haven't measured. Run four audits in parallel: data quality (how many contacts bounce? how many have missing fields?), pipeline stage definitions (do your reps agree on what "qualified" means?), tool stack overlap (what's redundant? what's unused?), and win/loss analysis covering the last two quarters.
Only 25.9% of sales organizations think they have the right tools to support their team. Three out of four teams already suspect their stack is wrong. The audit confirms it and gives you the ammunition to act.
Phase 2 - Fix the Foundation
Data quality comes first. Not process redesign, not AI, not a new CRM. Data. Everything downstream - forecasting, lead scoring, personalization, routing - depends on accurate contact and account information, and if that layer is rotten, nothing built on top of it will hold.
For the data layer specifically, Prospeo runs a 7-day refresh cycle where the industry average sits at six weeks, delivers 98% email accuracy, and returns 50+ data points per enrichment. It plugs natively into Salesforce and HubSpot, so enrichment happens inside your existing workflow rather than as a bolt-on process. When Snyk rolled this out across 50 AEs, their bounce rate dropped from 35-40% to under 5%, and AE-sourced pipeline jumped 180%.

After data, consolidate tools. Map every tool to a specific workflow. If two tools do the same thing, kill one. That $2,340/rep/year in overlap waste is real money - allocate roughly 60% of your improvement budget to foundational fixes like these, and 40% to quick wins that build momentum.
Phase 3 - Automate and Optimize
Once your foundation is clean, automation actually works. McKinsey found that top-performing B2B orgs have freed up about 20% of seller capacity through automation alone. OpenPhone improved speed-to-lead by 67% just by automating their routing workflow.
Stop tracking calls made and emails sent. Start tracking pipeline velocity, win rate, customer lifetime value, and churn.
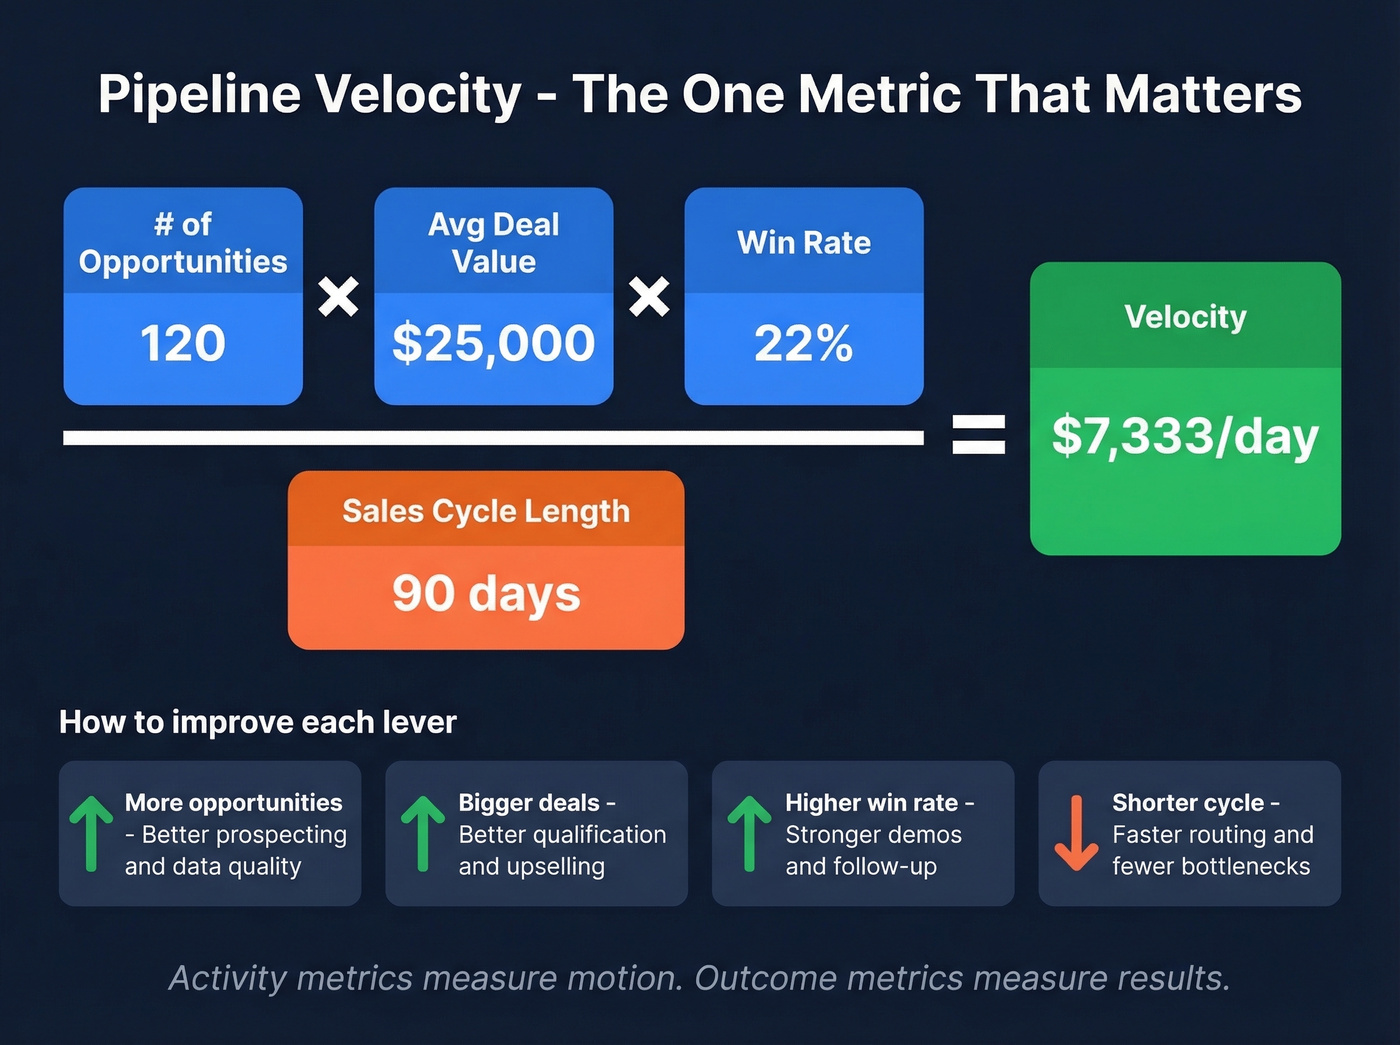
Pipeline velocity formula (bookmark this):
Pipeline Velocity = (# Opportunities x Avg Deal Value x Win Rate) / Sales Cycle Length
This single metric tells you more about your sales engine's health than any activity dashboard. If velocity drops, you know exactly which lever to pull - number of opportunities, deal size, close rate, or cycle length. Activity metrics measure motion. Outcome metrics measure results. That distinction is the core of sales management that works, and leaders who obsess over outcomes build teams that consistently outperform.
Phase 4 - Measure and Iterate
Lock in five KPIs: forecast accuracy, win rate, quota attainment, pipeline velocity, and rep ramp time. Review them quarterly - not annually, not "when we get around to it."
Subskribe's maturity model maps this well: Level 1 orgs are reactive and manual, Level 5 orgs run predictive analytics with continuous optimization. Most teams sit at Level 2 or 3. The goal isn't to leap to Level 5 overnight. It's to move one level per quarter with documented improvements at each stage. Small, compounding gains beat big-bang transformations almost every time.
CRM data decays 30% per year. Prospeo's 7-day refresh cycle keeps your database current while the industry waits 6 weeks. With 98% email accuracy and 50+ data points per enrichment, your reps stop wasting time on dead contacts and start selling.
Snyk dropped bounce rates from 35% to under 5% and grew pipeline 180%.
AI in Sales Ops - What Actually Works
54% of sales organizations are already deploying AI agents across the sales cycle, and reps who partner with AI tools are 3.7x more likely to meet quota. Gong Labs analyzed 1M+ sales opportunities and found that sellers who complete AI-recommended actions increase win rates by 50%.
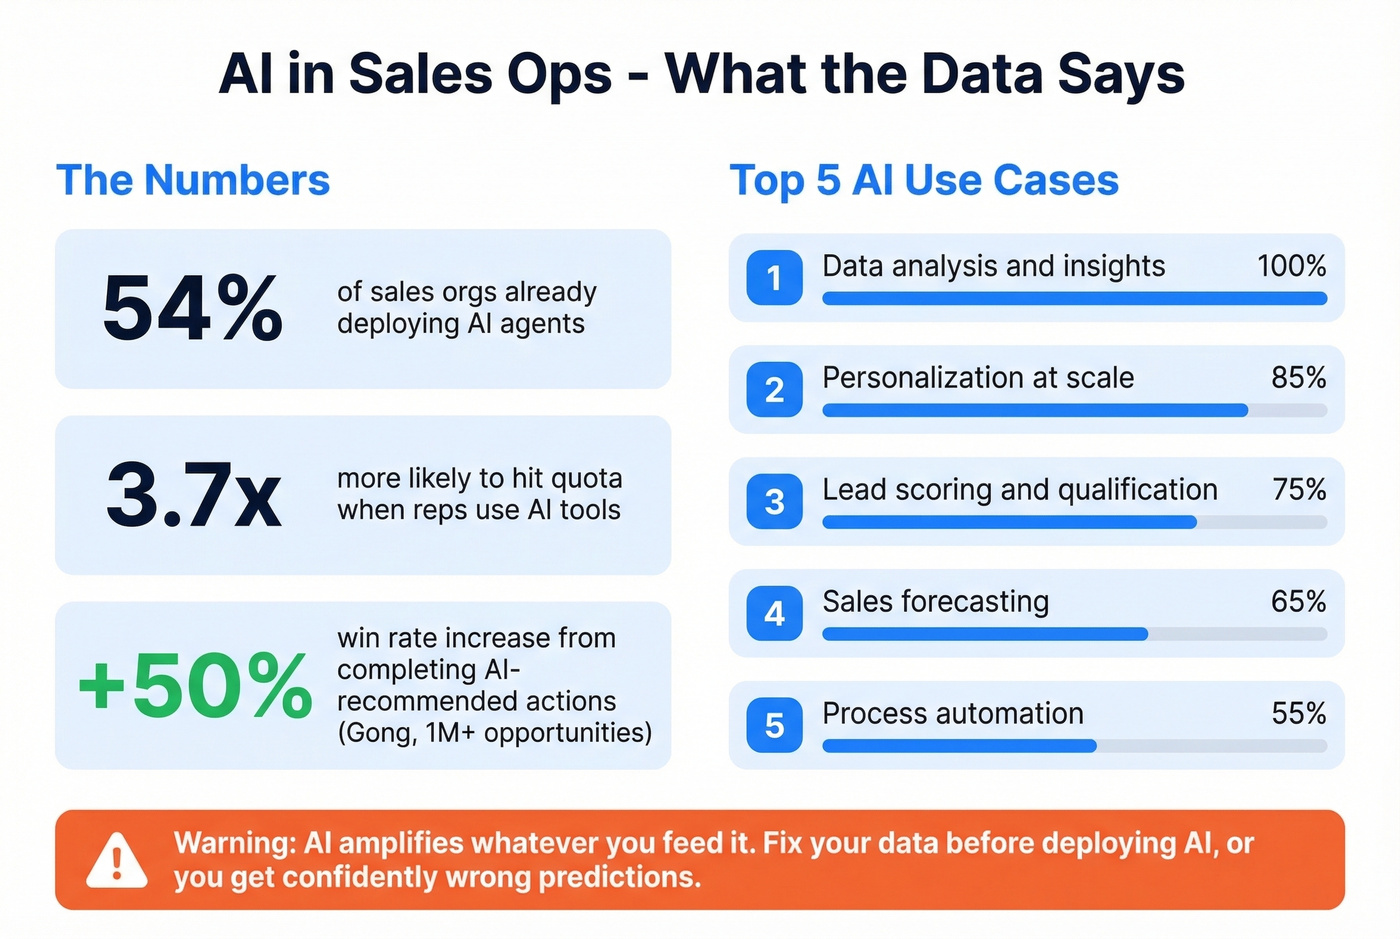
The five highest-impact AI use cases right now: data analysis and insights, personalization at scale, lead scoring and qualification, sales forecasting, and process automation.
Here's the thing, though. We've seen teams deploy AI forecasting on a CRM where 30% of contacts had stale emails. The model confidently predicted pipeline that didn't exist. In r/sales, these get described as "operationally lost" customers - deals that look alive in the CRM but died months ago. Fix the foundation first. Then let AI multiply the advantage.
The Quick-Win Checklist
Skip this section if you've already done a full ops audit in the last 90 days. For everyone else:
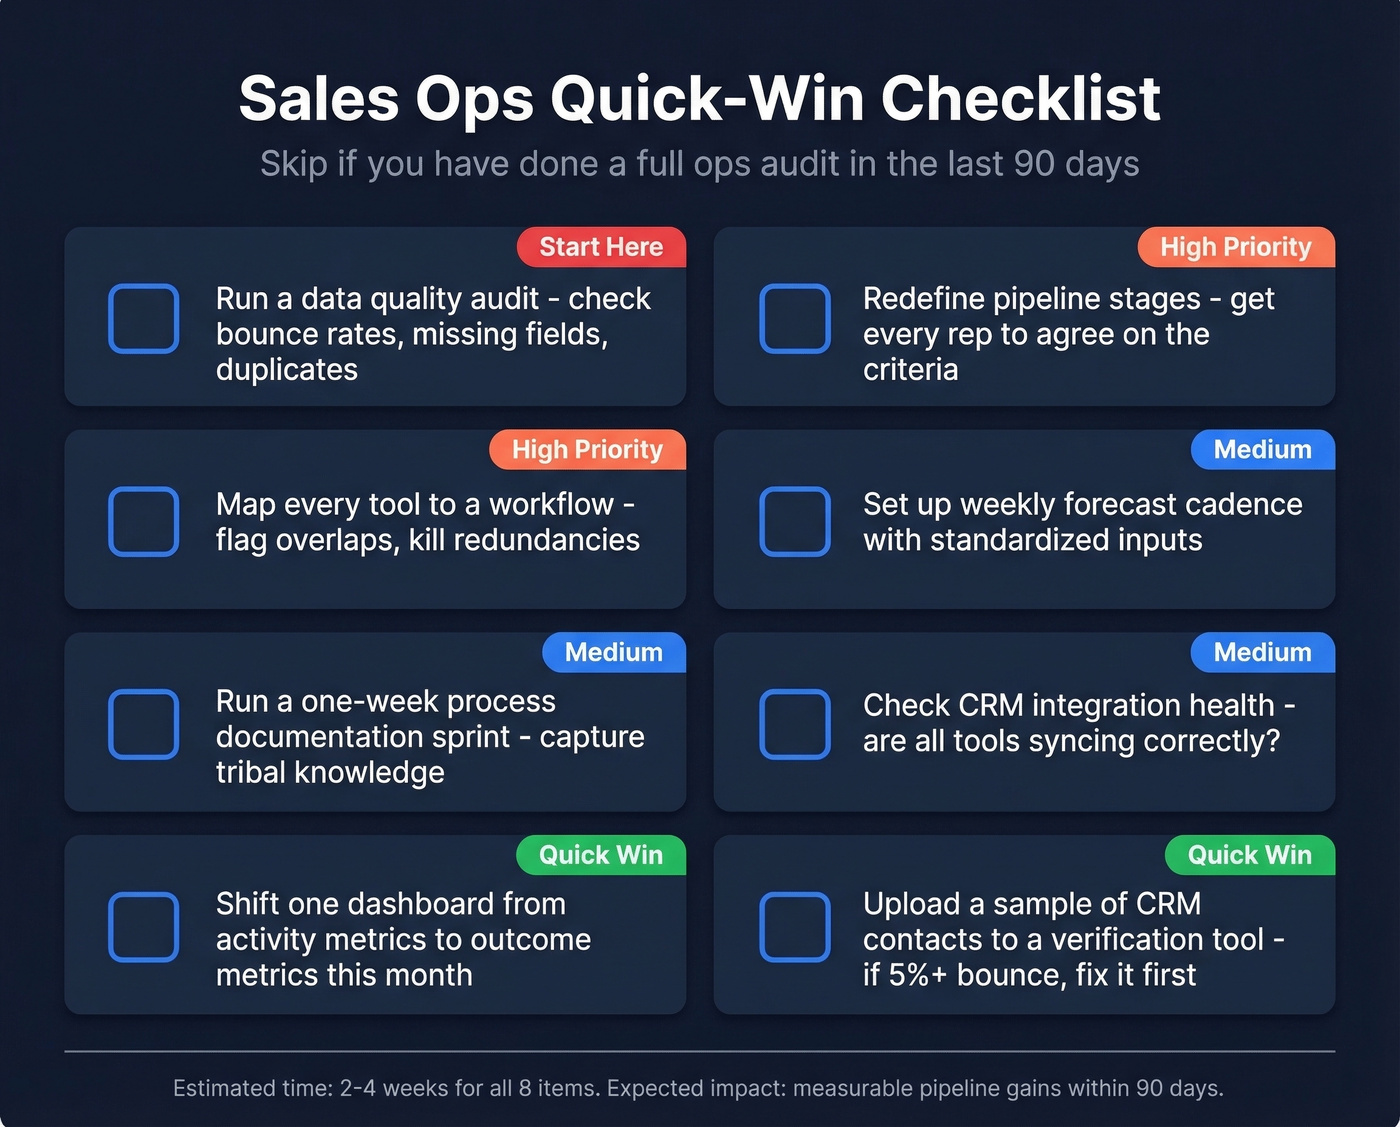
- Run a data quality audit - check bounce rates, missing fields, duplicate records.
- Redefine pipeline stages with your reps until everyone agrees on the criteria.
- Map every tool to a workflow. Flag overlaps. Kill redundancies.
- Set up a weekly forecast cadence with standardized inputs.
- Run a one-week process documentation sprint - capture tribal knowledge before it walks out the door.
- Check CRM integration health - are all tools syncing correctly?
- Shift one dashboard from activity metrics to outcome metrics this month.
- Upload a sample of your CRM contacts to a verification tool - if more than 5% bounce, you've found your first fix.
Tool bloat costs $2,340/rep/year in overlap waste. Prospeo replaces your email finder, data enrichment tool, and mobile number provider in one platform - at $0.01/email with native Salesforce and HubSpot integrations. That's Phase 2 handled.
Cut the stack. One platform, 300M+ profiles, zero overlap waste.
Sales Operations FAQ
What's the fastest way to improve sales operations?
Clean your CRM data first. Dirty records poison forecasting, lead routing, personalization, and AI tools downstream. Teams that start with a data quality audit typically see measurable pipeline and deliverability gains within three to six months. A full transformation with process redesign and automation takes 12-18 months.
What KPIs should a sales ops team track?
Focus on five outcome metrics: quota attainment, win rate, pipeline velocity, forecast accuracy, and rep ramp time. Avoid over-indexing on activity counts like calls made or emails sent - those measure motion, not results. Review the dashboard quarterly and adjust targets each cycle.
Sales ops vs. RevOps - what's the difference?
Sales ops focuses exclusively on the sales team's processes, tools, and data. RevOps unifies sales, marketing, and customer success under one operational function with shared metrics. Most companies start with sales ops and evolve toward RevOps as cross-functional alignment becomes a bottleneck to growth.
What's a good free tool for auditing CRM data quality?
Prospeo's free tier includes 75 verified email credits per month - enough to spot-check a CRM segment for bounce rates and stale contacts. Hunter offers 25 free searches monthly but caps enrichment depth. For a quick audit, export a sample of 50-75 contacts, run them through verification, and use the bounce rate as your baseline.