The LTV CAC Ratio: A Practitioner's Guide to the Metric Everyone Gets Wrong
Your board deck says the ratio is 4:1. Your CFO says it's 2.3:1. Same company, same quarter. The difference? One used revenue-based LTV, the other used gross profit. One included onboarding costs in CAC, the other didn't. Both are "right" - and that's exactly the problem.
LTV CAC - often written as LTV:CAC - measures how much lifetime value a customer generates relative to what it cost to acquire them. The formula is simple: divide customer lifetime value by customer acquisition cost. Everything after that - which LTV formula to use, what to include in CAC, what ratio to target - is where teams get it wrong.
What You Need (Quick Version)
The formula: LTV / CAC. The complexity is in the inputs.
The real benchmark: 3-4:1 for growth-stage SaaS, but it's stage-dependent. Pre-PMF, 2:1 is fine. At scale, above 5:1 often means you're underinvesting.
The companion metric you're probably ignoring: CAC payback period. A 5:1 ratio with 36-month payback can kill you faster than a 2:1 ratio with 6-month payback.
The hybrid rule: Payback under 12 months AND ratio above 3:1. Hit both, and your unit economics are genuinely healthy.
The contrarian take: A ratio above 5:1 isn't a flex - it usually means you're leaving growth on the table while a competitor at 3:1 is raising their Series B.
How to Calculate LTV: 4 Methods
Not all LTV calculations are created equal. The method you choose determines whether your ratio is a useful signal or a vanity metric.
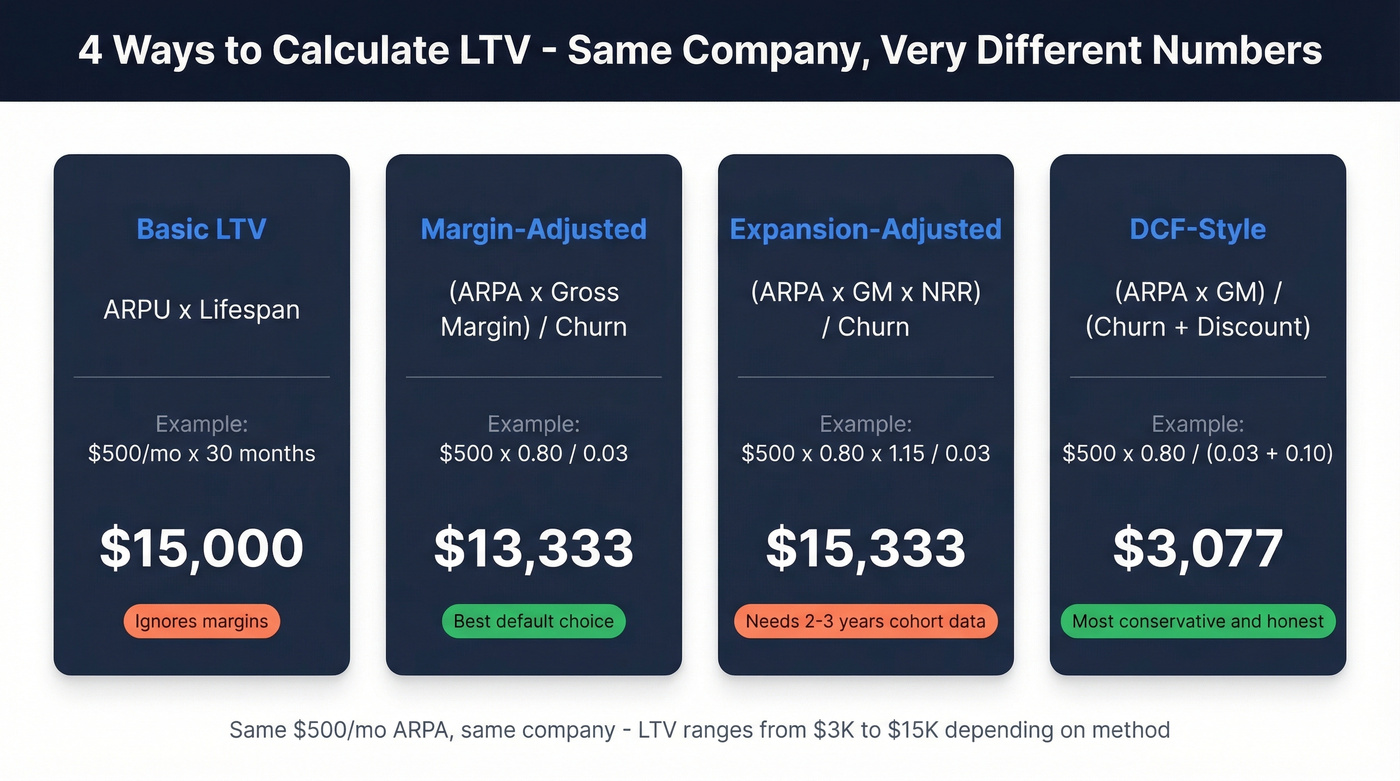
Basic LTV
Formula: ARPU x Average Customer Lifespan
If your average revenue per user is $500/month and customers stick around for 30 months, LTV = $15,000. This works as a napkin calculation, but it ignores margins, expansion, and the time value of money.
Margin-Adjusted LTV
Formula: (ARPA x Gross Margin) / Churn Rate
This is the default for most SaaS companies, and the one we'd recommend if you're only going to pick one. Typical B2B SaaS gross margins run 70-85%, so ignoring them inflates your LTV significantly.
Worked example: $500 ARPA x 0.80 gross margin / 0.03 monthly churn = $13,333 LTV. Compare that to the $15,000 from the basic formula - the margin adjustment knocked off over 10%.
Expansion-Adjusted LTV (NRR)
Formula: (ARPA x Gross Margin x NRR) / Churn Rate
If you've got strong net revenue retention, this formula captures upsell and cross-sell value. With 115% NRR: $500 x 0.80 x 1.15 / 0.03 = $15,333.
Be careful with high NRR numbers. A 130% NRR implies roughly 14x revenue from a single account over 10 years - that's almost never realistic. We've seen teams plug in aggressive NRR assumptions and end up with LTV figures that look incredible on paper, right up until cohort data proves them wrong. Cap your projection horizon at 5-7 years, or you're building your strategy on fantasy.
DCF-Style LTV
Formula: (ARPA x Gross Margin) / (Churn Rate + Discount Rate)
This is the most conservative and the most honest approach. Adding a discount rate (typically 10%) accounts for the fact that a dollar received three years from now is worth less than a dollar today.
Using the same $500/month ARPA: ($500 x 0.80) / (0.03 + 0.10) = $3,077. That's meaningfully lower than the $13,333 from the margin-adjusted formula, and it's the number a sophisticated investor will calculate even if you don't.
For most SaaS companies, the margin-adjusted formula strikes the right balance between accuracy and simplicity. Use DCF-style when you're presenting to investors or your board. Use expansion-adjusted only if you have at least 2-3 years of cohort data backing your NRR assumptions. Whichever method you choose, keep it consistent across reporting periods so your ratio trends mean something.
How to Calculate CAC the Right Way
Formula: Total Sales & Marketing Spend / New Customers Acquired
Simple enough. The problem is what people leave out of the numerator. Before you can build an accurate ratio, you need a fully loaded acquisition cost. Paddle's analysis shows how CAC can look absurdly low if you only count a slice of acquisition spend - $20 per customer until you include all costs, then it jumps to $200.
Fully Loaded CAC Checklist
| Cost Category | Include? | Notes |
|---|---|---|
| Paid ads | Yes | All channels |
| Sales salaries | Yes | + commissions, bonuses |
| Marketing salaries | Yes | Including contractors |
| CRM software | Yes | Salesforce, HubSpot, etc. |
| Content/SEO tools | Yes | CMS, keyword tools |
| Event/trade shows | Yes | Booth, travel, swag |
| Onboarding costs | Depends | Include if pre-revenue |
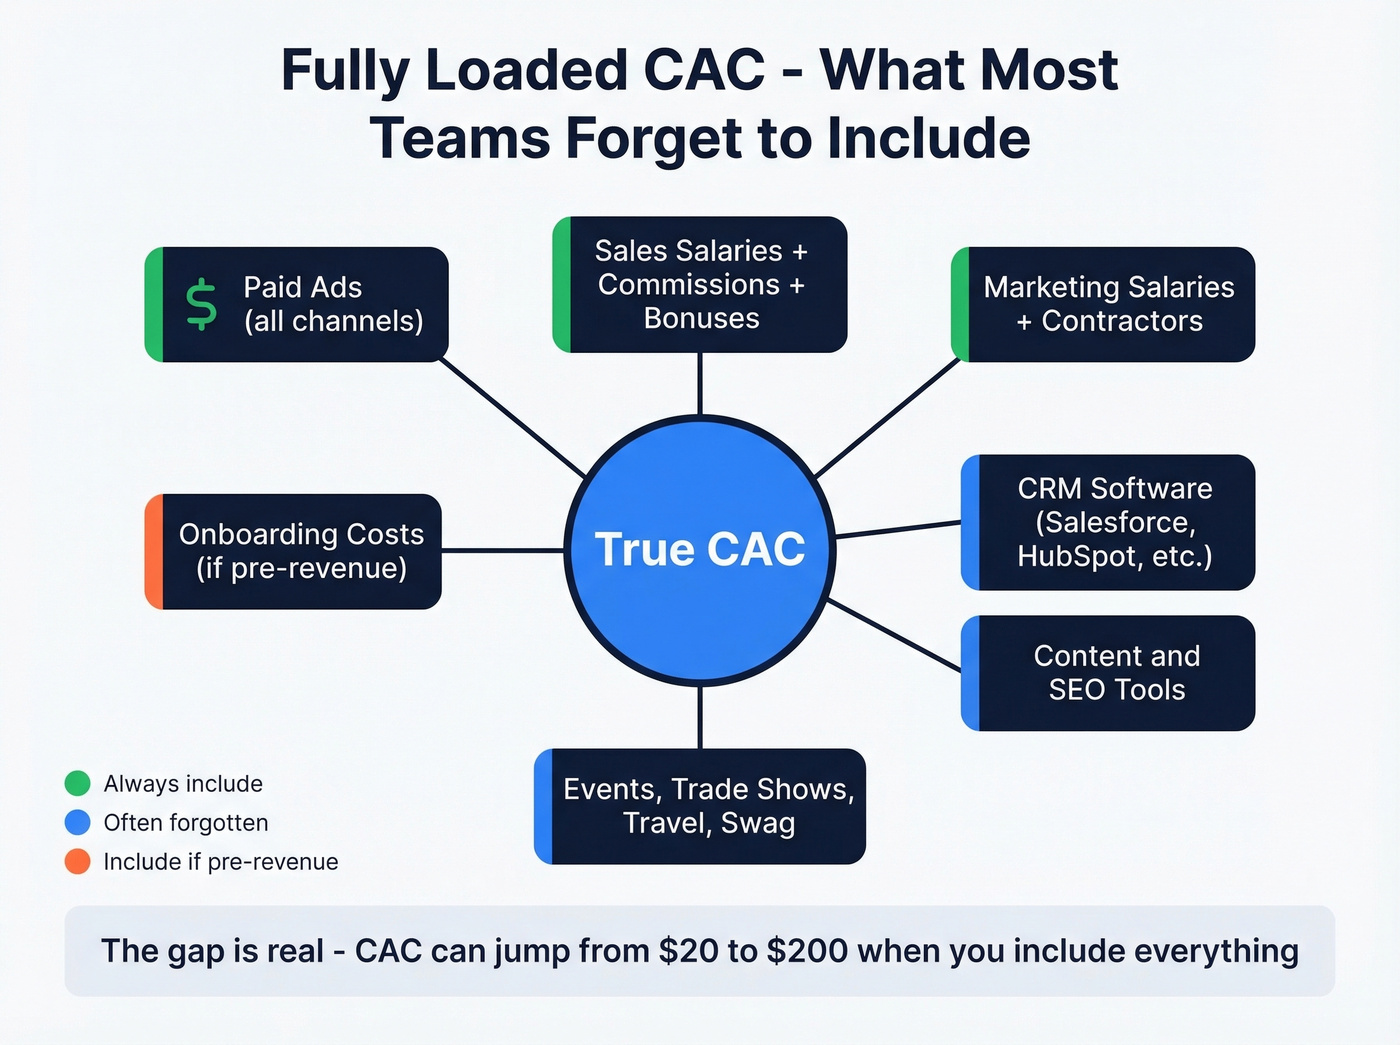
The distinction between blended CAC and channel CAC matters too. Your blended number might look healthy at 3:1, but break it down by channel and you might find paid search running at 1.5:1 while organic sits at 8:1. Blended CAC hides the channels hemorrhaging money - and the ones that deserve more budget.
Here's the thing: most teams undercount CAC because it makes the ratio look better. Resist that temptation. A fully loaded CAC gives you a ratio you can actually make decisions with.
Putting It Together: Worked Examples
Here's how the ratio and payback period tell different stories for three companies at different stages.
| Company | LTV | LTV:CAC | Payback |
|---|---|---|---|
| Company A | $21,000 | 5:1 | 4 months |
| Company B | $12,000 | 3:1 | 12 months |
| Company C | $4,200 | 1:1 | 20 months |
Company A looks great on both metrics - strong ratio, fast payback. Company B is solid: the 3:1 ratio is healthy, and 12-month payback is the standard benchmark. Company C is in trouble. A 1:1 ratio means they're barely breaking even on each customer, and 20-month payback means they're funding growth with cash they won't recoup for nearly two years.
Company B's ratio alone might make it look "worse" than Company A, but both are viable businesses. Company C's ratio tells you the business model needs fixing before scaling.
What's a Good LTV CAC Ratio?
It depends on your stage, your industry, and how you calculate it. The "3:1 is good" rule is a useful starting point, but it's dangerously oversimplified.
Stage-Based Targets
Pre-PMF (~2:1 acceptable): You're optimizing for learning, not efficiency. Spending more to acquire customers who give you feedback is a legitimate strategy. A founder on r/SaaS panicked about a 1.2:1 ratio - and while that's tight, the real question at that stage is whether the product is getting stickier, not whether the ratio hits a textbook benchmark.
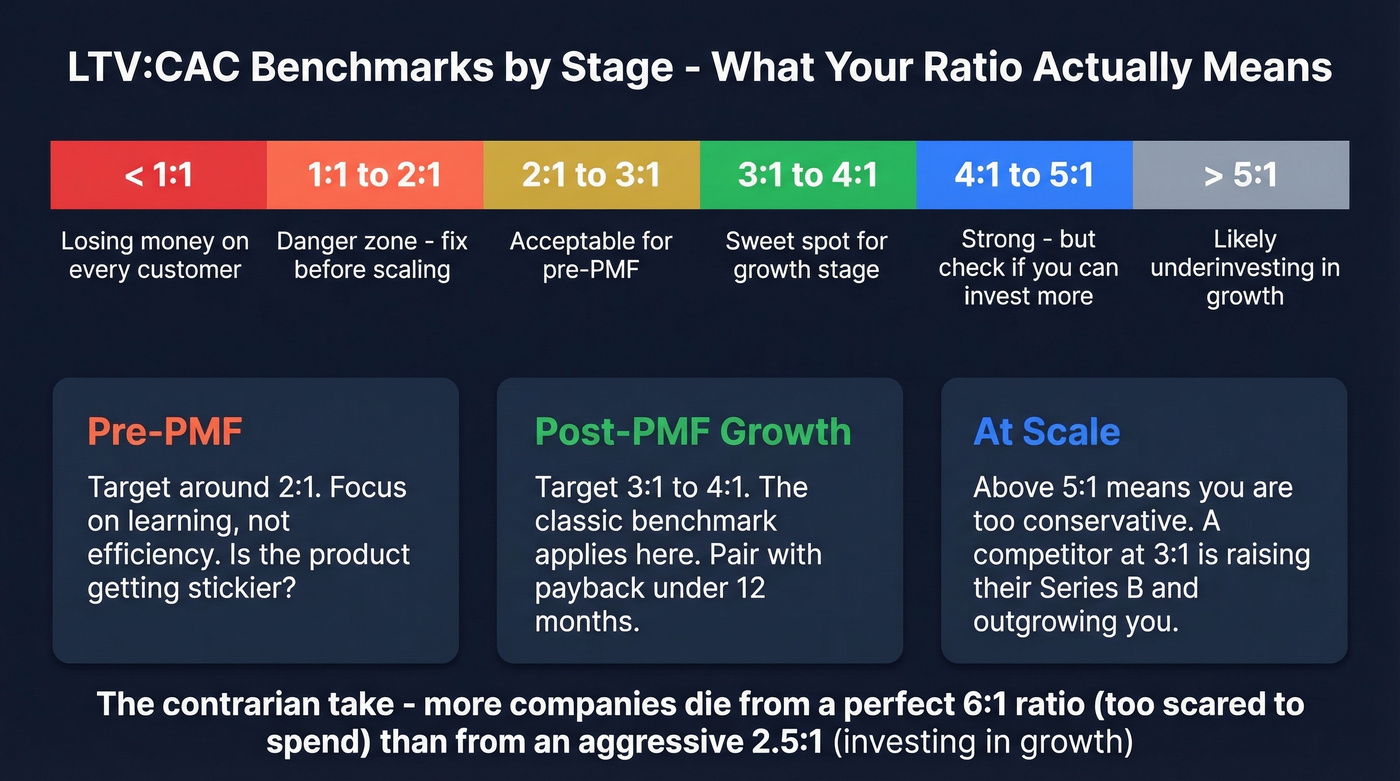
Post-PMF growth (3-4:1 sweet spot): This is where the classic benchmark applies. A dataset spanning 10 SaaS industries with 2019-2024 rolling averages puts the "ideal" range at 3-4:1.
Scaling (>5:1 signals underinvestment): A SaaS company with a 7:1 ratio watched a competitor at ~3:1 raise a Series B and outgrow them. The "perfect" ratio was actually a sign they were too conservative with acquisition spend. If your ratio is above 5:1, you're likely leaving market share on the table.
Let's be honest about something: the obsession with ratio optimization is itself a trap. We've watched more companies die from a "perfect" 6:1 ratio - meaning they were too scared to spend - than from an aggressive 2.5:1 where they were investing in growth. If your deal sizes are under $10K and payback is under 12 months, stop optimizing the ratio and start buying more pipeline.
Industry Benchmarks
| Industry | Typical Ratio |
|---|---|
| Business Consulting | 4:1 |
| eCommerce | 3:1 |
| Entertainment | 2.5:1 |
| SaaS (B2C) | 2.5:1 |
| SaaS (B2B) | 4:1 |
For broader context, B2B SaaS CAC averages $1,200 per customer. The efficiency gap is massive: top-quartile SaaS companies spend $1.00 to acquire $1 of new ARR, while bottom-quartile companies spend $2.82. That's nearly a 3x difference in acquisition efficiency, and it compounds fast. Making matters worse, 75% of software companies reported declining retention rates in recent years, which means LTV is shrinking for most of the market while CAC holds steady or rises.
A fully loaded CAC includes every tool in your stack - including the data provider bleeding your budget. Prospeo delivers 98% email accuracy at ~$0.01/lead, 90% cheaper than ZoomInfo. Teams using Prospeo book 26% more meetings, which means more customers acquired for the same spend - and a healthier LTV:CAC ratio.
Lower your CAC without cutting pipeline. Better data does both.
Why Investors Obsess Over This Ratio
Investors care because the ratio is a proxy for margins, and margins drive valuation. An a16z analysis of 60+ public consumer internet companies found that improving the ratio from roughly 2x to 3x nearly tripled valuation. That's not a marginal improvement - it's a step-function change in how the market prices your business.
The cautionary tale is Casper. Weak unit economics - high CAC, questionable retention, thin margins - led to a valuation collapse despite strong brand awareness. The ratio doesn't lie when you calculate it honestly.
Here's where the opening hook gets resolved: investors define LTV as gross profit, not revenue. When your board deck uses revenue-based LTV and your CFO uses gross-profit LTV, you get two different ratios for the same business. The CFO is right. Use gross profit. Always.
Segment Your Ratio by ICP
One of the most underused applications of this metric is ICP prioritization. Imagine two customer segments: mid-market accounts with a 5:1 ratio and 8-month payback, and SMB accounts with a 1.8:1 ratio and 14-month payback. The blended ratio might look fine at 3.2:1, but the segment-level data tells you to shift acquisition spend toward mid-market and away from SMB - or to fix the SMB product experience before scaling that segment.
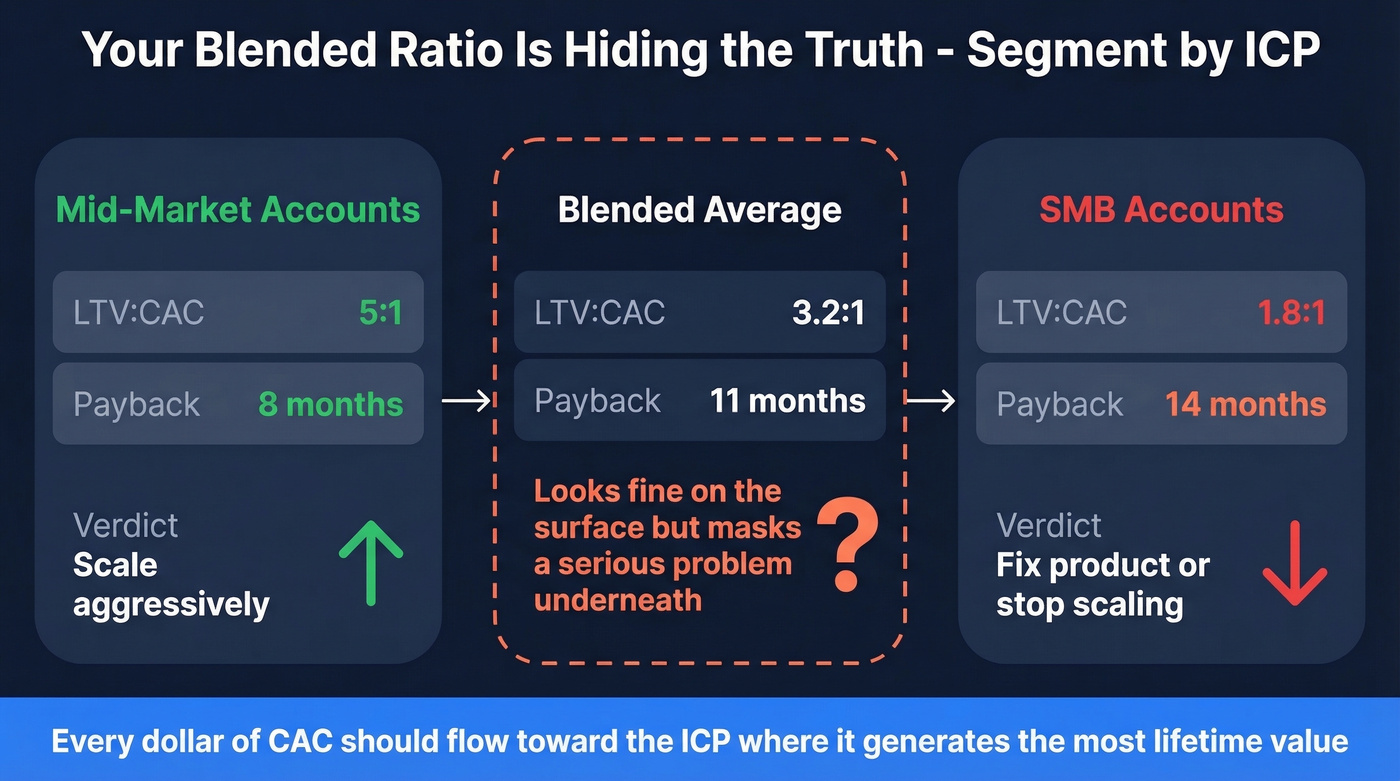
Every dollar of CAC should flow toward the ideal customer profile where it generates the most lifetime value. Segment-level analysis is what separates data-informed teams from those flying blind on blended averages.
CAC Payback Period
The ratio tells you the total return on acquisition spend. Payback period tells you how fast you get that money back. For cash-constrained companies, payback is the more important metric.
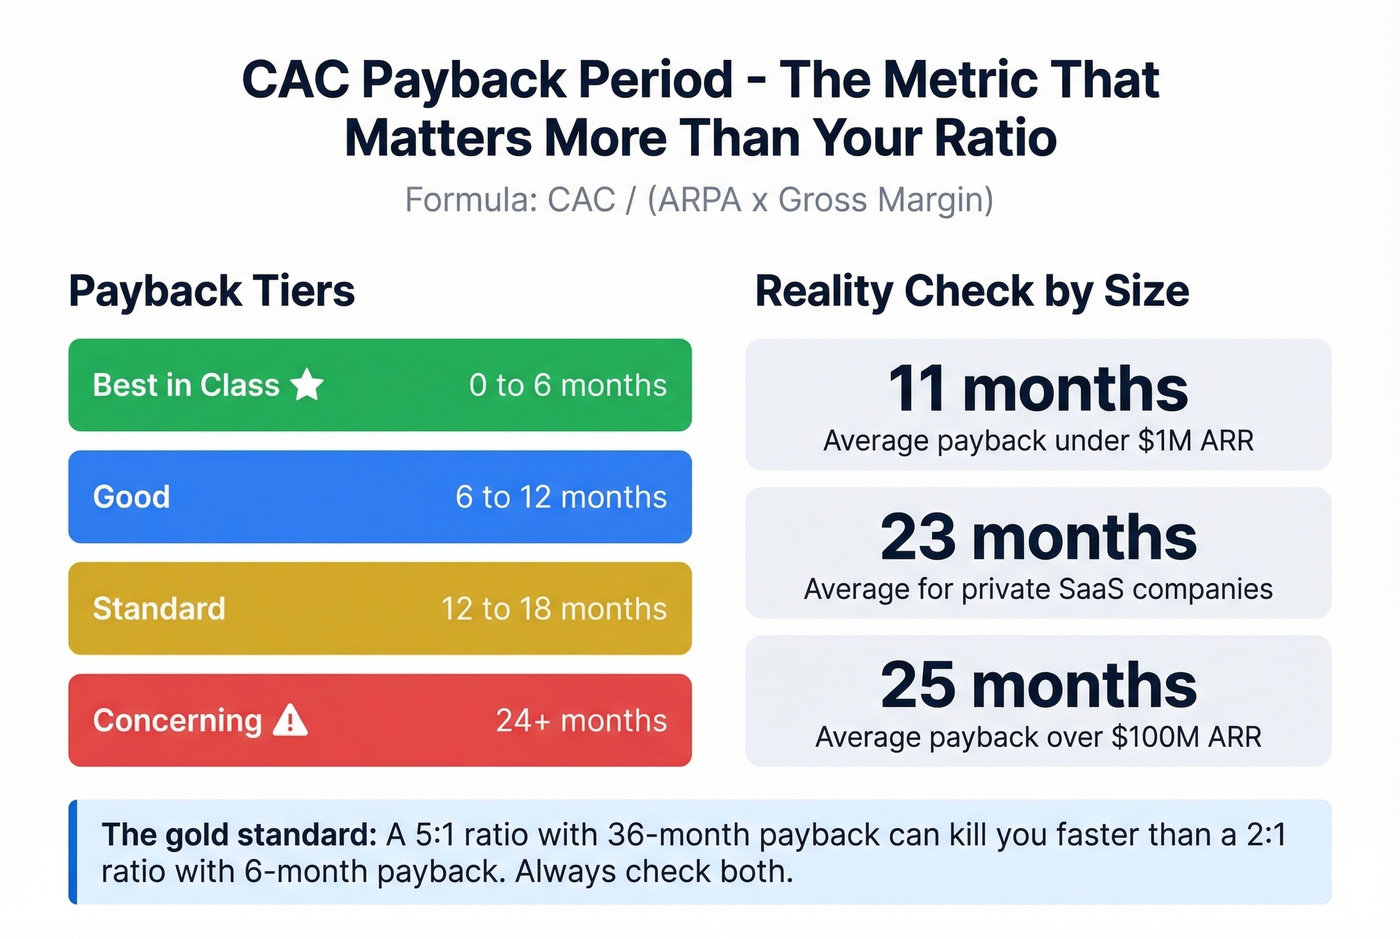
Formula: CAC / (ARPA x Gross Margin)
Benchmarks
| Tier | Payback Range | Assessment |
|---|---|---|
| Best-in-class | 0-6 months | Elite efficiency |
| Good | 6-12 months | Healthy |
| Standard | 12-18 months | Acceptable |
| Concerning | >24 months | Cash strain risk |
The numbers shift with scale. Companies under $1M ARR average about 11-month payback. Over $100M ARR, it stretches to roughly 25 months - larger deals take longer to close and onboard. By ACV, sub-$5K deals average about 9-month payback, while $100K+ deals run closer to 24 months. The average CAC payback for private SaaS companies is 23 months, which is longer than most founders expect.
The gold standard for payback analysis is cohort-based: track cumulative gross profit by acquisition cohort over time until it crosses the CAC line. This avoids the averaging problems that plague company-wide calculations and shows you exactly when each cohort breaks even.
Real-World Examples
Zoom achieved roughly 7-month payback pre-IPO - elite by any standard. Slack ran at 15-18 months, solid but not exceptional. Datadog is the expansion-revenue poster child: 84% of their customers use 2+ products and 54% use 4+.
The hybrid operating rule we recommend: payback under 12 months AND ratio above 3:1. Hit both, and you've got unit economics that support aggressive growth without burning through cash reserves. Miss one, and you need to understand why before you scale.
5 Mistakes That Ruin Your Ratio
1. Using average churn across all customers. Churn varies by segment, tenure, and deal size. Your enterprise customers might churn at 2% annually while SMB churns at 8% monthly. Averaging these produces a number that describes nobody.
2. Inflating LTV with aggressive NRR. A 130% NRR plugged into a standard formula implies 14x revenue from a single account over 10 years. Unless you're selling to governments, that's not happening. Cap your projection horizon or use DCF-style discounting.
3. Marketing vs. finance LTV mismatch. Marketing uses revenue-based LTV because it makes campaigns look better. Finance uses gross-profit LTV because it's accurate. Same meeting, different numbers, confused executives. Pick gross profit and align everyone.
4. Misaligning time periods. Calculating LTV over a 5-year customer lifespan but CAC over last quarter creates a meaningless ratio. Both inputs need to reflect the same cohort and the same time horizon.
5. Using blended CAC when channel CAC matters. Your overall ratio looks fine at 3.5:1, but paid social is running at 0.8:1 while organic content is at 12:1. Blended CAC hides the channel that's burning money - and the one that deserves twice the budget.
How to Improve Your Ratio
You've got two levers: increase LTV or decrease CAC. Most teams focus on the numerator and ignore the denominator.
Increase LTV
Reduce churn through better onboarding, proactive customer success, and product stickiness. Drive expansion revenue with upsells, cross-sells, and usage-based pricing tiers. Move upmarket if retention holds - higher ACV means higher lifetime value, as long as you're not just acquiring bigger customers who churn at the same rate. Improve gross margins by reducing delivery costs and automating support.
If churn is the root cause, start with a clean churn rate formula and then move into a real plan for reducing churn.
Decrease CAC
Optimize your channel mix ruthlessly. Kill underperforming channels and double down on what's working organically. Improve conversion rates across the funnel - a 10% improvement in demo-to-close rate reduces CAC without spending a dollar more on leads.
Skip this section if your ratio problem is clearly on the LTV side. But if CAC is the culprit, fix your data quality first. It's the most underrated CAC lever out there. High bounce rates waste rep time on outreach that never reaches anyone, and that wasted effort sits in your S&M spend while new customer count stays flat - directly inflating acquisition costs. Snyk's 50 AEs saw bounce rates drop from 35-40% to under 5% after switching to Prospeo, and AE-sourced pipeline jumped 180%.
If you're auditing your acquisition math, use a consistent customer acquisition cost formula and sanity-check it against an average cost per acquisition benchmark.
Shorten sales cycles through better qualification and faster follow-up. Every week a deal sits in pipeline adds to the effective CAC of that customer.
Bad data doesn't just inflate CAC - it wrecks payback period. Bounce rates above 5% burn send reputation and stretch your time-to-ROI. Prospeo's 5-step verification and 7-day refresh cycle keep bounce rates under 4%, so every dollar you spend acquiring customers actually reaches a real inbox.
Slash your payback period with emails that actually land.
FAQ
How do you calculate LTV CAC the right way?
Start with margin-adjusted LTV for most SaaS companies, or DCF-style LTV for investor presentations. Build a fully loaded CAC that includes all sales and marketing costs - not just ad spend. Divide LTV by CAC, ensuring both inputs cover the same cohort and time horizon.
What's a good ratio for a startup?
A 2:1 ratio is acceptable pre-product-market-fit when you're optimizing for learning over efficiency. Post-PMF, aim for 3-4:1. Above 5:1 at growth stage typically signals underinvestment in acquisition - your competitors are likely outspending you to capture market share.
How is this ratio different from CAC payback period?
The ratio measures total return on acquisition spend over a customer's lifetime; payback period measures how quickly you recoup that spend in cash. A 5:1 ratio with 36-month payback can bankrupt a cash-constrained startup faster than a 2:1 ratio with 6-month payback. Always track both.
Should I use revenue or gross profit for LTV?
Gross profit - always. Revenue-based LTV overstates customer value by ignoring delivery costs, and investors will recalculate using gross profit anyway. Aligning marketing and finance on gross-profit LTV resolves most internal disagreements about the ratio.
Can bad contact data inflate my CAC?
Yes. Stale or unverified emails waste outreach budget on bounces and dead numbers, inflating your S&M spend while new customer count stays flat. Fixing data quality is one of the fastest ways to bring CAC down without changing anything else about your go-to-market motion.