MQL Examples: Scoring Models That Work in 2026
You've been in the meeting where marketing celebrates 500 MQLs and sales rolls their eyes. The disconnect isn't about effort - it's about definition. An MQL is a lead whose demographic fit and behavioral signals together cross a threshold you've deliberately set. Not a hand-raiser. Not a content downloader. Someone worth a sales conversation.
Here are the MQL examples, scoring models, and benchmarks that actually work - with real point values, negative scoring, and the conversion data to calibrate against.
The Quick Version
- Start with 5-7 scoring criteria, set your MQL threshold at 60 points on a 100-point scale, and include negative scoring from day one.
- If your MQL-to-SQL rate is below 20%, your definition is too loose. Above 60% with low volume? Too tight.
- PLG companies: skip traditional MQLs entirely - use PQLs based on product usage milestones.
A Worked MQL Scoring Model
Let's build a real scoring model. Here's a positive scoring table combining the criteria that matter most for a typical B2B SaaS company - fit criteria (title, industry, company size) weighted at roughly 60% and engagement criteria at 40%.
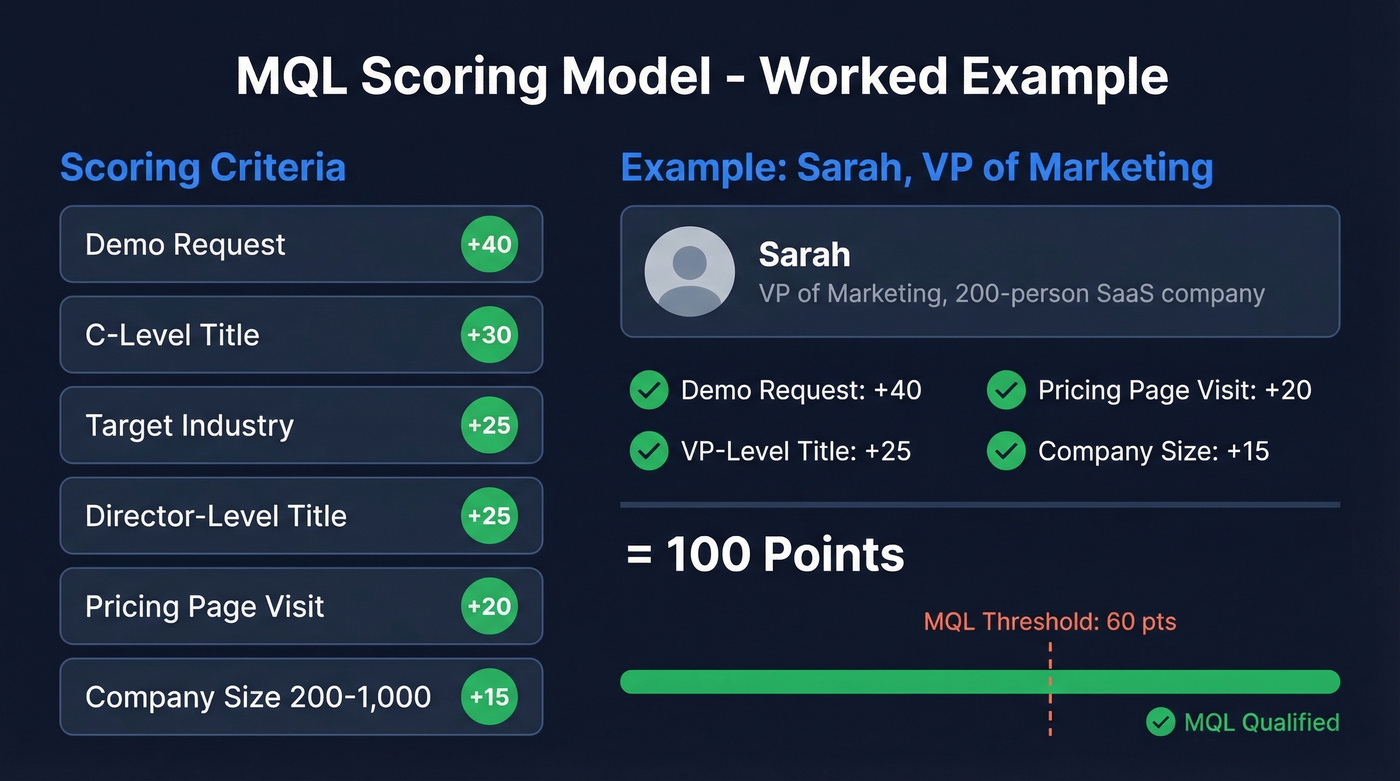
| Signal | Points |
|---|---|
| Demo request | +40 |
| C-level title | +30 |
| Target industry | +25 |
| Director-level title | +25 |
| Pricing page visit | +20 |
| Company size 200-1,000 | +15 |
Now walk through a scenario. Sarah is VP of Marketing at a 200-person SaaS company. She requests a demo (+40), visits the pricing page (+20), and her title scores +25. Her company size adds +15. That's 100 points - well above a 60-point MQL threshold, and she gets routed to an AE within minutes.
This is one of the clearest marketing qualified lead examples you'll find: strong fit signals combined with high-intent behavior. The typical threshold sits between 50 and 75 points on a 100-point scale, designed to capture the top 20% of leads by score. Start at 60, then calibrate quarterly based on your conversion data.
Negative Scoring Criteria
Positive scoring alone inflates your pipeline with junk. Negative scoring is what keeps it honest.
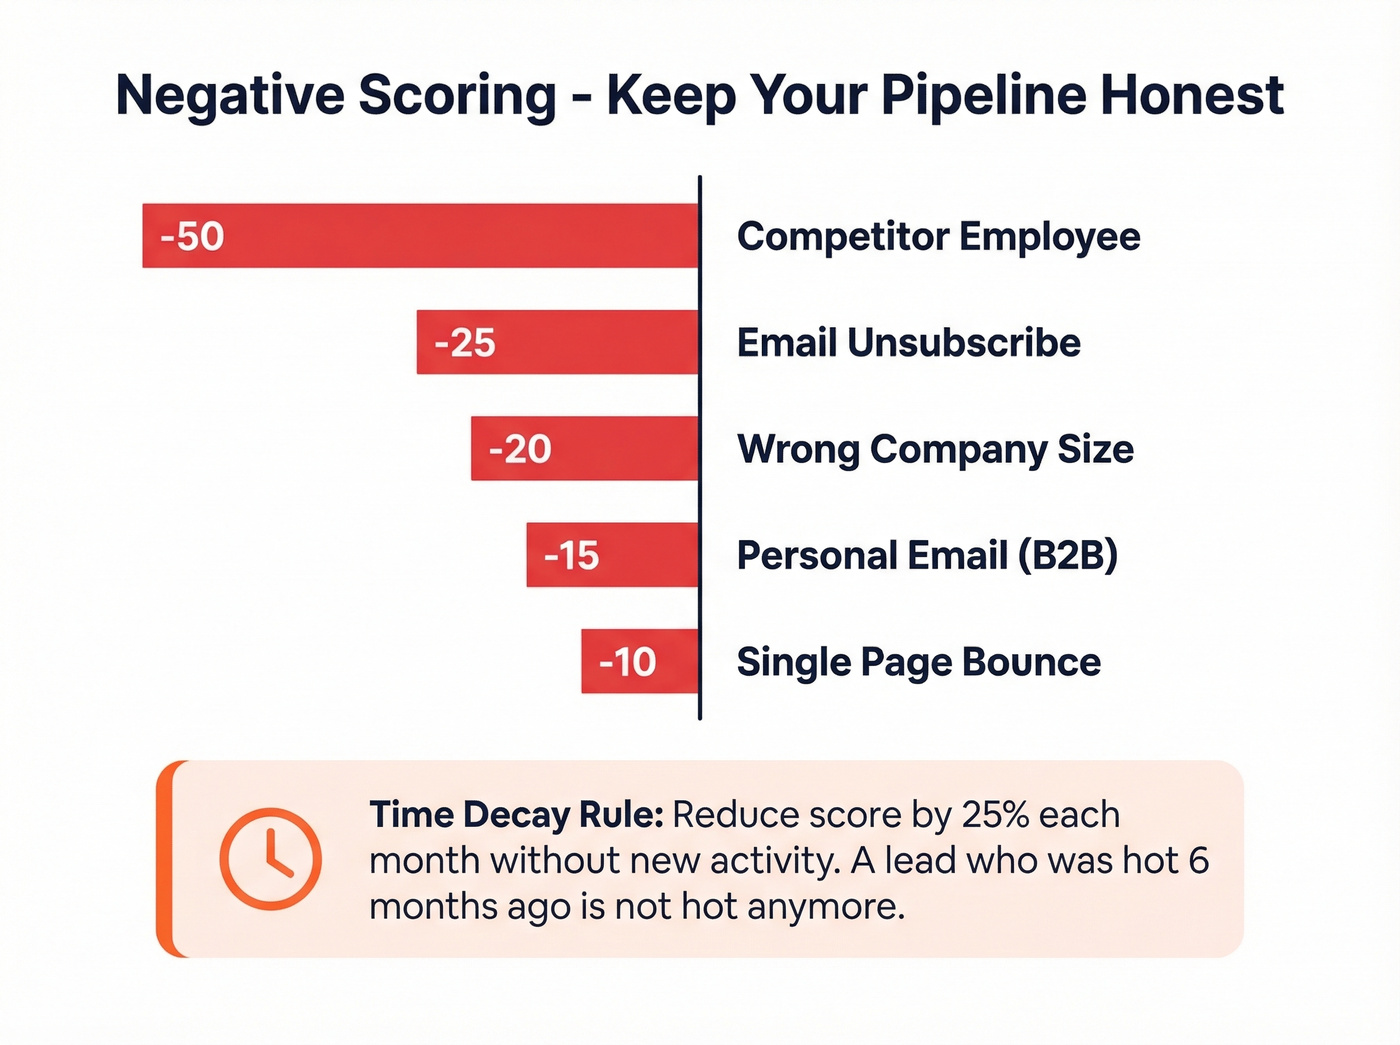
| Signal | Points |
|---|---|
| Competitor employee | -50 |
| Email unsubscribe | -25 |
| Wrong company size | -20 |
| Personal email (B2B) | -15 |
| Single page bounce | -10 |
One rule most teams skip: time-based score decay. Reduce a lead's score by 25% monthly without new activity. A lead who was hot six months ago isn't hot anymore, and your model should reflect that.
Industry-Specific MQL Examples
Generic scoring models are a starting point. Here's what qualified leads actually look like across different verticals.
Cybersecurity MSP: An IT Director at a 50-500 employee company who attended a compliance webinar and visited the managed detection page. Fit signals carry heavy weight here because the buying committee is small and technical.
Architecture firm: A facilities manager at a commercial developer who downloaded a project portfolio PDF and then returned to view the services page within 48 hours. The return visit matters more than the download - it signals evaluation, not casual browsing.
B2B fintech: A CFO or VP of Finance at a Series B+ startup who visited the integrations page and watched a product walkthrough video. In fintech, integration compatibility is the #1 buying filter, so that page visit should score higher than a generic blog read.
The pattern across all three: fit criteria do the heavy lifting, engagement criteria confirm timing. We've seen teams get this backwards - weighting email opens and page views above title and company size - and it always produces a bloated pipeline that sales ignores.
MQL-to-SQL Benchmarks by Industry and Channel
Benchmarks give you a sanity check. If your numbers are wildly off from your industry, something's broken.
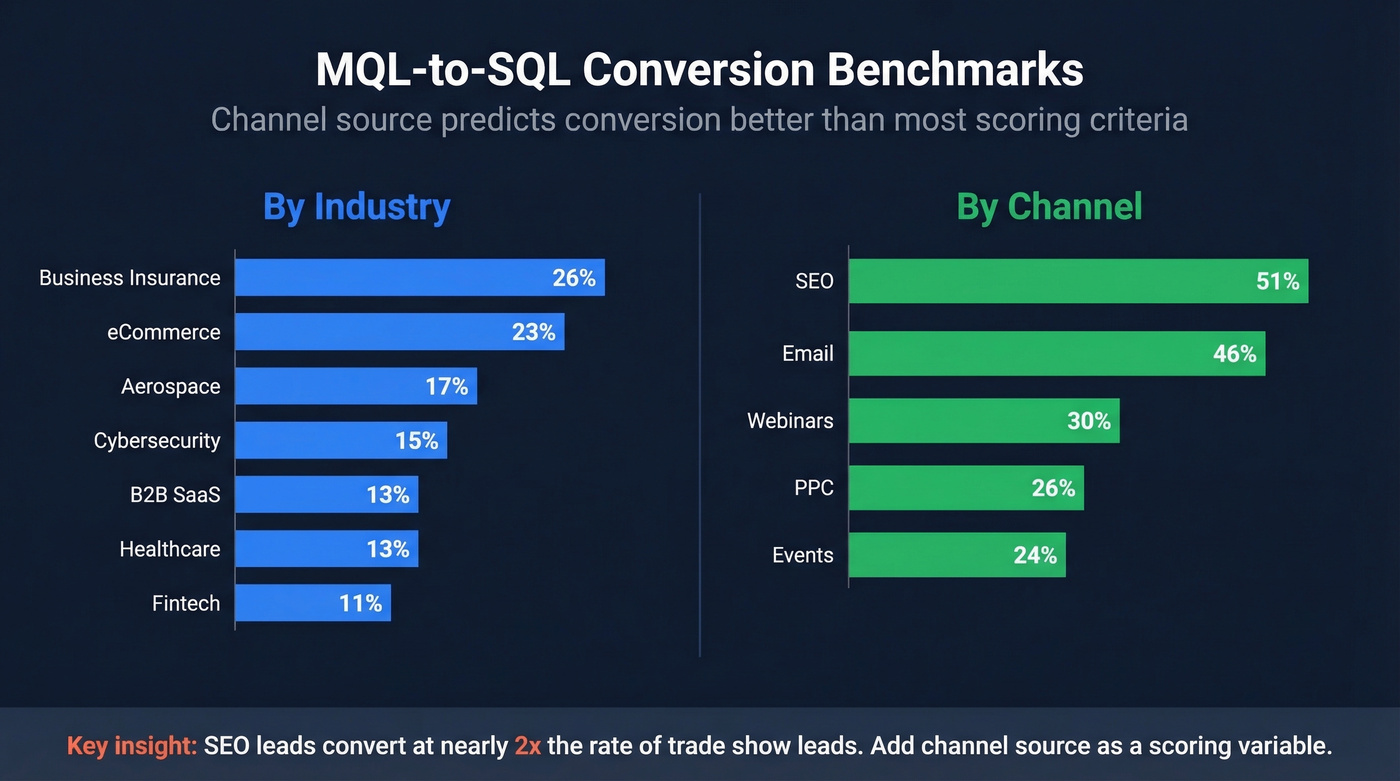
By industry:
| Industry | MQL-to-SQL Rate |
|---|---|
| Business Insurance | 26% |
| eCommerce | 23% |
| Aerospace | 17% |
| Cybersecurity | 15% |
| B2B SaaS | 13% |
| Healthcare | 13% |
| Fintech | 11% |
By channel:
| Channel | MQL-to-SQL Rate |
|---|---|
| SEO | 51% |
| 46% | |
| Webinars | 30% |
| PPC | 26% |
| Events | 24% |
Here's the thing: channel predicts conversion better than most scoring criteria. An MQL from organic search converts at nearly double the rate of one from a trade show. If you're treating all leads equally regardless of source, you're leaving signal on the table. In our experience, teams that add channel source as a scoring variable see the fastest improvement in conversion rates - sometimes a 10-15 point jump in a single quarter.
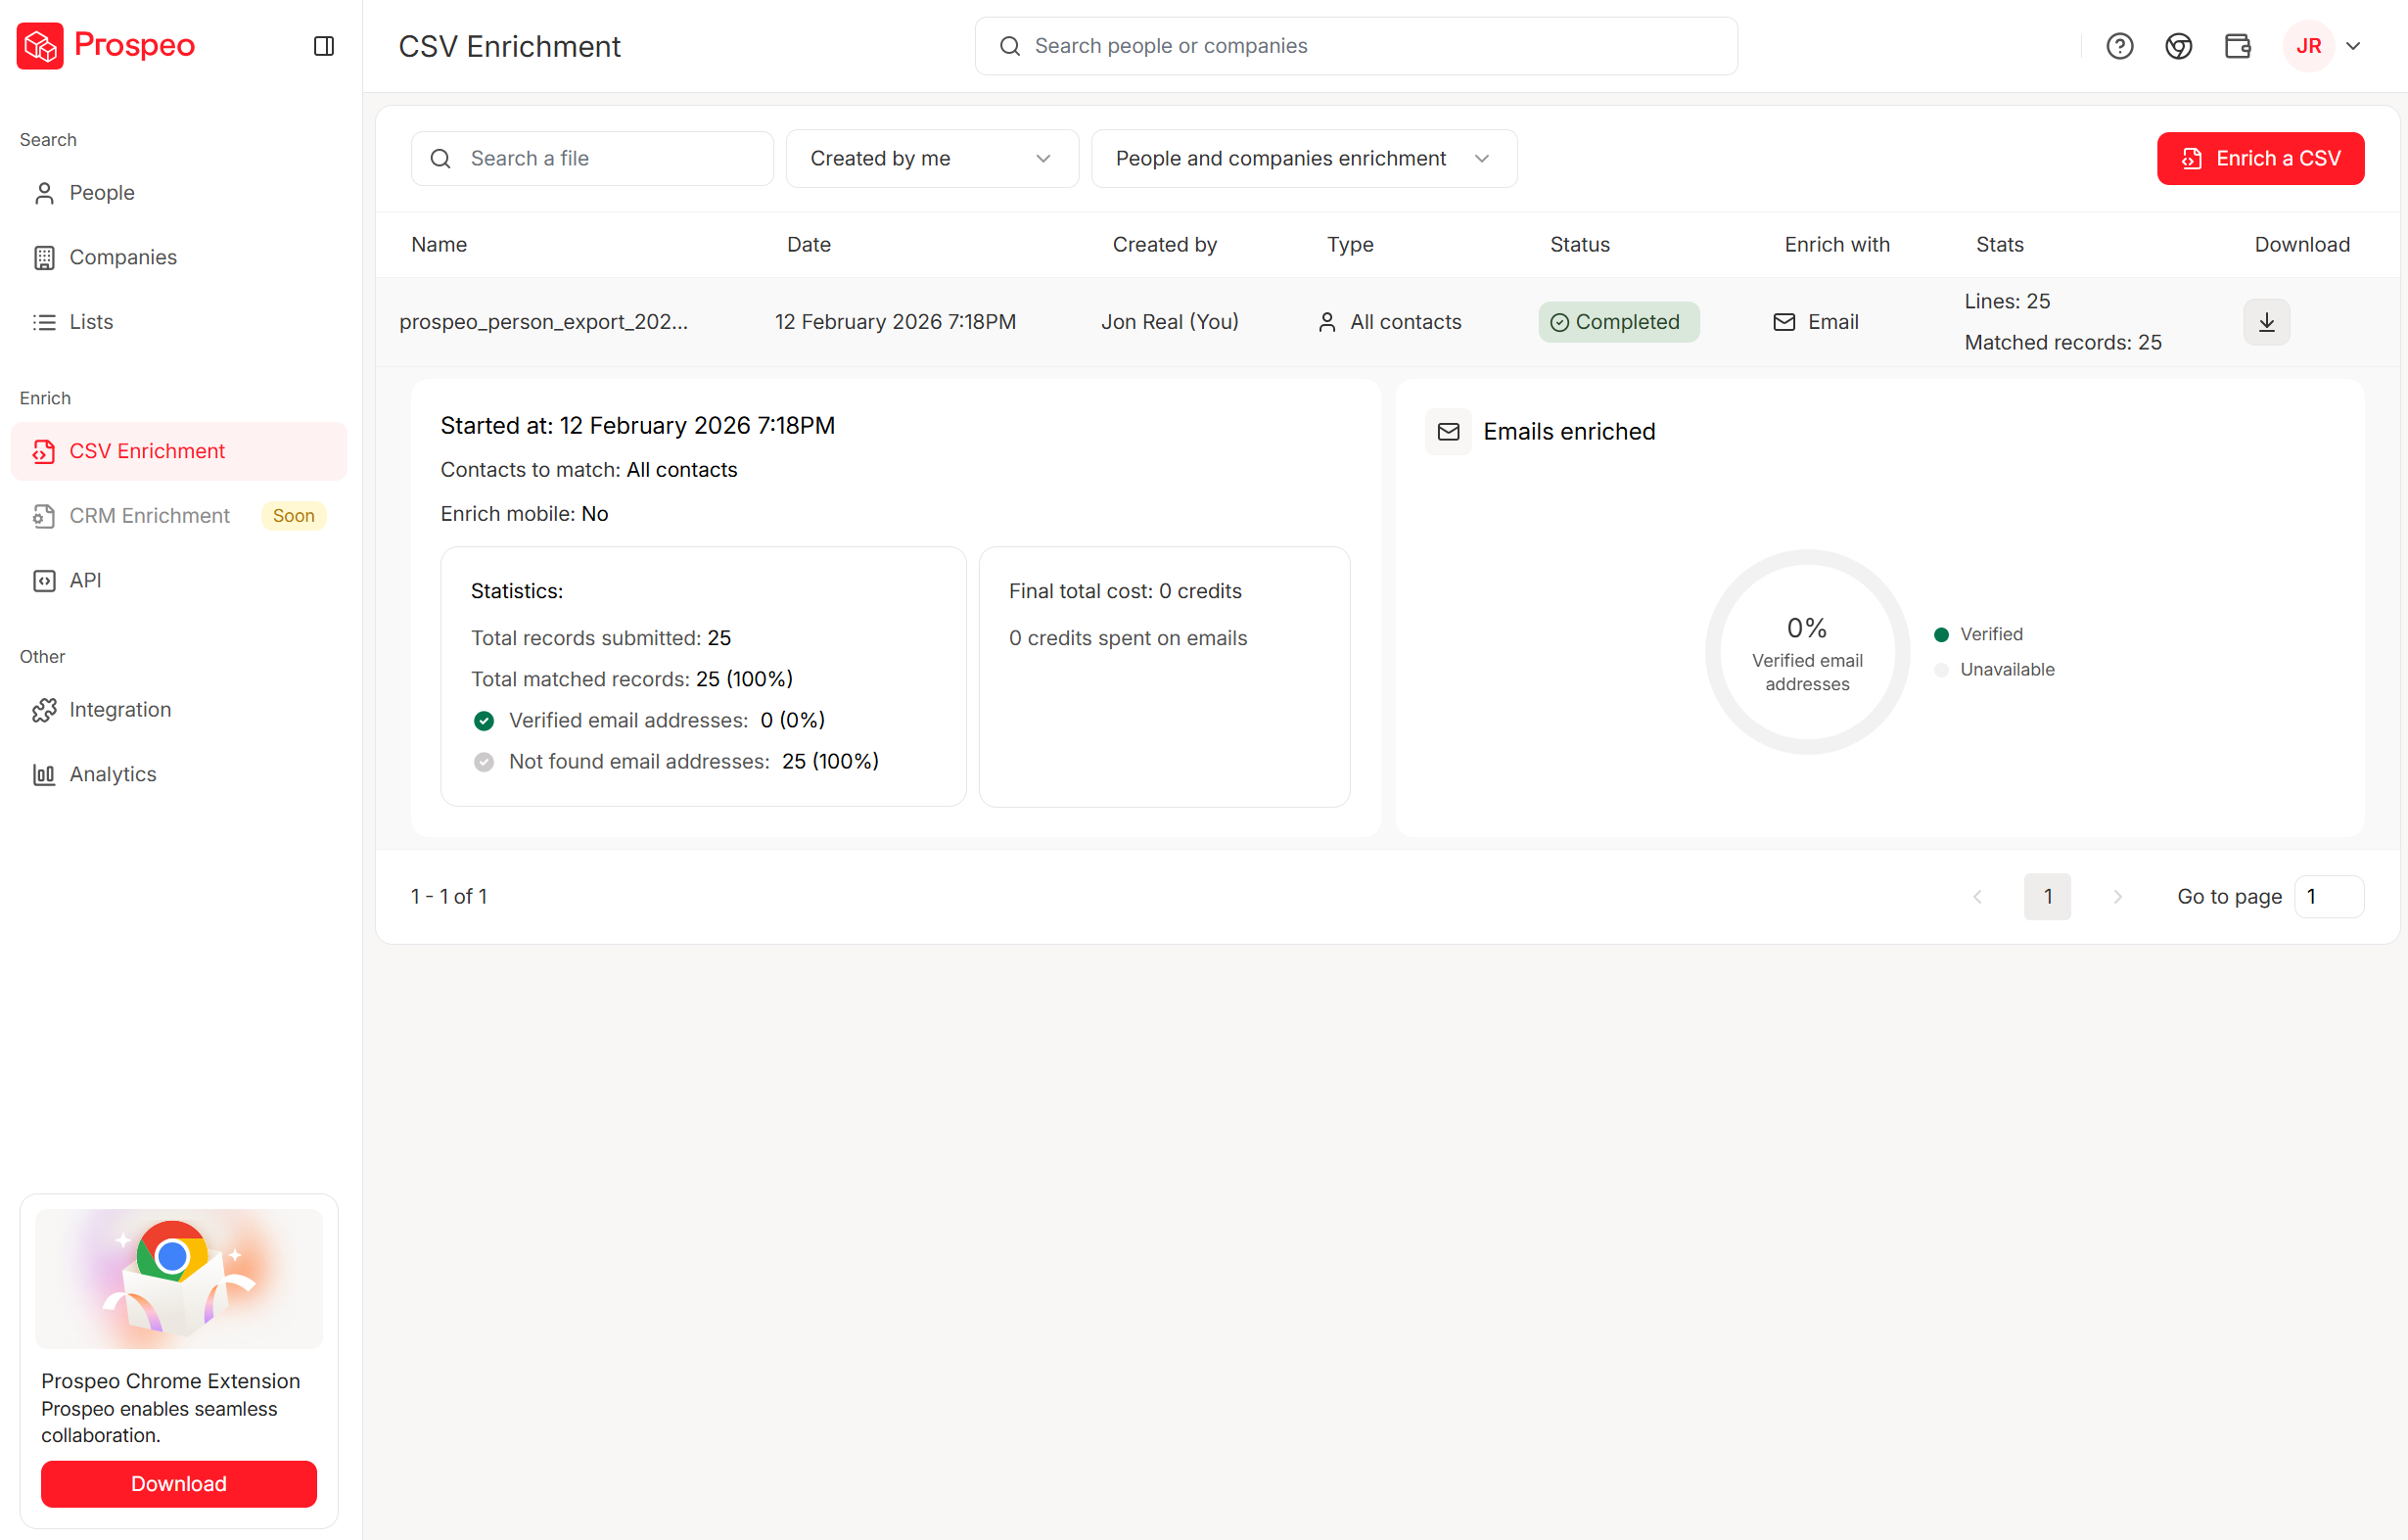
A perfect lead score means nothing when the contact data underneath is stale. Prospeo refreshes 300M+ profiles every 7 days - not every 6 weeks - so your highest-scoring MQLs actually connect to real buyers with verified emails (98% accuracy) and direct dials.
Stop routing high-score leads to dead inboxes.
Beyond MQLs: PQL Examples
For product-led companies, PQLs outperform traditional marketing qualified leads. A PQL combines ICP fit with actual product usage - not just marketing engagement, but proof the lead has experienced value.
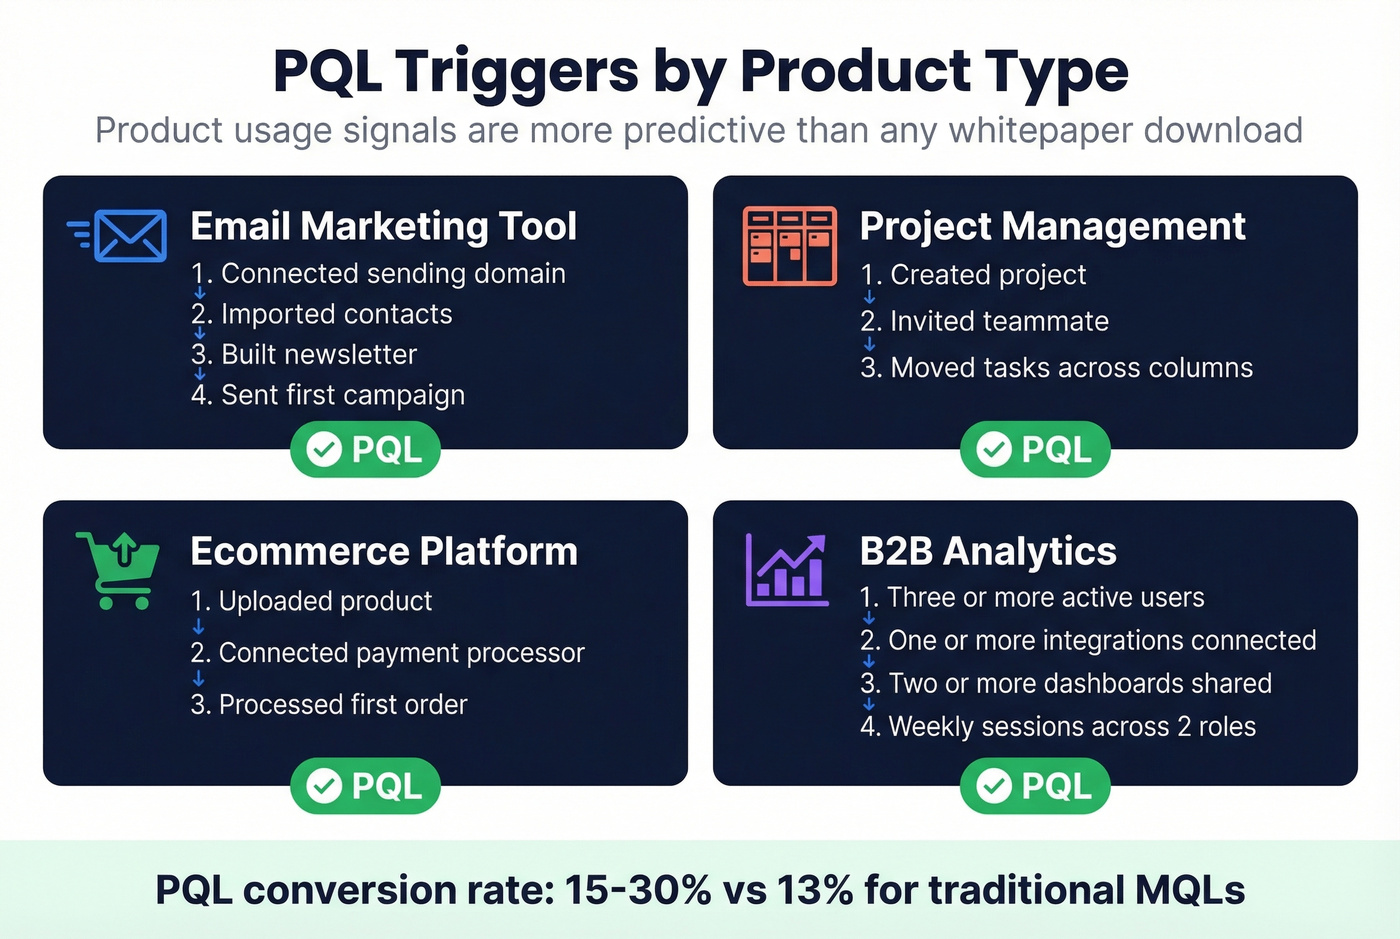
Concrete PQL triggers by product type:
- Email marketing tool: Connected sending domain + imported contacts + built newsletter + sent at least one campaign
- Project management: Created project + invited teammate + moved tasks across columns
- Ecommerce platform: Uploaded product + connected payment processor + processed at least one order
- B2B analytics: Three or more active users + at least one integration connected + two or more dashboards shared + weekly sessions across two roles in the last 14 days
Monday.com's segmentation bands offer a useful framework: 20-100 employees routes to SMB sales, 100-1,500 to mid-market, 1,500+ to enterprise. They layer product usage signals on top of these firmographic bands to create a combined MQL/PQL score.
PLG companies see 15-30% conversion rates from PQLs versus 13% from traditional MQLs. If you have a free tier or trial, you're sitting on product usage data that's more predictive than any whitepaper download.
Hot take: if your average deal size is under $15k and you have a self-serve product, PQLs should replace MQLs entirely. The behavioral data from product usage is so much richer than marketing engagement that running both systems in parallel just creates confusion.
Common MQL Mistakes
Five patterns that kill pipeline quality:
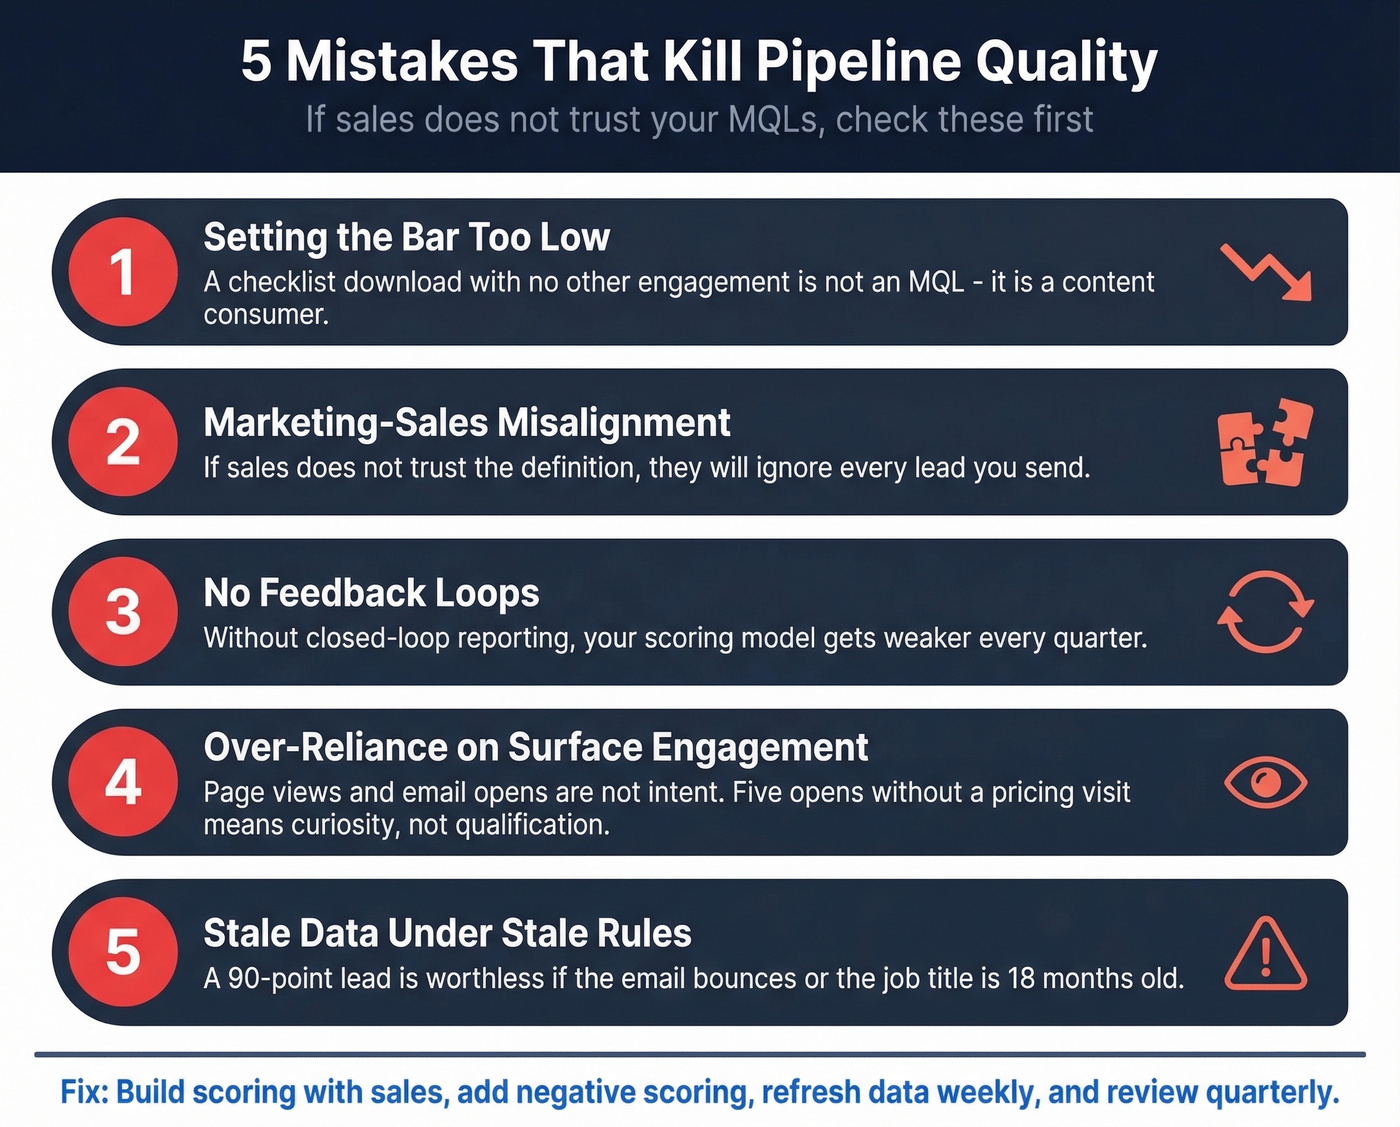
Setting the bar too low to inflate numbers. A checklist download with no other engagement isn't an MQL. It's a content consumer. Stop counting them. On r/marketing and r/sales, this is the single most common complaint - teams gaming counts with low-intent content downloads to hit quarterly targets.
Marketing-sales misalignment. If sales doesn't trust the definition, they'll ignore every lead you send. Build the scoring model together or don't bother.
No feedback loops. Without closed-loop reporting from sales back to marketing, your definition gets weaker over time. We've seen teams run the same scoring model for two years without a single update and then wonder why their SQL conversion rate dropped from 18% to 9%.
Over-reliance on surface engagement. Page views and email opens aren't intent. Someone who opens five emails but never visits pricing is curious, not qualified.
Stale data underneath stale rules. Your market evolves. Your product evolves. Your scoring definition should too. But even fresh scoring rules can't fix rotten data - if the email bounces or the job title is 18 months out of date, a 90-point lead is worthless. Prospeo's 7-day refresh cycle keeps contact records current so at least the data feeding your model stays accurate even when you're slow to update the rules.
Setting Up Scoring in Your CRM
A scoring model is only as good as the data underneath it. Here's the implementation checklist.
1. Clean and dedupe records. Dirty data costs companies roughly $96 per duplicate. In Salesforce, configure Matching Rules and Duplicate Rules before you do anything else. In HubSpot, run a contact deduplication pass.
2. Enrich lead data before routing. Plug an enrichment tool into your CRM workflow so every lead that enters scoring has current, verified data - not whatever the prospect typed into a form six months ago. Prospeo returns 50+ data points per contact at an 83% enrichment match rate, with 98% verified email accuracy.
3. Set scoring rules. HubSpot supports up to 25 scoring models with 100 filter criteria groups. Salesforce teams can use Flow to automate score calculations. Include both positive and negative criteria from day one - teams that pair structured scoring with automated routing see conversion rates jump up to 40%.
4. Automate routing with speed-to-lead in mind. Responses within one hour double connection rates. Set up workflows that automatically assign leads to reps the moment they cross threshold. This isn't optional. According to Harvard Business Review's lead response research, firms that contacted leads within an hour were nearly seven times more likely to qualify them than those that waited even 60 minutes longer. Chili Piper's speed-to-lead benchmarks confirm the pattern holds in 2026.
If you want a deeper build guide, use a lead scoring model with clear governance, and document your MQL to SQL handoff so sales knows exactly what “qualified” means.
You just built a scoring model that separates real buyers from content tourists. Now make sure every lead that crosses your 60-point threshold has a valid email and direct dial. Prospeo delivers 98% email accuracy at $0.01/lead - 90% cheaper than ZoomInfo.
Your scoring model is only as good as the data feeding it.
Are MQLs Dead?
Not dead - but overdue for an upgrade. The LinkedIn B2B Institute's 95/5 rule says 95% of buyers aren't in-market today. If your entire demand gen strategy optimizes for volume, you're ignoring the 95% who'll buy later.
Smart teams supplement MQLs with revenue-first metrics:
| Metric | Target |
|---|---|
| Marketing Efficiency Ratio | 3-5 |
| LTV:CAC | 3:1 |
| CAC Payback | Under 12 months |
| Pipeline Velocity | Improving QoQ |
Marketing qualified leads still work as an operational handoff mechanism - but only when they include negative scoring, PQL signals where applicable, and clean data feeding the model. Start by adding negative scoring and score decay to your existing model. Steal the point values from the tables above, adapt the criteria to your ICP, and calibrate quarterly.
If you're rebuilding your definition from scratch, it helps to align on marketing qualified lead criteria, then pressure-test it against your MQL to SQL conversion rate and broader B2B lead conversion rates.
FAQ
What's the difference between an MQL and an SQL?
An MQL shows marketing engagement plus demographic and firmographic fit. An SQL has been vetted by sales - they've confirmed budget, authority, need, and timeline. The handoff happens when a lead crosses your scoring threshold and a rep validates the fit in a conversation.
How many scoring criteria should a model have?
Start with 5-7 criteria that predict most conversions. More than 10 adds complexity without improving accuracy. Include at least 2-3 negative scoring rules from day one - they prevent junk leads from inflating your pipeline.
What's a good MQL-to-SQL conversion rate?
For B2B SaaS, 13% is the industry median. Below 20% usually means your definition is too loose; above 60% with low volume means it's too tight. Calibrate quarterly using closed-loop data from sales.
How does data quality affect lead scoring?
Bounced emails, outdated job titles, and stale form fills silently destroy your scoring model. A lead can score 90 points and still waste your SDR's time if the contact data is wrong. Enrichment tools that plug into your CRM workflow can verify and update records before they enter scoring - not after.
Should PLG companies use MQLs or PQLs?
PQLs. Product-led companies see 15-30% conversion rates from PQLs versus 13% from traditional MQLs. Base qualification on product usage milestones - features activated, teammates invited, integrations connected - not marketing engagement alone.