How to Run a Pipeline Audit That Actually Finds the Leaks
It's Thursday afternoon. The CRO needs the forecast for the board deck by Monday. You pull the pipeline report, stare at it for ten seconds, and instinctively knock 30% off the number before sending it upstairs. You've been doing this for three quarters straight - that gut-feel discount is your subconscious telling you the pipeline is lying, and it's time for an actual pipeline audit.
The symptoms are obvious once you look: 20%+ of deals sitting past their close dates, lifecycle stages that don't match reality, routing logic that broke months ago and nobody noticed. We've seen this pattern at every company we've audited. The consensus on r/salesops is that "structural CRM decay" gets more expensive the longer you ignore it, and they're right.
If you're here looking for CI/CD pipeline security audits, start with NIST SP 800-204D or the OWASP CI/CD Top 10. This guide covers sales pipeline audits - the revenue ops kind.
What a Pipeline Audit Checks
A real audit covers three dimensions:
- Conversion - stage-by-stage win/loss rates against benchmarks
- Coverage - pipeline value relative to quota, weighted by probability
- Velocity - how fast deals move through stages and where they stall
Layer in a fourth dimension most teams skip - data quality - and you've got a health scorecard. Run weekly pipeline reviews for deal progression, monthly hygiene passes to clean stale data, and quarterly deep audits with full benchmark comparison.
Stage-by-Stage Benchmarks
You can't audit without knowing what "good" looks like. Here are the numbers worth pinning to your wall:
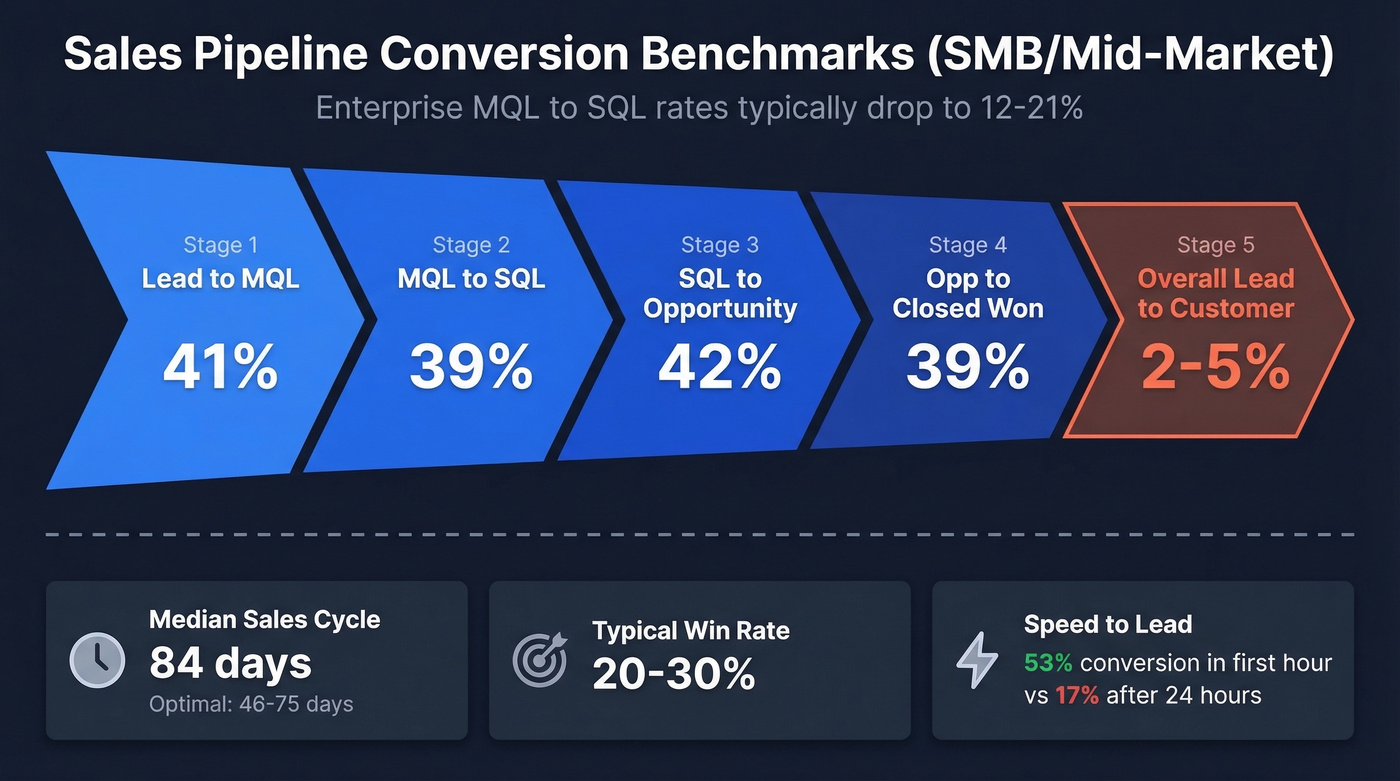
| Stage | Benchmark Conversion |
|---|---|
| Lead → MQL | 41% |
| MQL → SQL | 39% |
| SQL → Opportunity | 42% |
| Opp → Closed Won | 39% |
| Overall Lead → Customer | ~2-5% |
These are mid-funnel benchmarks for SMB/mid-market. Enterprise MQL→SQL rates often drop to 12-21%, so adjust accordingly.
Median sales cycle runs 84 days, with an optimal range of 46-75 days. Typical win rates land between 20-30%.
Channel matters more than most teams realize. SEO-sourced leads convert MQL→SQL at roughly 51%, while PPC leads convert at 26%. If your pipeline is PPC-heavy, expect lower stage conversion - and stop blaming reps for what's actually a sourcing problem.
The pipeline velocity formula is your north-star metric: (Opportunities x Avg Deal Value x Win Rate) / Sales Cycle Length. If that number trends down quarter over quarter, something's broken even if the raw pipeline total looks healthy. One stat worth auditing against: following up with an MQL within the first hour yields 53% conversion, compared to 17% after 24 hours. If your speed-to-lead is measured in days, you've found a leak before you even open the CRM.
Coverage Ratios and Why 3x Is a Myth
Pipeline coverage ratio is simple: total pipeline value divided by your revenue target.
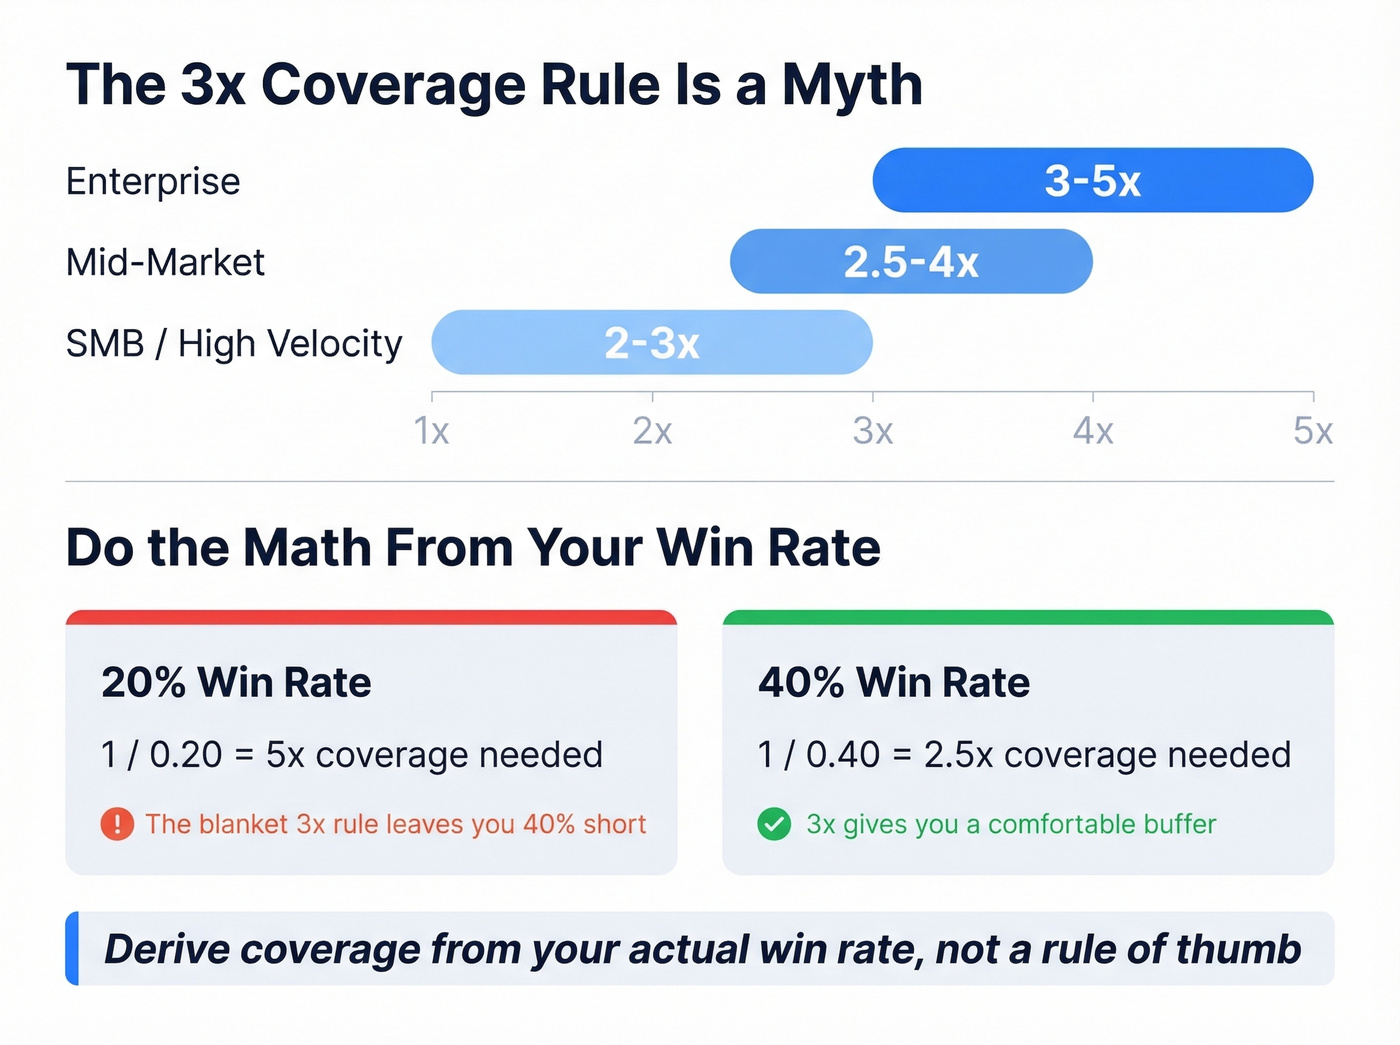
| Segment | Target Coverage |
|---|---|
| Enterprise | 3-5x |
| Mid-market | 2.5-4x |
| SMB / high-velocity | 2-3x |
Here's the thing: the "you need 3x coverage" rule that gets repeated in every sales playbook is a myth. Do the math from your actual win rate. If you're closing 20% of opportunities, you need 5x coverage just to hit quota. A team with a 40% win rate only needs 2.5x. In our experience, teams that derive coverage from win rate outperform those using the blanket 3x rule by a wide margin.
Unweighted coverage is dangerous. It treats every deal as 100% likely to close. Weighted coverage - multiplying deal value by stage probability - is more accurate, but only if your CRM stages reflect reality. Otherwise you're building a more precise version of a wrong number.
Your coverage ratio is only as real as the contacts behind it. If 20% of your pipeline is built on outdated emails and wrong numbers, your weighted coverage is fiction. Prospeo's 7-day data refresh and 98% email accuracy mean every deal in your CRM connects to a real buyer - not a bounced inbox.
Stop discounting your forecast. Start with data you can trust.
How to Conduct the Inspection
Step 1: Define scope and cadence. Are you auditing the full pipeline or a single segment? Set the rhythm - weekly reviews, monthly hygiene, quarterly deep dives.
If you want a clean operating rhythm, treat this like a lightweight QBR for pipeline health.
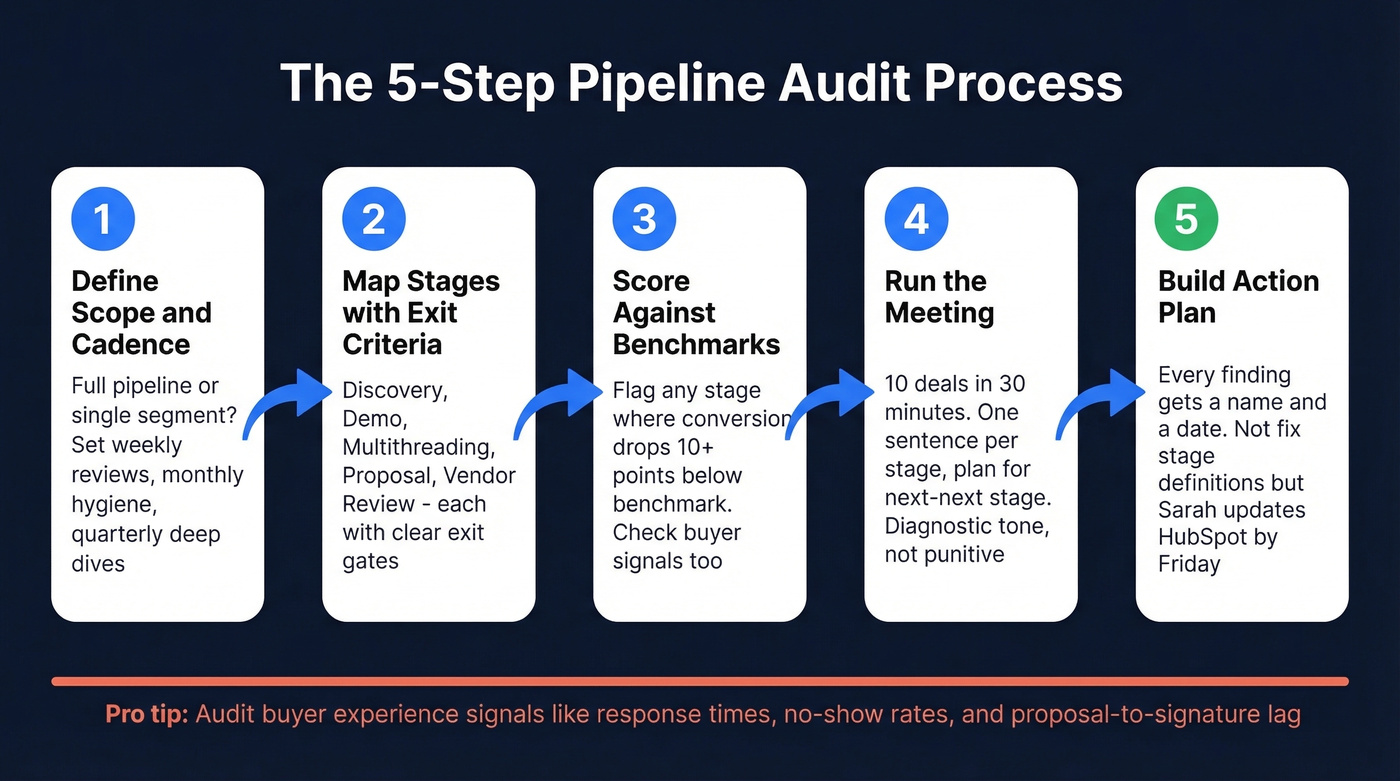
Step 2: Map stages with exit criteria. Borrow the 30MPC stage model: Discovery (qualified persona + problem agreement), Demo (solution agreement), Multithreading (problem-solution agreement from power), Proposal (agreement the problem is worth the price), Vendor Review (legal/security done, signed contract). If reps can't articulate the exit criteria, the stage is meaningless.
Step 3: Pull CRM data and score against benchmarks. Compare your actual conversion rates, cycle times, and coverage ratios against the benchmarks above. Flag any stage where conversion drops more than 10 points below benchmark. Don't just audit seller metrics - check buyer experience signals like response times, meeting no-show rates, and proposal-to-signature lag.
This is also where a simple lead scoring model can help you separate real deals from noise.
Step 4: Run the meeting - 10 deals in 30 minutes. Each rep gives one sentence per stage, then outlines their plan for the next-next stage. Manager questions focus on risk in exit criteria and risk in the plan. Keep the tone diagnostic, not punitive. Reps who fear blame will hide stalled deals, and your audit data becomes fiction. Use MEDDIC for enterprise qualification, BANT for SMB.
Step 5: Build an action plan with owners and deadlines. Every finding needs a name and a date. "Fix stage definitions" isn't an action item. "Sarah updates HubSpot stage properties with exit criteria by Friday" is. Pay special attention to missed pipeline opportunities - deals that stalled without a clear next step or contacts that were never followed up on. These are often the highest-ROI fixes because the lead already expressed intent.
If follow-up is a recurring leak, standardize it with sales follow-up templates so reps stop reinventing the wheel.
Most CRMs won't alert you to stale deals out of the box. Build that automation yourself, or you'll be rediscovering the same zombie opportunities every quarter.
Build a Pipeline Health Scorecard
We've used this scorecard model across dozens of audits, and it's the single most useful artifact you can produce. The composite formula:
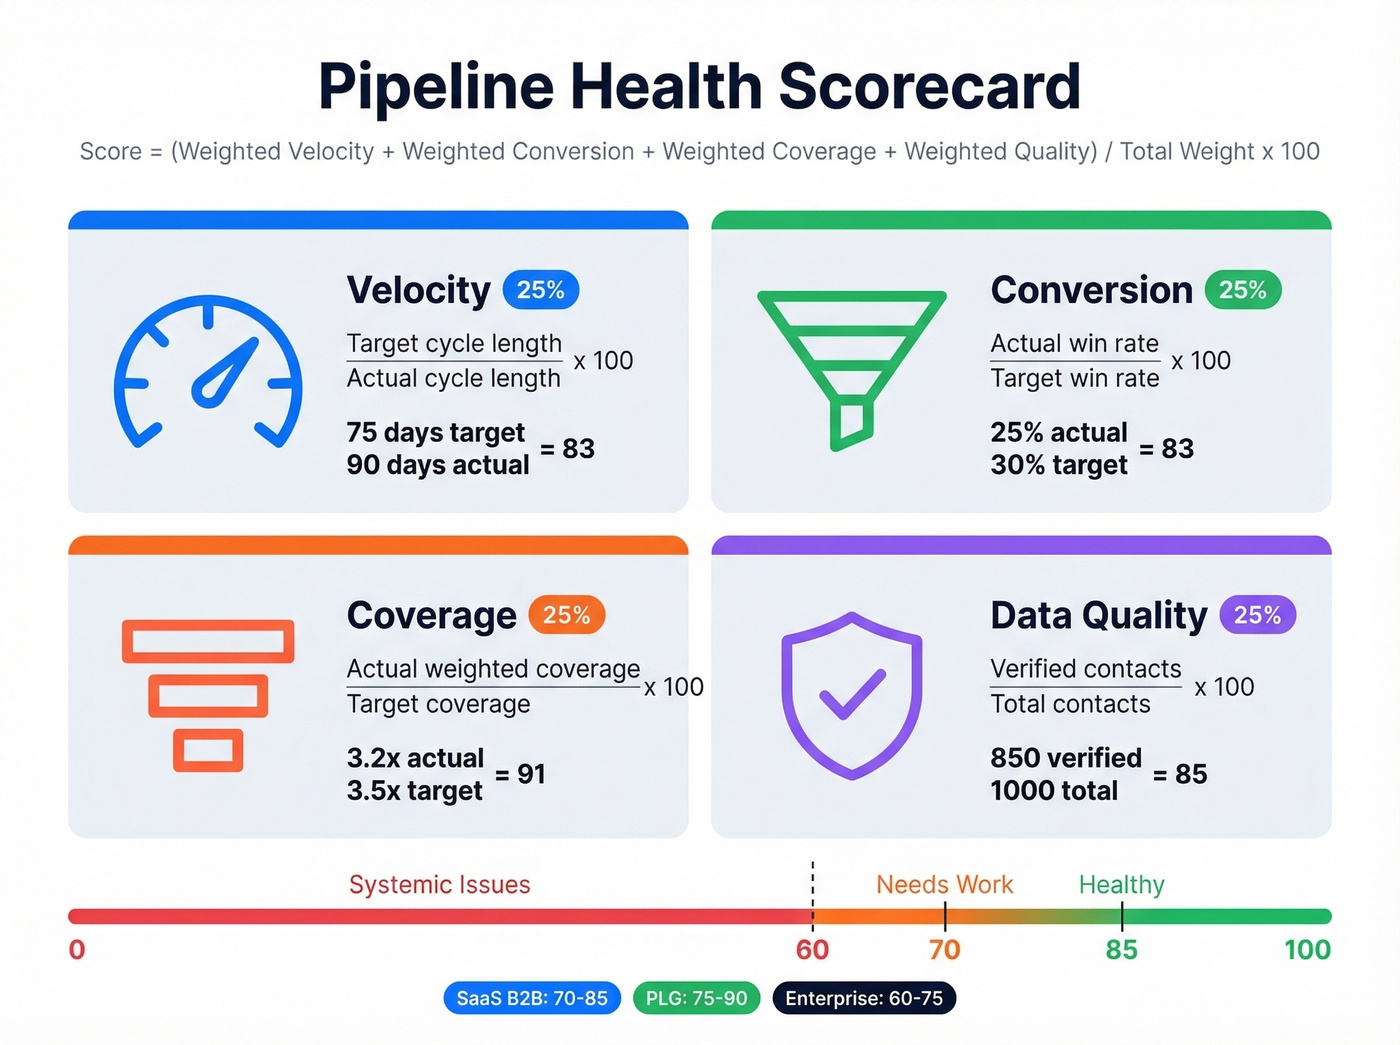
Pipeline Health Score = (Weighted Velocity + Weighted Conversion + Weighted Coverage + Weighted Quality) / Total Weight x 100
Calculate each component as a ratio of target to actual. Velocity score = target cycle length / actual cycle length x 100. Conversion score = actual win rate / target win rate x 100. Coverage score = actual weighted coverage / target coverage x 100. Quality score = verified contacts / total contacts x 100.
Default weighting is 25% per dimension. Adjust based on your model - enterprise teams should weight quality higher because bad deals waste months, while transactional teams should weight velocity. Here's a quick reference for target scores:
| Business Model | Target Score |
|---|---|
| SaaS B2B | 70-85 |
| PLG / self-serve | 75-90 |
| Enterprise sales | 60-75 |
Score below 60? You've got systemic issues across multiple dimensions. Don't try to fix everything at once. Pick the lowest-scoring dimension and attack it first.
If you want a deeper set of leading indicators, use a dedicated pipeline health metric set alongside this score.
The Metric Nobody Audits: Data Quality
Most teams audit deals but never audit the data underneath them. Bad emails and disconnected phone numbers create phantom opportunities - contacts who look real in the CRM but will never respond. That inflates your pipeline, breaks your forecast, and wastes rep time on outreach that bounces.
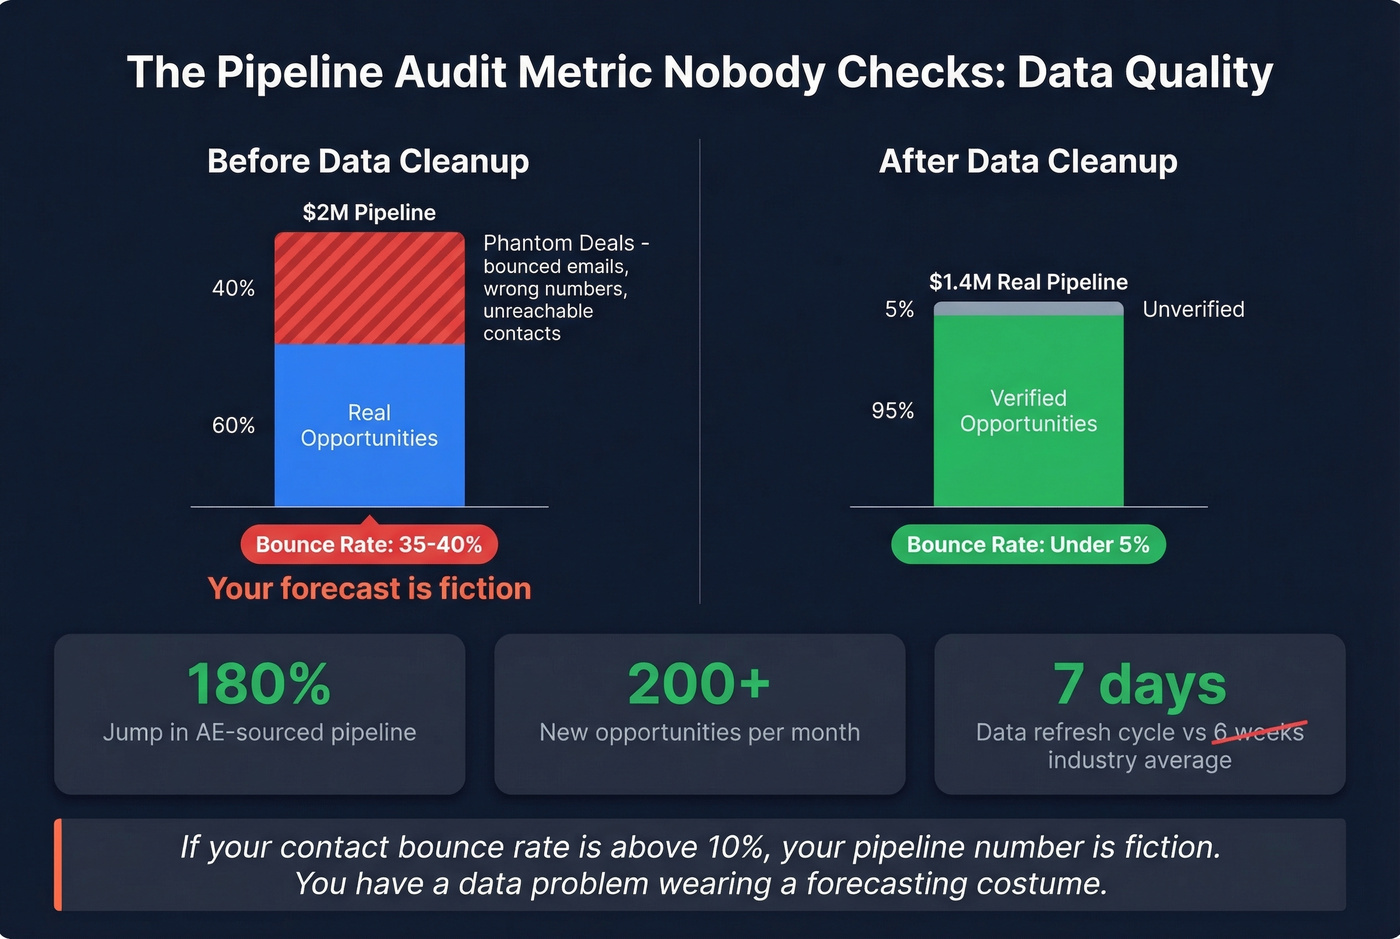
Let's be honest: if your contact bounce rate is above 10%, your pipeline number is fiction. Full stop. You don't have a forecasting problem. You have a data problem wearing a forecasting costume.
Snyk ran into exactly this - bounce rates running 35-40% across their outbound pipeline. After cleaning their contact data with Prospeo, bounces dropped to under 5%, AE-sourced pipeline jumped 180%, and the team generated 200+ new opportunities per month. That's what happens when you stop auditing phantom deals and start auditing real ones. A 7-day data refresh cycle means records stay current between audits, compared to the 6-week industry average that lets decay creep back in almost immediately.
If you're trying to diagnose the root cause, start by tracking and fixing your email bounce rate before you touch stage probabilities.

Skip the data quality dimension if your pipeline is entirely inbound with double opt-in. For everyone else - especially outbound-heavy teams - it's the dimension that makes or breaks your scorecard.
The quality dimension of your scorecard - verified contacts divided by total contacts - is the metric most teams score lowest on. Prospeo returns 50+ verified data points per contact at a 92% match rate. Enrich your entire CRM in one pass and watch that quality score jump.
Run your pipeline on 300M+ verified profiles instead of CRM decay.
FAQ
How often should you run a pipeline audit?
Run weekly reviews for deal progression, monthly passes for data hygiene, and quarterly deep dives for full benchmark comparison and health scoring. Teams with deal cycles under 30 days can shift the deep dive to monthly.
What's a good pipeline health score?
B2B SaaS teams should target 70-85. PLG models trend 75-90. Enterprise orgs typically land 60-75 due to longer cycles and fewer deals. Below 60 signals systemic issues across multiple dimensions.
What are the most common missed pipeline opportunities?
Slow follow-up on inbound leads, mid-funnel deals stalled without a scheduled next step, and contacts with invalid data who never receive outreach. A thorough audit surfaces all three and quantifies the revenue left on the table.
How do you fix bad contact data in your pipeline?
Run your CRM contacts through a verification and enrichment tool that returns 50+ data points per record. This tells you which deals have reachable buyers and which are dead ends inflating your forecast. Look for 98%+ email accuracy and a match rate above 90% on your API enrichment - anything less and you're just replacing one data problem with another.