QBR Best Practices That Actually Keep Executives in the Room
Most QBRs fail for a boring reason: they're built like a status meeting, then presented like a hostage situation. 72% of senior executives believe QBRs are a waste of time when there's too much information, meetings run long, and everything stays tactical instead of decision-driven. Meanwhile, only 1 in 26 unhappy customers complain before churning - which means "we didn't see it coming" is the most common post-mortem in CS. Nailing QBR best practices is the fastest way to fix both problems.
The upside is just as stark. Firms running consistent quarterly business reviews report 33% higher expansion revenue and net retention rates 15-20 points higher than those winging it. Getting this right isn't a nice-to-have - it's the cheapest growth lever most CS teams ignore.
The Essentials at a Glance
- Cut your deck to 8 slides max. Lead with an executive summary, not a data dump.
- Include a "So What?" slide connecting last quarter's numbers to next quarter's decisions.
- Send a recap with owners and deadlines within 24-48 hours - that's where the value gets locked in.
Internal vs. Customer QBRs
These get confused constantly, and that confusion is how you end up "presenting" instead of aligning.
| Dimension | Internal QBR | Customer QBR |
|---|---|---|
| Primary goal | Performance vs. goals | Value + next steps |
| Attendees | CS/Sales/Mktg/Prod/Exec | Vendor + customer team |
| Tone | Honest diagnosis | Outcome + alignment |
| Typical outputs | Priorities + resourcing | Renew/expand plan |
| Cadence | Quarterly | Tier-based cadence |
QBRs are quarterly and operational; EBRs happen 1-2x/year with C-level for strategic direction. Run both (and if you need a clean breakdown, see QBRs are quarterly and operational). For segmentation, ConnectWise's ABCD model is the cleanest way to decide who gets the full treatment. Their pricing heuristic - cost the QBR, double it, divide by three to get the minimum account value worth a live review - is a practical filter nobody else talks about.
The 8-Slide Deck Structure
This is the "insight-first" structure adapted from WinningPresentations' QBR template and informed by Gong's 9-part agenda - distilled to 8 slides that force decisions faster. We've tested variations in real reviews, and the win is simple: executives stay engaged because every slide earns its spot.
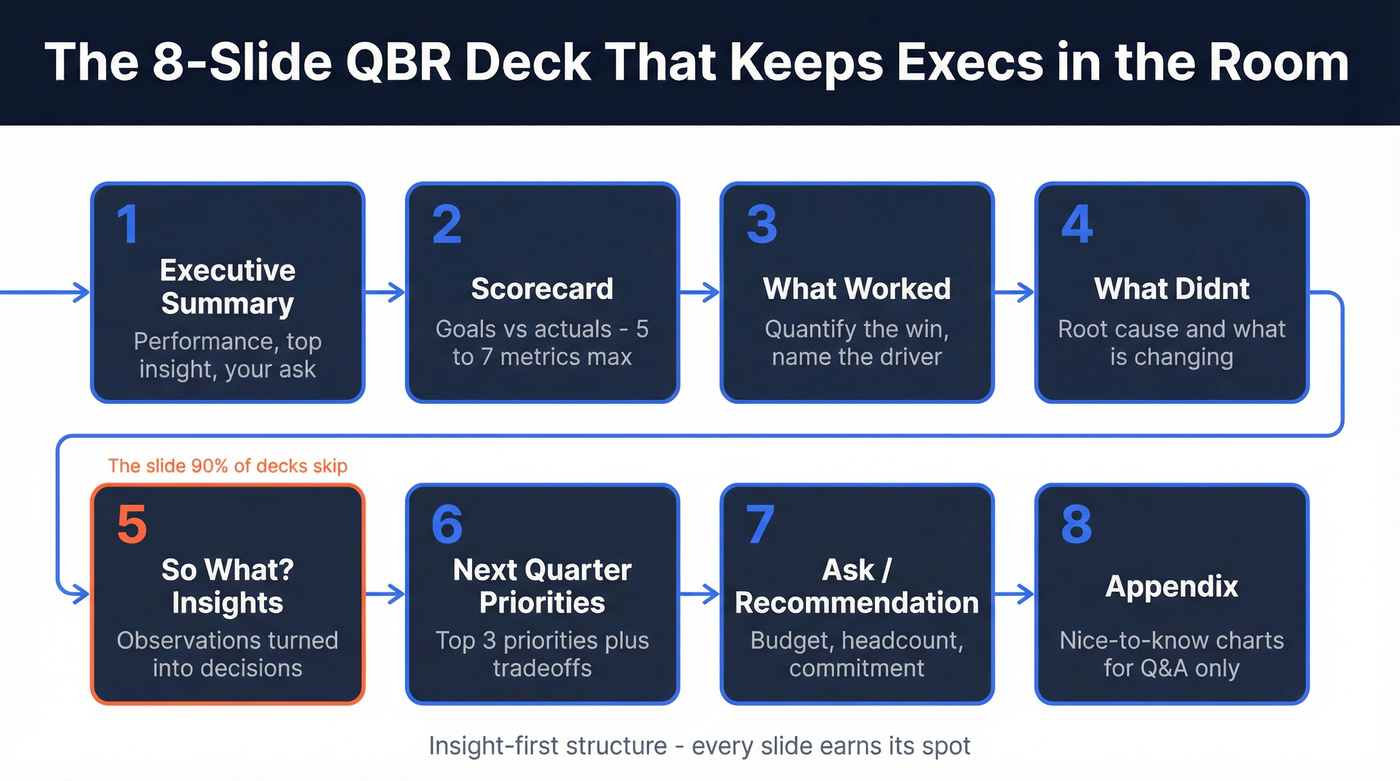
- Executive Summary - One sentence on performance, the single biggest insight, and your ask.
- Scorecard (Goals vs. Actuals) - A scannable table: Metric | Target | Actual | Variance | Status. Five to seven metrics max.
- What Worked - Quantify the win, name the driver, state what you'll repeat.
- What Didn't - Quantify the miss, give the root cause, show what's changing.
- "So What?" Insights - The slide 90% of decks skip. Three to four bullets translating observations into decisions.
- Next Quarter Priorities - Top 3 priorities and what you're deprioritizing. Executives love tradeoffs.
- Ask / Recommendation - Budget, headcount, product commitment. Be explicit.
- Appendix - "Nice to know" charts for Q&A, not the main event.
Free starting points: SlidesCarnival has 25 layouts under Creative Commons, and Slidesgo has 23 slides free with attribution. The full WinningPresentations system is £39 one-time.
Your QBR scorecard is useless if it's built on stale contacts. Churn jumps to 25% when a decision-maker leaves - and most teams don't catch it until the review. Prospeo's 7-day data refresh cycle updates job changes, titles, and emails across your accounts automatically, so slide 1 never starts with an awkward correction.
Stop presenting QBR decks addressed to people who already left.
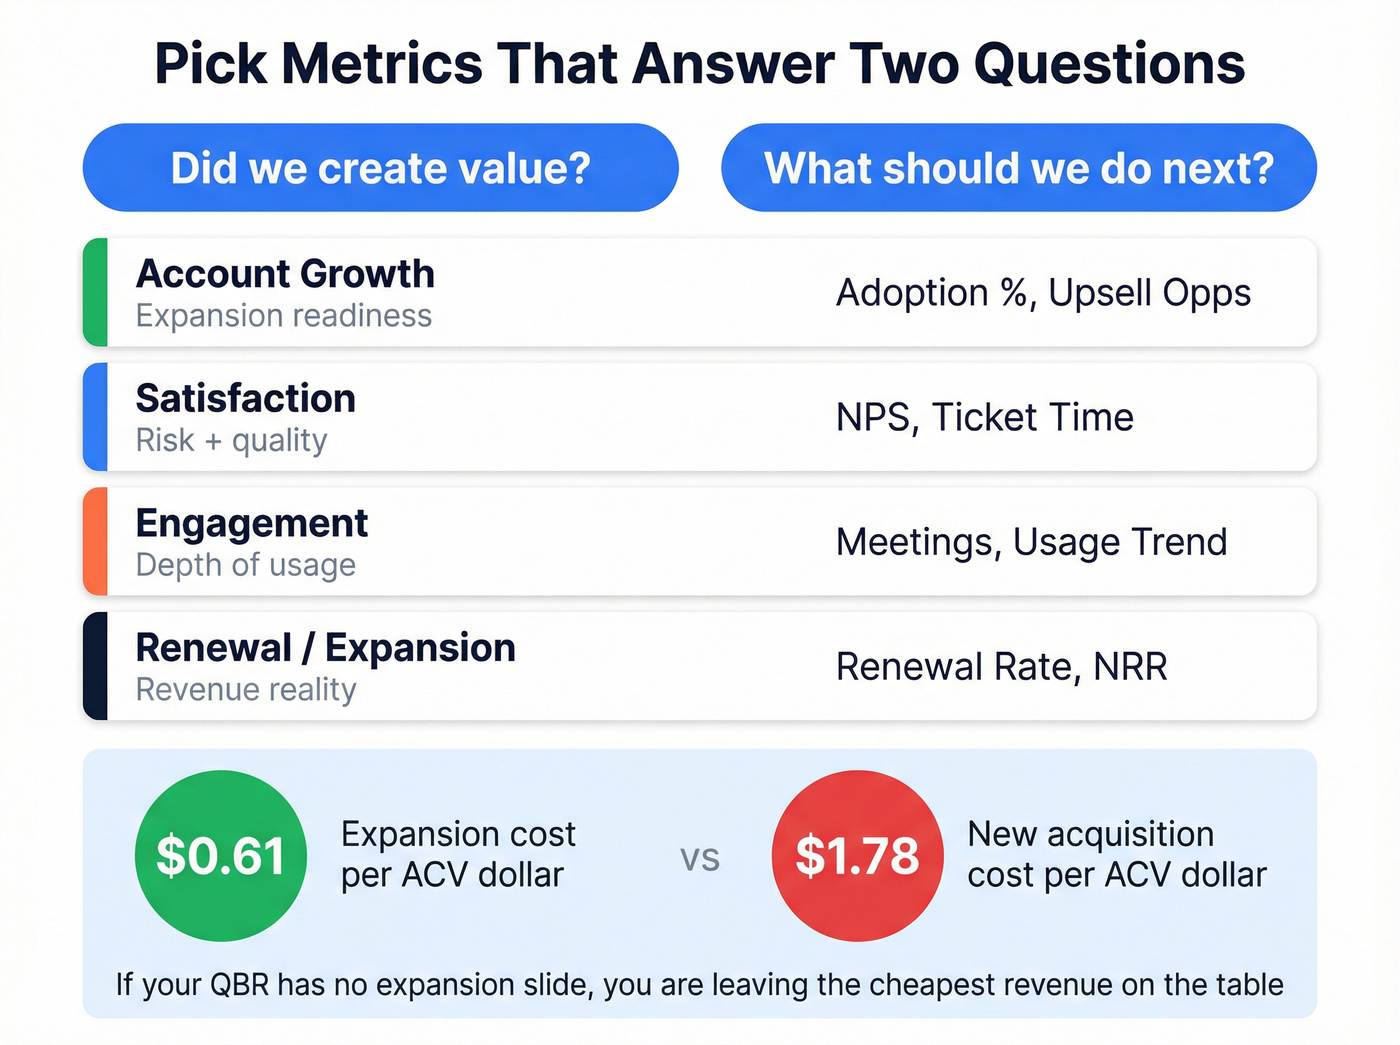
Choosing the Right Metrics
Pick metrics that answer two questions: "Did we create value?" and "What should we do next?"
| Function | What to show | Examples |
|---|---|---|
| Account growth | Expansion readiness | Adoption %, upsell opps |
| Satisfaction | Risk + quality | NPS, ticket time |
| Engagement | Depth of usage | Meetings, usage trend |
| Renewal/expansion | Revenue reality | Renewal rate, NRR |
For marketing-led QBRs, start the quarter with 3.0x pipeline coverage as a benchmark, track marketing-sourced pipeline, and show conversion using trailing-twelve-month rates so you're not whiplashing on seasonal noise every quarter (more on keeping this clean in pipeline coverage).
Expansion signals deserve special attention. NRR, expansion-pipeline velocity, and account-penetration progression all connect directly to revenue. Here's the stat that should scare every CS leader: churn jumps to 25% when the decision-maker leaves an account, versus 8% when they stay. If your CRM hasn't caught the change, you won't know until the review. Tools like Prospeo that run CRM enrichment on a 7-day refresh cycle catch job changes before your next QBR - so your deck isn't addressed to someone who left three months ago.
Expansion costs roughly $0.61 per ACV dollar versus $1.78 for new acquisition. If your QBR doesn't have an expansion slide, you're leaving the cheapest revenue on the table (and it’s worth pairing this with a simple churn analysis view so you’re not expanding into risk).
Mistakes That Kill Executive Buy-In
The biggest QBR killer is deck sprawl - and reading every number aloud. Cap at 8 slides plus an appendix. Twenty slides in and the CFO says "skip ahead," you've already lost.
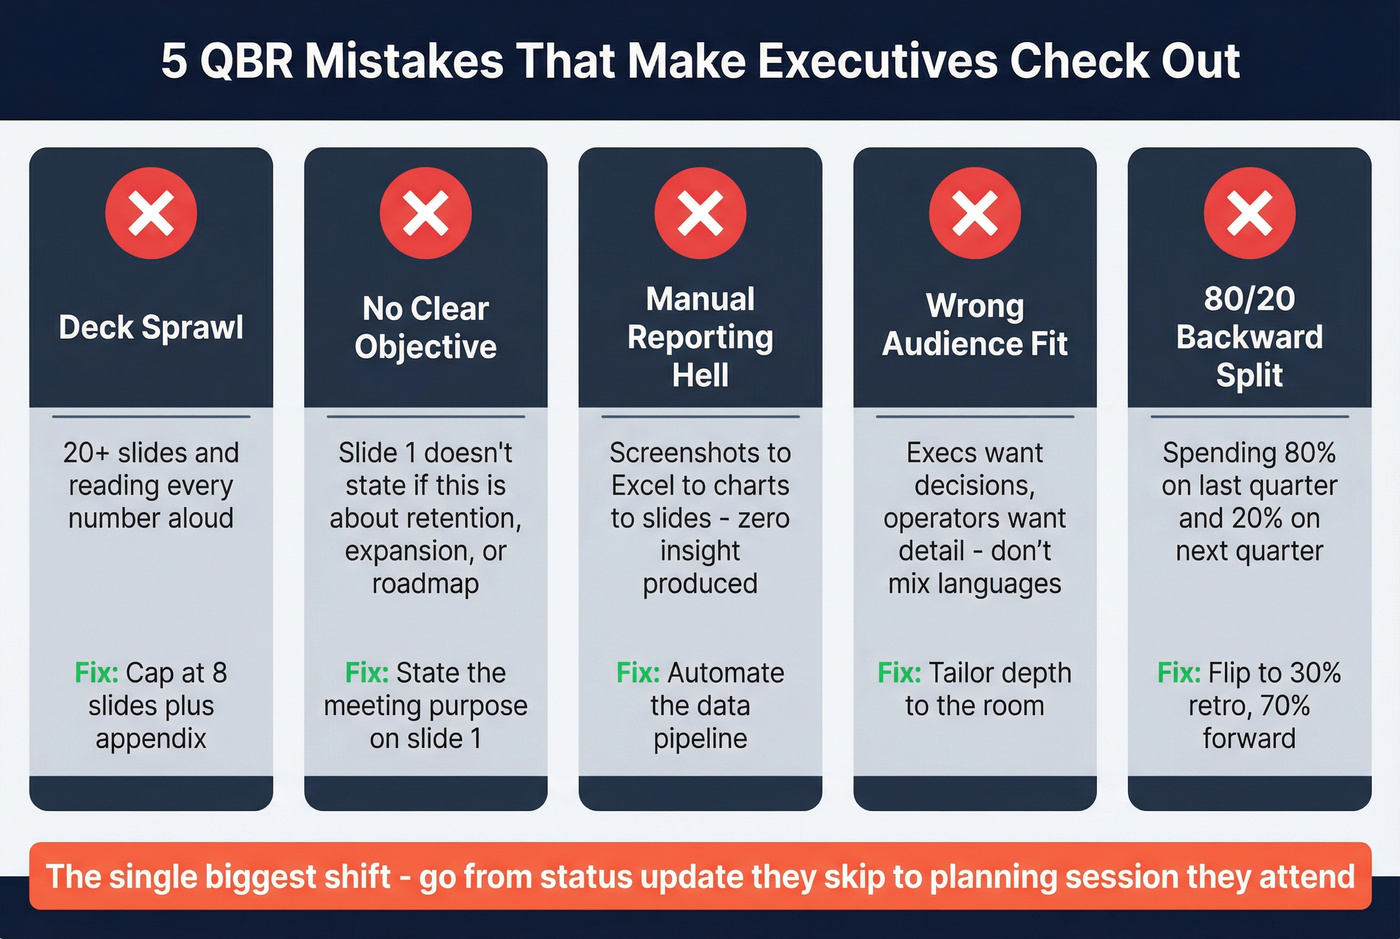
Right behind it is the missing objective. If slide 1 doesn't state whether this meeting is about retention, expansion alignment, or roadmap buy-in, you'll drift into a conversation nobody prepared for (if you need a tighter framing, borrow a few from QBR prompts).
Manual reporting hell is the next offender. Screenshots into Excel into charts into slides - the consensus on r/CustomerSuccess is that this is the biggest self-inflicted time sink in CS, and they're right. Automate the pipeline or accept that half your prep time produces zero insight. Equally damaging: not tailoring to the audience. Execs want decisions and tradeoffs; operators want detail. Don't speak a different language than the room (this is the same principle behind strong sales deck storytelling).
Let's be honest about the most common structural mistake. Most decks spend 80% of their time on last quarter and 20% on next quarter. Flip it: 30% retrospective, 70% forward-looking plan and risks. That single shift changes executive perception from "status update I can skip" to "planning session I need to attend." And always follow through - owners plus deadlines within 48 hours, tracked like a project, not a recap email nobody reads.
The 48-Hour Post-QBR Checklist
This is where the value lives. Skip it and you're just hosting meetings.
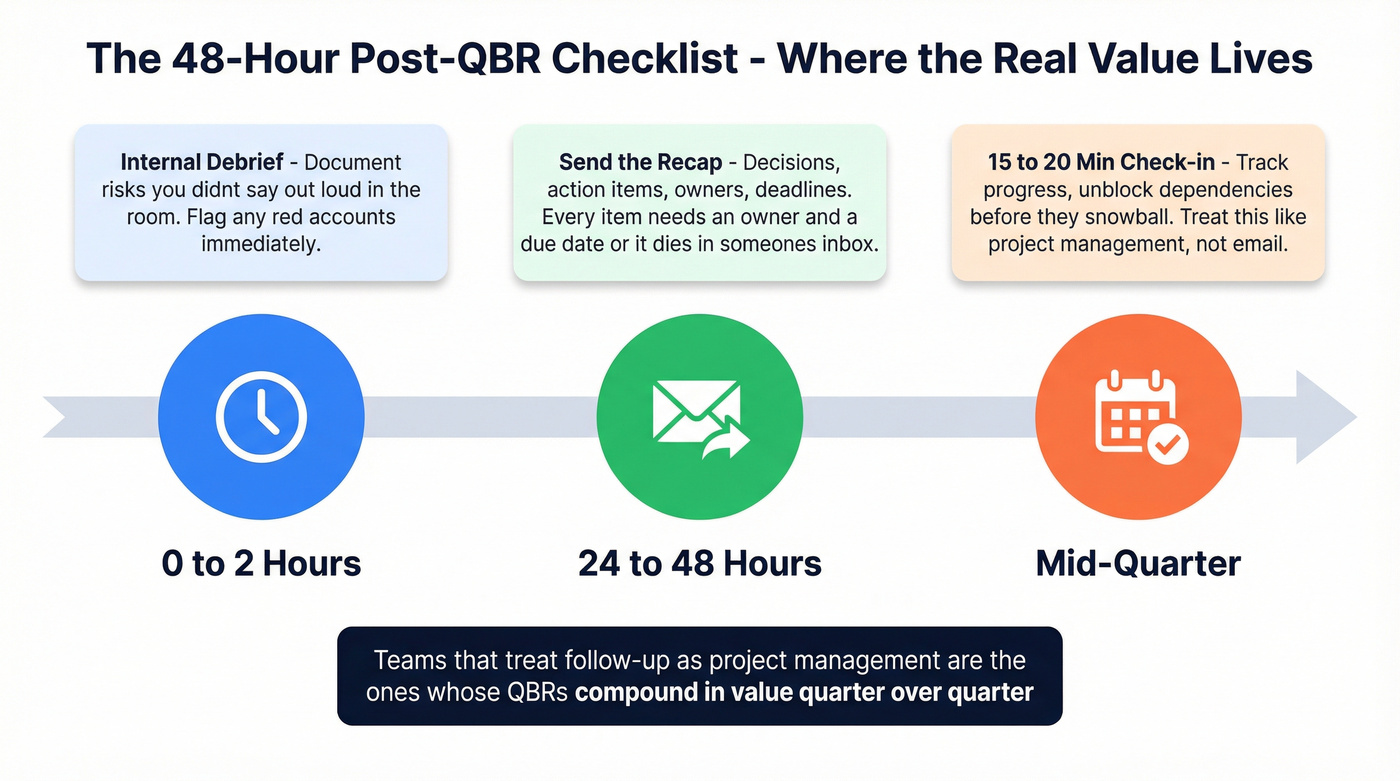
- Send the recap within 24-48 hours: decisions, action items, owners, deadlines. No exceptions.
- Debrief internally immediately: document risks you didn't say out loud in the room.
- Schedule a mid-quarter check-in: 15-20 minutes to track progress and unblock dependencies before they snowball.
In our experience, the teams that treat post-QBR follow-up as a project management exercise - not an email exercise - are the ones whose QBRs actually compound in value quarter over quarter. Every action item needs an owner and a due date, or it's just a suggestion that dies in someone's inbox (a lightweight sales meeting follow-up email structure helps keep this crisp).
Expansion costs $0.61 per ACV dollar vs $1.78 for new logos - but only if your QBR targets the right stakeholders. Prospeo enriches your CRM with 50+ data points per contact at a 92% match rate, giving you verified emails and direct dials for every new champion and budget holder before the meeting even starts.
Turn your expansion slide into booked meetings for $0.01 per email.
FAQ
What's the difference between a QBR and an EBR?
QBRs are quarterly and operational - covering adoption, roadblocks, and next-quarter priorities with working-level stakeholders. EBRs run 1-2x/year with C-level executives for strategic direction and long-term alignment. High-value accounts should get both.
How long should a QBR last?
45-60 minutes max. If you need more, your deck is too long. Cut slides to eight plus an appendix and protect at least 15 minutes for open discussion - that's where the real decisions surface.
Which customers deserve a live QBR?
Top-tier accounts (typically $50K+ ARR) get quarterly live reviews, mid-tier biannually, and lowest-tier accounts receive async summaries. Segment by revenue, churn risk, and expansion potential - ConnectWise's ABCD model gives you a clean framework for this.
How do I keep stakeholder data accurate between reviews?
Churn jumps to 25% when a decision-maker leaves undetected. Use CRM enrichment tools with short refresh cycles to catch job changes before your next review. A 7-day refresh cadence is the current gold standard.
Why should QBRs be forward-looking instead of retrospective?
Spending 70% of the conversation on next-quarter priorities, risks, and resource asks is what executives need to make decisions. A backward-looking deck signals "report card." A forward-looking one signals "planning session I need to attend." That shift alone improves attendance and engagement.