Revenue Forecast Templates That Actually Work
Your CEO asks "what if growth slows 20%?" and the spreadsheet breaks. Not metaphorically - the formulas actually return errors because nobody built scenario logic into the model. You paste in a new growth rate, three circular references fire, and suddenly Q3 revenue is negative $400,000.
Most teams working from a revenue forecast template they downloaded hit this wall within a quarter. Only 7% of sales organizations achieve 90%+ forecast accuracy, and a big reason is that the underlying models weren't built to handle the questions leadership actually asks.
What You Need Before Picking a Template
Most revenue forecasting templates floating around are blank spreadsheets with column headers. Before you pick one, nail three things:
- Right structure for your business model. A SaaS template with MRR/churn rows is useless for an agency billing retainers. Model-specific templates are below - SaaS, PLG, services, and ecommerce.
- Scenario analysis built in. If your template can't toggle between conservative, base, and optimistic cases without breaking, it's a liability.
- Realistic accuracy expectations. Median B2B forecast accuracy sits at 70-79%. Knowing that upfront changes how you build and how often you update.
Forecast accuracy depends heavily on pipeline data quality. The best methodology in the world can't fix a CRM full of outdated contacts and dead email addresses.
Revenue Forecast vs Sales Forecast vs Financial Projection
These terms get used interchangeably, but they serve different audiences.
| Revenue Forecast | Sales Forecast | Financial Projection | |
|---|---|---|---|
| Scope | All income streams | Pipeline deals only | Full P&L + balance sheet |
| Audience | CEO, CFO, board | VP Sales, CRO | Investors, lenders |
| Horizon | 12-24 months | Quarter or rolling | 3-5 years |
| Inputs | Subscriptions, services, usage, renewals | Rep pipeline, stage data | Revenue + costs + capex |
Building a board deck? You need a revenue forecast. Running a weekly commit call? That's a sales forecast. Raising a Series B? Full financial projections. The revenue forecast should feed into the third.
Forecasting Methods Compared
The right method depends on your data maturity and how much historical data you have.
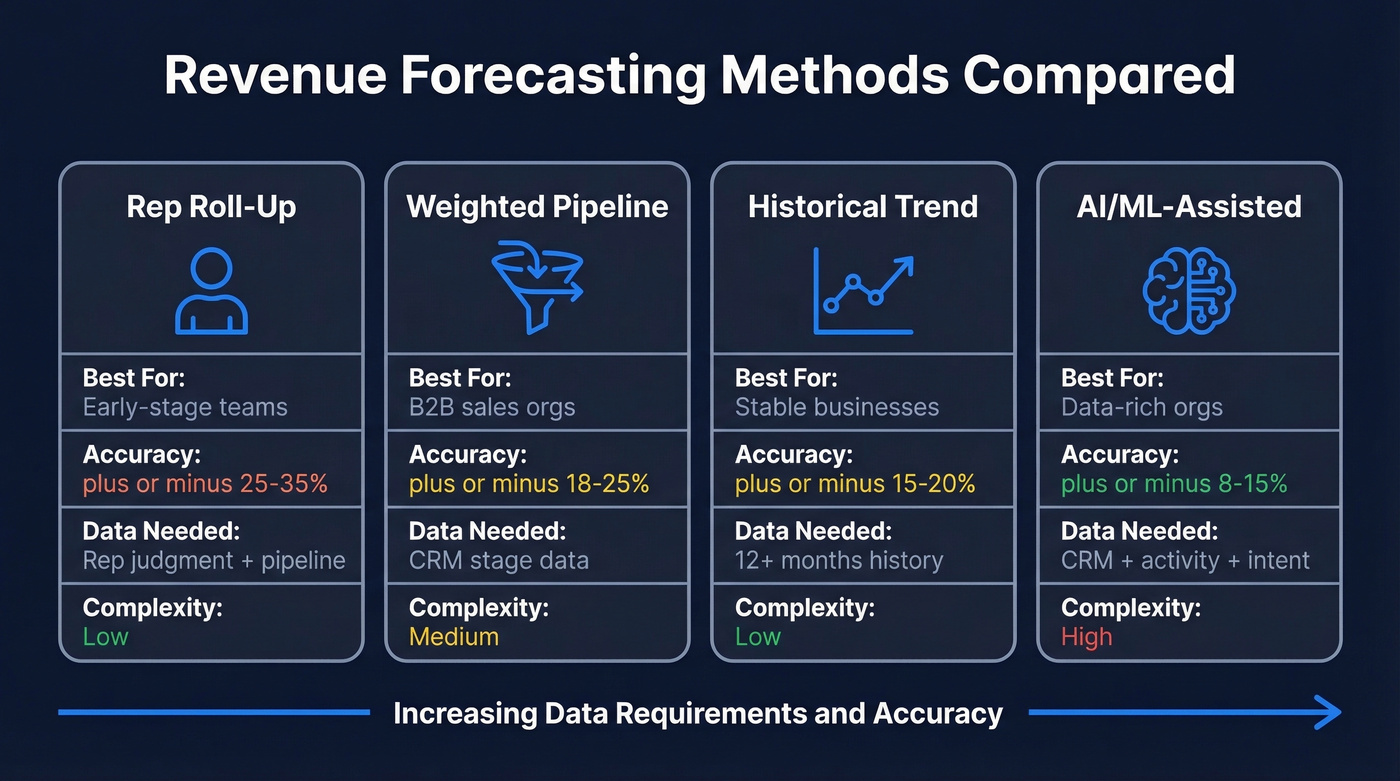
| Method | Best For | Accuracy Range | Data Required | Complexity |
|---|---|---|---|---|
| Rep roll-up | Early-stage teams, quick commits | +-25-35% | Rep judgment + pipeline | Low |
| Weighted pipeline | B2B sales orgs | +-18-25% | CRM stage data | Medium |
| Historical trend | Stable businesses | +-15-20% | 12+ months of data | Low |
| AI/ML-assisted | Data-rich orgs | +-8-15% | CRM + activity + intent | High |
The core formula for pipeline-weighted forecasting:
Forecast = S (Deal Value x Stage Probability %)
To calculate stage probability from your own data: (Deals Won from Stage / Total Deals That Reached Stage) x 100. Don't use generic probability tables you found online - your conversion rates are specific to your market, deal size, and sales cycle.
Use rep roll-up when you need a fast commit number and don't have consistent historical conversion data. Use weighted pipeline when your CRM data is clean and stage definitions are consistent. Use historical trend when the business is stable and you have enough history to extrapolate. Use AI/ML-assisted when you've got at least 12+ months of CRM history plus activity signals - and don't overlook unstructured "dark data" like call transcripts and email threads, which contain predictive signals most models ignore.
A former HSBC finance director put it well: "Forecasting is all about correlations... forecasting is just an algebra on top of that." The method matters less than the quality of inputs.
Projected Revenue Templates by Business Model
A SaaS company and an ecommerce brand have almost nothing in common when it comes to revenue drivers. Here's what each template needs - and where to grab a free one.
Free templates worth downloading: Gong's revenue forecast template is the best starting point for B2B pipeline forecasting. Smartsheet's template library covers multiple models. SCORE offers a free Financial Projections template on SCORE.org - it's a full projections workbook, not just a simple 12-month revenue sheet. Download one that matches your model below, then customize it.
SaaS / Subscription
The r/SaaS community nails the core pain: spreadsheets break the moment you add a second pricing tier alongside pay-as-you-go credits. If your template doesn't handle hybrid pricing from day one, you'll rebuild it within a quarter.
Key drivers are MRR, churn rate, CAC, LTV, and net revenue retention. Structure it as a 24-month projection with monthly columns. Each pricing tier gets its own row for new customers, churned customers, and expansion revenue. Build in a scenario multiplier - 0.5x conservative, 1x base, 1.5x optimistic - against your growth assumptions. This keeps the model intact when someone asks "what if growth slows?"
PLG / Usage-Based
Imagine you're a product-led company where 10,000 users sign up monthly but only 3% convert to paid - and of those, half expand their usage within 90 days. Your template needs to model that entire funnel: signups to free-to-paid conversion to expansion plus usage revenue.
Separate subscription revenue from usage-based revenue because they grow on different curves. The Drivetrain template structure is a solid reference - it models new logo acquisition from historical signups and conversion rates, then layers churn and usage-based expansion. Include a dashboard tab showing ending MRR, net MRR change, and the subscription vs. usage split.
Services / Agency
Services forecasting is uniquely difficult because of project variability and mixed billing. The core formula: Billable Hours x Utilization Rate x Blended Rate.
Build separate projections for retainer clients and project pipeline, then combine them. NetSuite's research shows most companies miss their sales forecasts by more than 5%. One mistake we see constantly: being too conservative. Agencies that sandbag every estimate end up under-hiring and missing growth windows. Build two sets of projections - aggressive and conservative - and present both. Don't average them into a single number that makes everyone comfortable and nobody accountable.
Ecommerce
This is pure conversion math: Sessions x Conversion Rate x AOV x (1 + Repeat Rate) - Returns. The template needs a channel mix tab because paid search traffic converts differently than organic or email.
Include seasonality adjustments by month - ecommerce revenue can swing 40-60% between peak and trough. Build in a returns adjustment, typically 15-30% for apparel and 5-10% for electronics, because gross revenue and net revenue tell very different stories.
How to Build a 12-Month Revenue Forecast
Most real-world forecasts aren't built from templates - they're inherited files that evolved over years, often with 47 tabs and zero documentation. The structure below gives you a clean starting point that won't become the next monster spreadsheet.
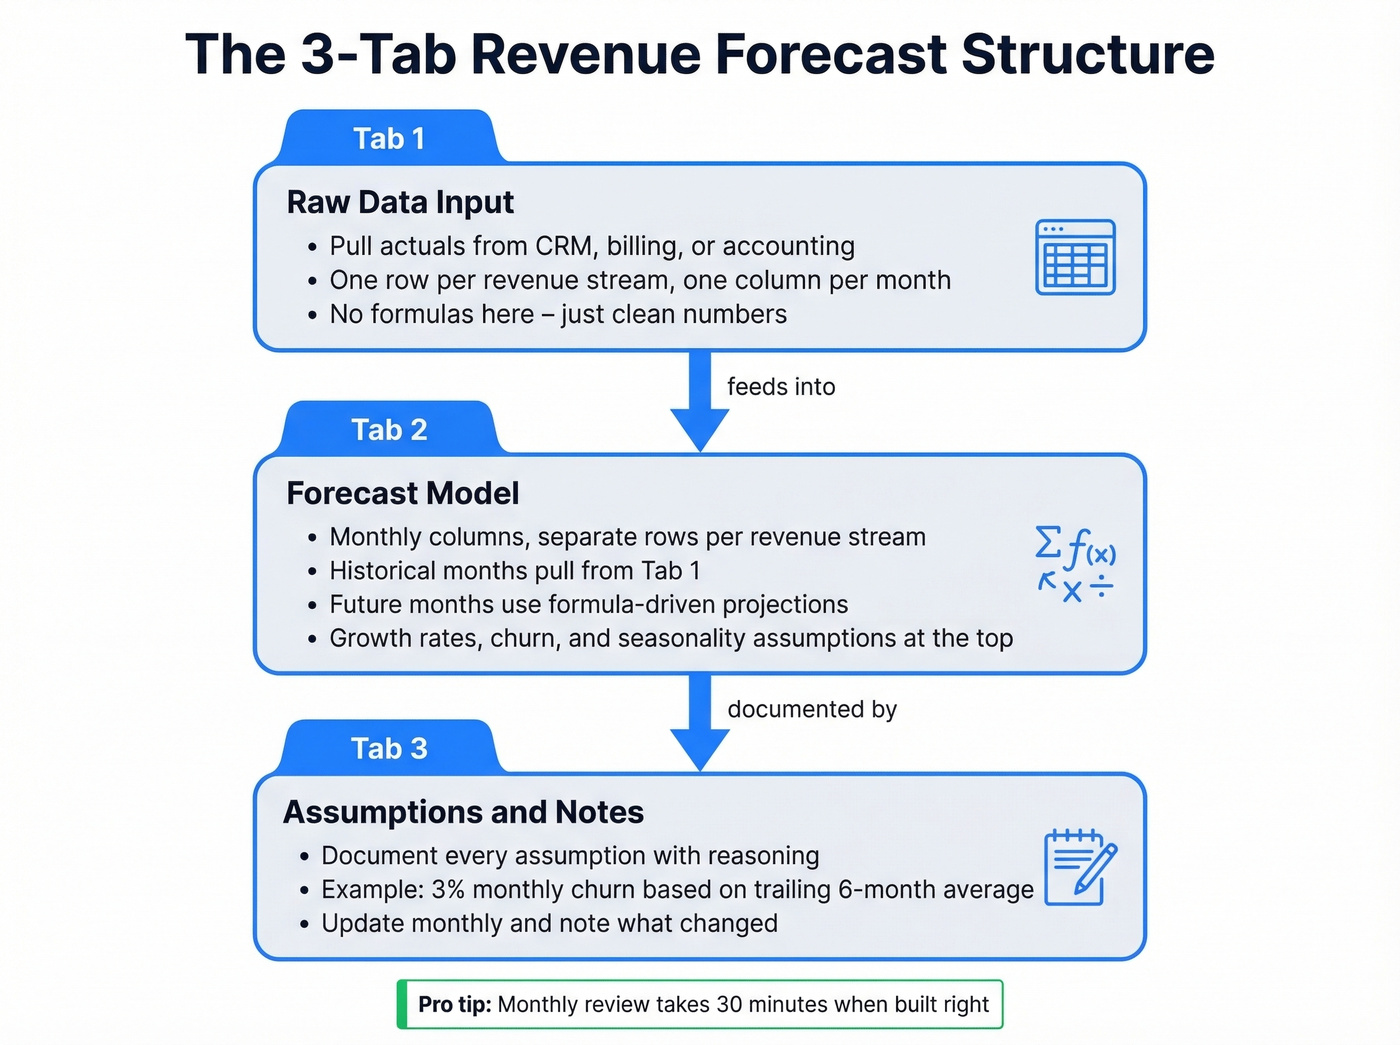
In our experience, this three-tab structure works for about 80% of teams:
Tab 1 - Raw Data Input. Pull actuals from your CRM, billing system, or accounting platform. One row per revenue stream, one column per month. No formulas here - just clean numbers.
Tab 2 - Forecast Model. Monthly columns, separate rows per revenue stream. Each row pulls from the raw data tab for historical months and switches to formula-driven projections for future months. Growth rates, churn, and seasonality assumptions live in clearly labeled cells at the top. If you're in Google Sheets, use IMPORTRANGE to pull live data from your billing system and QUERY to filter by revenue stream - this eliminates the copy-paste errors that plague most forecasts.
Tab 3 - Assumptions & Notes. Document every assumption. "We're assuming 3% monthly churn because that's our trailing 6-month average." When you update next month, you'll know what changed and why.
Worked example: Say you're a SaaS company with $85,000 MRR, 2.5% monthly churn, and 8% month-over-month new customer growth. Month 1: $85,000 base - $2,125 churn + $6,800 new = $89,675. Month 2: $89,675 - $2,242 + $7,174 = $94,607. Carry that forward 12 months and you've got a baseline.
Monthly review cadence: Compare actuals to projections. Update assumptions that drifted. Document what changed. This takes 30 minutes if the template is built right - not the week-long grind that r/FPandA practitioners describe when every department maintains separate trackers.
You read it above: forecast accuracy depends heavily on pipeline data quality. The best template in the world can't fix a CRM full of outdated contacts. Prospeo refreshes every record on a 7-day cycle and delivers 98% email accuracy - so your weighted pipeline forecast reflects real opportunities, not dead leads.
Clean pipeline data is the difference between a forecast and a guess.
How to Add Scenario Analysis
Three scenarios is the minimum. Here's how to build a toggle that swaps all three without breaking your model.
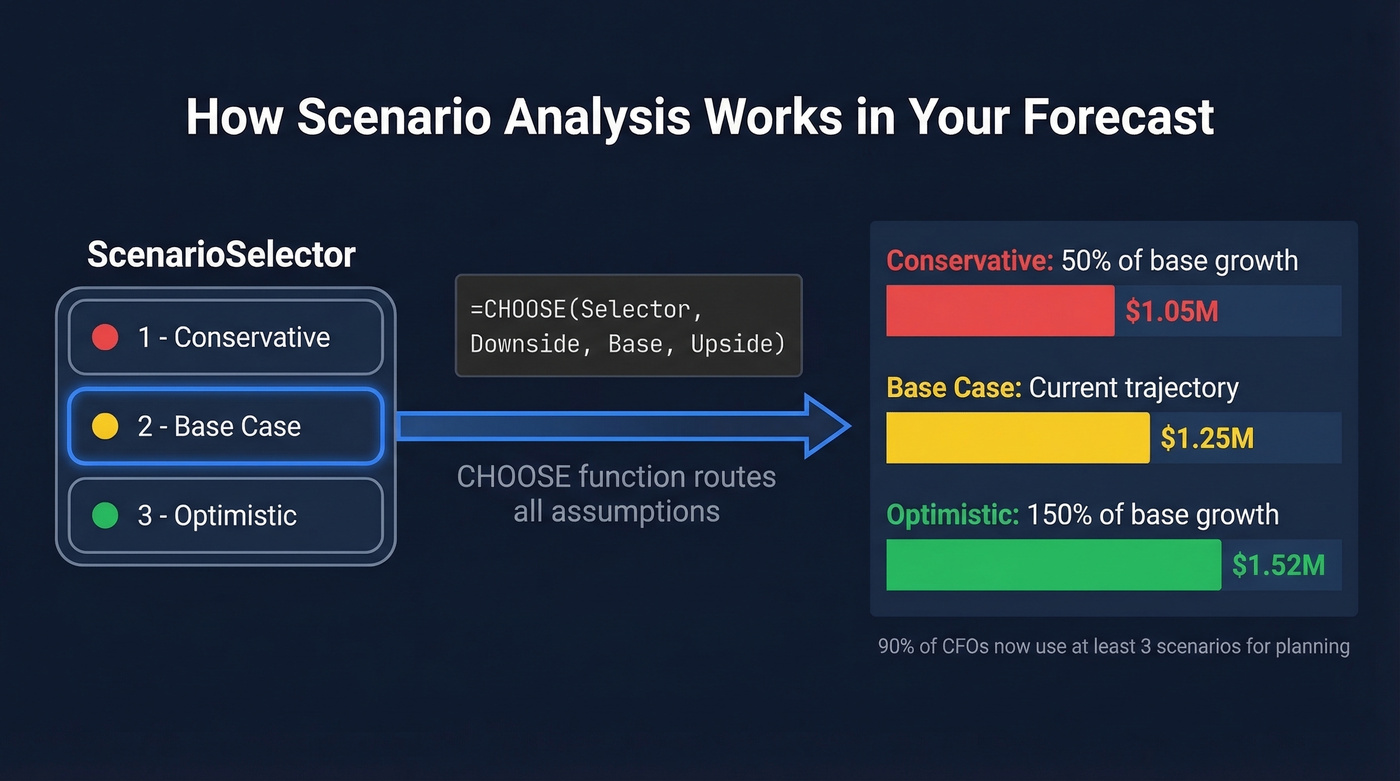
Step 1: Create a named cell called ScenarioSelector with data validation allowing values 1, 2, or 3.
Step 2: Define assumptions for each scenario. Conservative assumes 50% of base growth, optimistic 150%. Express these as percentage deltas from the base case - easier to audit and adjust.
Step 3: Use the CHOOSE function in every formula that references an assumption:
=CHOOSE(ScenarioSelector, Downside_Value, Base_Value, Upside_Value)
When someone selects "1" from the dropdown, every formula pulls the conservative assumption. Select "3" and it's optimistic. The entire model updates instantly.
Step 4: Color-code outputs. Green for optimistic, yellow for base, red for conservative. When you're presenting to the board, visual clarity beats formula elegance.
90% of CFOs now use at least three scenarios for planning. If your template doesn't support this, you're behind.
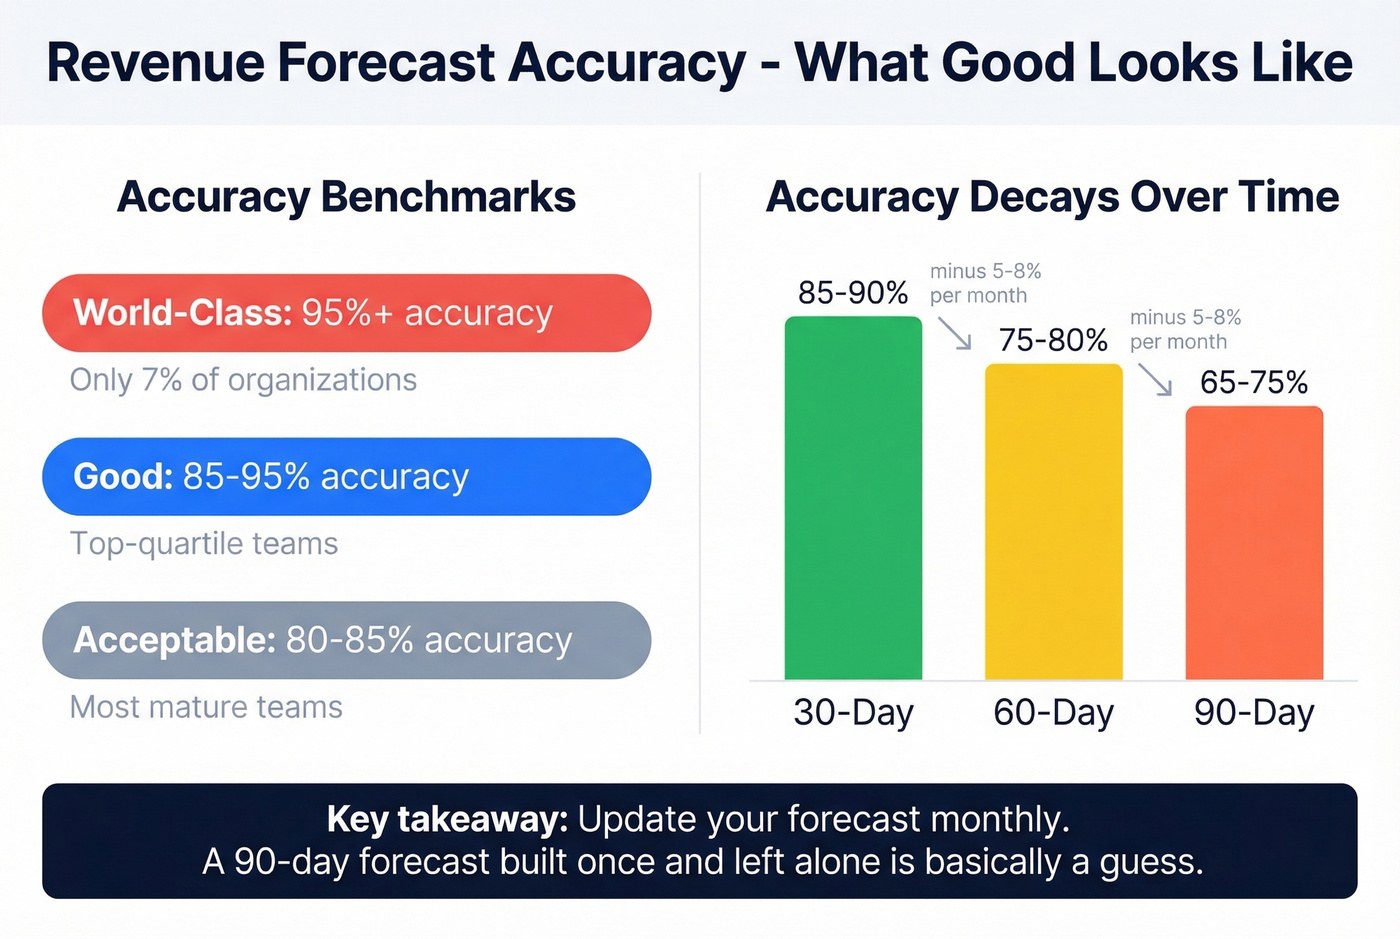
Forecast Accuracy - What Good Looks Like
Let's set realistic expectations.
| Accuracy Band | Range | Who Hits It |
|---|---|---|
| Acceptable | 80-85% | Most mature teams |
| Good | 85-95% | Top-quartile orgs |
| World-class | 95%+ | Only 7% of orgs |
Accuracy decays predictably with time horizon:
| Horizon | Typical Accuracy | Decay Rate |
|---|---|---|
| 30-day | 85-90% | Baseline |
| 60-day | 75-80% | ~5-8%/month |
| 90-day | 65-75% | ~5-8%/month |
Here's the thing: most teams obsess over forecasting methodology when the real problem is data quality. After quotas were lowered 13.3%, nearly 77% of sellers still missed. The problem isn't ambition - it's that pipeline data is fiction. If 30% of your contacts have outdated emails or wrong phone numbers, your weighted pipeline is built on sand.
Measure accuracy using WAPE (Weighted Absolute Percentage Error), not MAPE. Standard MAPE misleads when actual values are small, which happens frequently with newer revenue streams.
7 Mistakes That Kill Forecast Accuracy
Spreadsheet overreliance. We've seen teams where three people maintain separate "master" forecast files and nobody knows which is current. Version confusion kills accuracy faster than bad assumptions.
Optimism bias. Reps overestimate. Managers overestimate. Even finance overestimates when the board is watching. Build conservative scenarios and actually use them.
Ignoring external variables. Market shifts and competitor moves don't show up in CRM data. Build qualitative adjustment rows into your template.
Stale forecasts. A forecast updated quarterly is a history report. Monthly is the minimum - rolling forecasts consistently outperform static annual ones.
No narrative behind numbers. "Revenue will be $1.2M" means nothing without context. "Revenue will be $1.2M because we're launching in DACH and expect 40 new logos at $30K ACV" is actionable.
Rep gut feel over objective signals. The "commit number" from your top rep isn't a methodology. Use stage probabilities calculated from historical data.
Dirty CRM data. Inflated pipeline from duplicate records, dead contacts, and deals that should've been closed-lost months ago. This is the silent killer - tools like Prospeo verify emails at 98% accuracy on a 7-day refresh cycle, so the pipeline numbers feeding your forecast reflect real opportunities instead of ghosts.
Building a Dashboard for Your Forecast
When your spreadsheet grows beyond a few tabs, stakeholders stop opening it. A dashboard solves this by surfacing the numbers that matter - actuals vs. forecast, scenario comparisons, and accuracy trends - in a single visual layer.
At minimum, your dashboard should display monthly projected vs. actual revenue, a waterfall chart showing how new bookings, churn, and expansion move the number, and a scenario comparison bar chart. For teams in Google Sheets, the chart tab can pull directly from your forecast model tab. For teams that have outgrown spreadsheets, tools like Mosaic or Datarails generate live dashboards connected to your CRM and billing data.
When Your Spreadsheet Isn't Enough
Spreadsheets work until they don't. Skip the upgrade if you're a small team with one or two revenue streams and a single forecaster. But watch for these triggers:
| Trigger | Spreadsheet Limitation | What You Need |
|---|---|---|
| >3 contributors | Version conflicts | Workflow + permissions |
| >5 revenue streams | Formula complexity | Driver-based modeling |
| >2 active scenarios | Manual toggling | Scenario engine |
| Weekly updates | Time-consuming | Automated data pulls |
| CRM/billing integration | Copy-paste errors | Native connectors |
Cost context: lightweight forecasting tools run $30-150/user/month. Mid-market FP&A platforms like Mosaic or Datarails cost $1,000-5,000/month. Enterprise solutions like Anaplan start at $20,000+/year.
Let's be honest - the first upgrade most teams actually need isn't a $5K/month FP&A platform. It's cleaning the data feeding the forecast. If your pipeline coverage calculations start from verified numbers instead of stale records, that alone shifts forecast accuracy by several percentage points before you change a single formula.
Running AI/ML-assisted forecasting? Those models are only as predictive as the contact and activity data feeding them. Prospeo enriches your CRM with 50+ data points per contact at a 92% match rate - giving your forecast model the signal density it needs to hit that ±8-15% accuracy range.
Enrich your CRM in bulk and watch forecast accuracy climb.
FAQ
What should a revenue forecast template include?
At minimum: monthly columns, separate rows per revenue stream, an assumptions tab, and a scenario toggle. SaaS templates need MRR/churn rows; ecommerce needs channel-level conversion tracking. Include a dashboard tab once you have three or more revenue streams.
How often should I update my forecast?
Monthly at minimum - compare actuals to projections, adjust assumptions, and document changes. Teams updating quarterly are working from stale numbers. If a single update takes more than a day, your template structure needs simplification.
What forecast accuracy should I target?
85-95% is good for a 30-day horizon. Only 7% of organizations hit 90%+ consistently. Measure current accuracy with WAPE (not MAPE), then improve incrementally by tightening stage probability data and cleaning CRM records.
How does pipeline data quality affect forecast accuracy?
Directly and significantly. If 30% of contact records are outdated or emails bounce, your weighted pipeline is inflated by that same margin - you're forecasting against opportunities that aren't real. Clean your data before trusting any forecast output.
Can I build a reliable forecast in Google Sheets?
Yes, for small teams with one to three revenue streams. Use IMPORTRANGE for live data pulls and the CHOOSE function for scenario toggling. Beyond five revenue streams or three contributors, you'll hit version control issues that spreadsheets weren't designed to handle - that's when dedicated FP&A tools earn their cost.