The Revenue Growth Formula Guide: From Basic Math to CFO-Level Analysis
Most guides hand you one equation and call it a day. That's like giving someone a hammer and calling them a carpenter. The revenue growth formula isn't a single equation - it's a toolkit, and the right one depends on what question you're actually trying to answer.
Here's the quick-reference version:
| Formula | Use When |
|---|---|
| Basic % change | Comparing two periods |
| CAGR | Multi-year trend analysis |
| ARR identity | SaaS/subscription businesses |
| PVM decomposition | Understanding why revenue grew |
| Organic growth | Stripping out M&A and FX effects |
Most teams only know the first one. The other four are where the real insight lives.
The Basic Revenue Growth Rate
The foundation. If you learn nothing else, learn this:
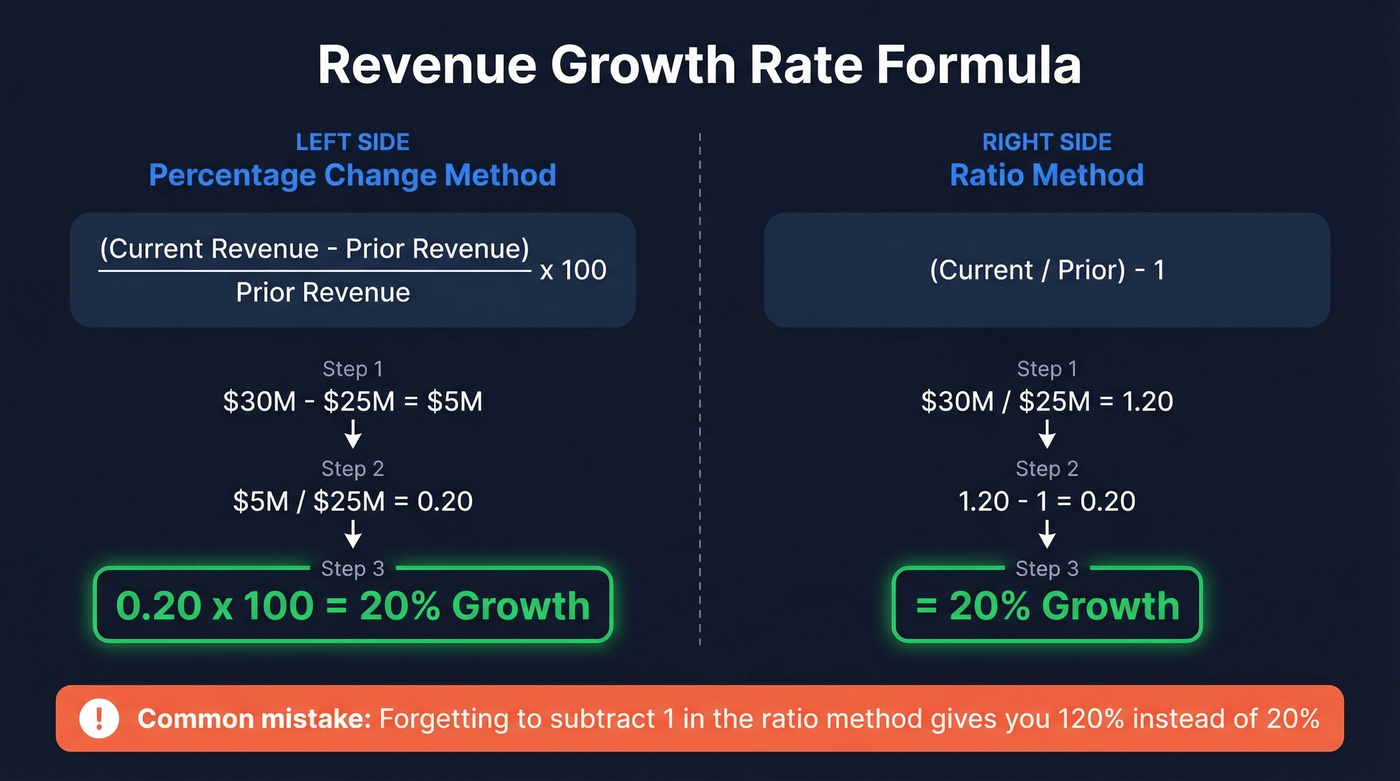
Revenue Growth Rate = (Current Period Revenue - Prior Period Revenue) / Prior Period Revenue x 100
Say your company did $30M this year and $25M last year. Plug it in: ($30M - $25M) / $25M = 0.20, or 20% growth.
Simple enough. But here's where people trip up - and this comes up constantly on r/Accounting. The ratio form of the same formula is (Current / Prior) - 1. So $30M / $25M = 1.2. That 1.2 means your current revenue is 120% of last year's. You subtract 1 to isolate the change. Without subtracting 1, you're reporting total relative size, not growth.
This calculation works for any time period - month-over-month, quarter-over-quarter, or year-over-year. Just keep the periods consistent. One distinction worth internalizing: revenue growth measures top-line change. It says nothing about profitability. A company can grow revenue 40% while burning cash at an accelerating rate.
CAGR - Compound Annual Growth Rate
Basic percentage change breaks down when you're comparing uneven time spans. That's where CAGR comes in:
CAGR = (Ending Value / Starting Value)^(1/n) - 1
Where n is the number of years. A company that grew from $10M to $21M over 4 years has a CAGR of ($21M / $10M)^(1/4) - 1 = (2.1)^0.25 - 1 ≈ 0.204, or 20.4%.
CAGR smooths out the bumps. Maybe year two was flat and year three was a monster - CAGR gives you the annualized rate as if growth had been perfectly steady. That makes it ideal for comparing companies of different ages or evaluating performance across unequal periods. Damodaran's sector dataset uses 5-year revenue CAGR for cross-sector comparison for exactly this reason.
One caveat: CAGR and all backward-looking formulas assume the past predicts the future. For businesses with volatile revenue or major strategic shifts, regression-based forecasting or scenario modeling will give you a more honest picture.
SaaS Revenue Growth Formulas
Subscription businesses need their own math. The basic percentage calculation works, but it misses the mechanics of how recurring revenue actually compounds.
The ARR Identity
Here's the equation every SaaS operator should memorize:
Current ARR = (Prior ARR x NRR) + New ARR
Net Revenue Retention captures everything happening inside your existing customer base - expansion, contraction, and churn, all in one number. New ARR is what your sales team brought in from net-new logos. This identity forces you to see growth as two distinct engines, not one blended number.
NRR and GRR
Gross Revenue Retention measures how much existing revenue you kept, ignoring expansion, and it's typically capped at 100%. NRR includes expansion revenue, so it can exceed 100% - and when it does, your existing customers are growing your business even if you stopped selling entirely.
Here's the thing: growth without retention is a treadmill. A company with strong headline growth but weak retention is pouring water into a leaky bucket. A company with NRR above 100% has a compounding machine - one of the most reliable growth drivers a SaaS business can build.
The Steady-State Formula
Rearrange the ARR identity and you get a powerful long-term lens:
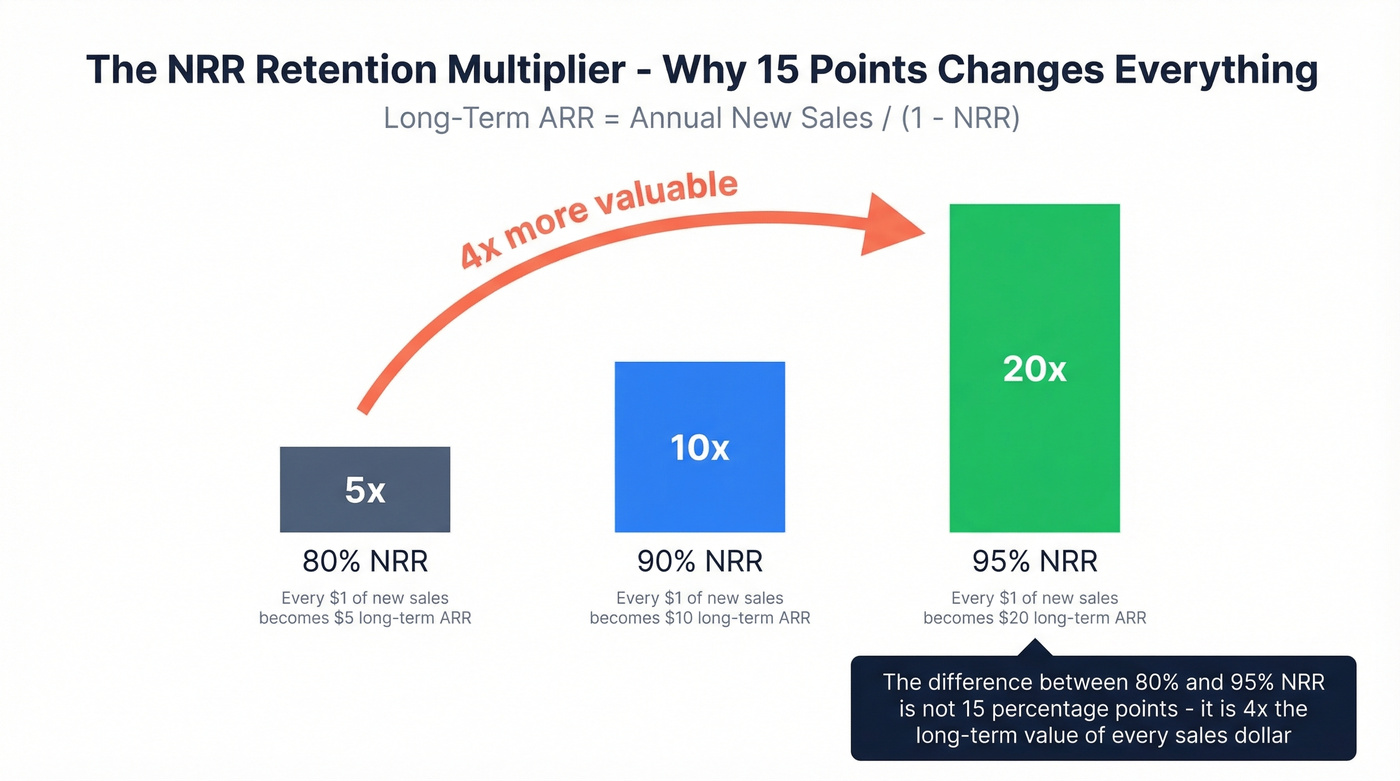
Long-Term ARR = Annual New Sales / (1 - NRR)
This gives you the retention multiplier - 1 / (1 - NRR):
| NRR | Multiplier | Meaning |
|---|---|---|
| 80% | 5x | Every $1 of sales → $5 long-term ARR |
| 90% | 10x | Every $1 of sales → $10 long-term ARR |
| 95% | 20x | Every $1 of sales → $20 long-term ARR |
The difference between 80% and 95% NRR isn't 15 percentage points. It's 4x the long-term value of every sales dollar. That's why investors obsess over retention.
Revenue Growth Decomposition: Price, Volume, and Mix
Your board asks: "Revenue grew 20% - how much was price increases, how much was selling more units, and how much was mix shift?" If you can't answer that, you don't actually understand your growth.
The PVM framework breaks it down:
- Price impact = Change in average selling price x prior period volume
- Volume impact = Change in units sold x current period price - mix impact
- Mix impact = Mix-weighted volume differential x price differential to base average
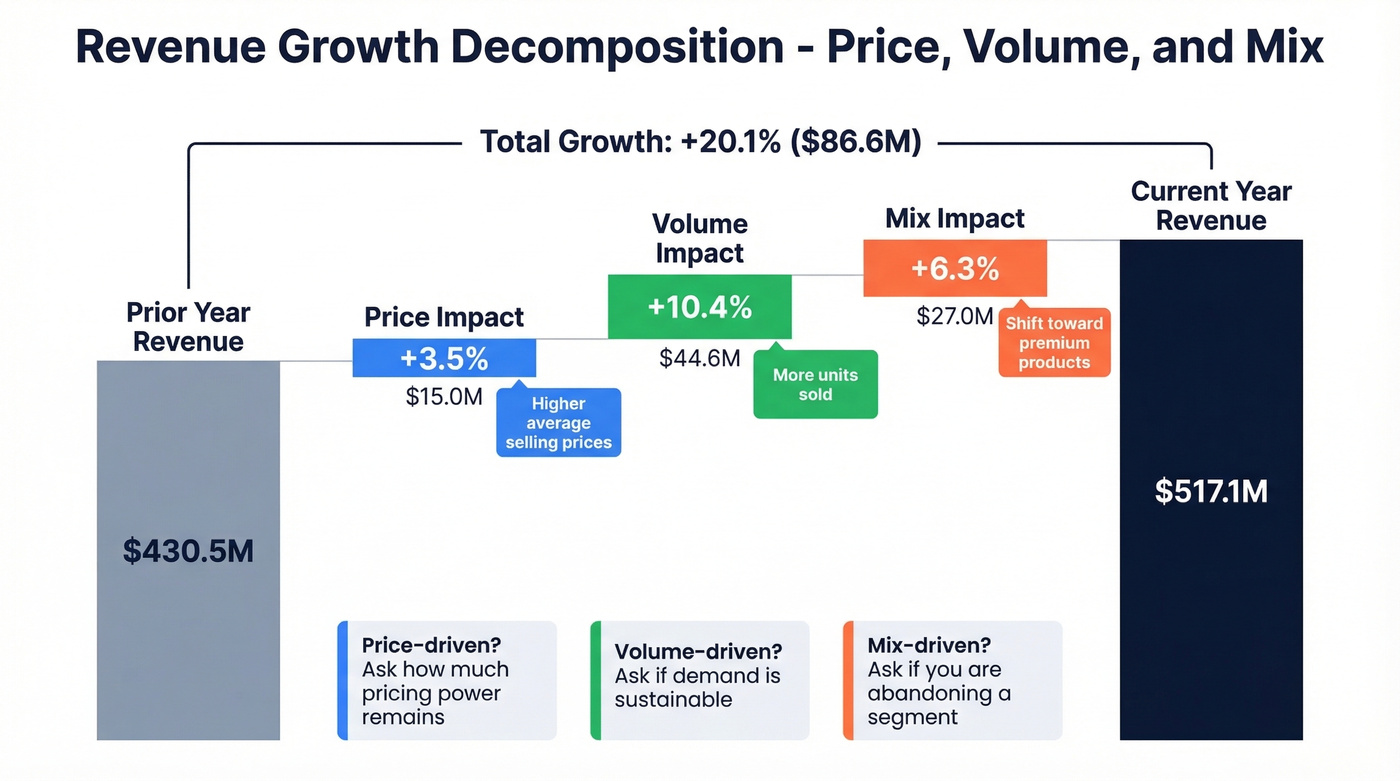
Let's make this concrete. A company reports 20.1% YoY revenue growth - $86.6M in incremental revenue. Decomposed: 3.5% came from price increases ($15M), 10.4% from selling more units ($44.6M), and 6.3% from mix shift toward higher-priced products ($27M).
That decomposition changes the conversation entirely. If almost all your growth came from price, you need to ask how much pricing power you have left. If it's volume-driven, the question becomes whether you can sustain that demand. Mix-driven growth might mean your premium product is winning - or that you're accidentally abandoning a segment. We've found that calculating PVM at the SKU level, rather than in aggregate, is where the real signal emerges. Aggregating too early lets mix effects hide inside "price," and you lose the thread.
Your revenue growth formula has two levers: new logos and expansion. Prospeo's 300M+ verified profiles and 30+ filters - including buyer intent, headcount growth, and funding signals - let you target accounts already in-market. At 98% email accuracy and $0.01 per lead, you scale the New ARR side of the equation without burning budget or domain reputation.
Fix the pipeline input and the revenue growth formula fixes itself.
Organic vs. Total Growth
If your revenue "grew" 30% but half came from an acquisition, your organic growth was 15%. Investors and operators care about the distinction because organic growth reflects the health of your core business.
The formula strips out noise:
Organic Revenue Growth % = (Current CC revenue ex-M&A - Prior CC revenue ex-M&A) / Prior CC revenue ex-M&A
Where CC = constant currency. The adjustment bridge looks like this:
Reported Growth → FX Impact → M&A Impact → Organic Growth → Underlying Organic (ex one-offs)
Every multinational earnings call walks through this bridge. If you're analyzing a company that operates across currencies or has made acquisitions, the reported growth number is almost meaningless without this decomposition.
Revenue Growth Benchmarks (2026)
Guides that say "10-25% is good" are useless. Good for whom? A bootstrapped SaaS company at $5M ARR lives in a different universe than a regional bank or a retail chain.
Look, if your average deal size is under $10K and you're growing below 30% annually, your problem isn't your formula - it's your go-to-market motion. Low-ACV businesses need velocity, and velocity demands both high NRR and aggressive new logo acquisition. No equation fixes a broken GTM.
SaaS Benchmarks
SaaS Capital's 2025 survey of 1,000+ private SaaS companies provides the clearest picture:
| Metric | Median | 90th Percentile |
|---|---|---|
| Revenue growth ($3M-$20M ARR) | 20% | 51% |
| NRR | 104% | 118% |
| GRR | 92% | 98% |
Lighter Capital's dataset of 155 B2B SaaS startups tells a similar story with a sharper decline: median growth dropped from 47.25% to 28.29% year-over-year, with the 75th percentile falling from 87.55% to 65.40%. The growth slowdown is real and broad-based. Sales and marketing efficiency is tightening too - the median S&M multiple dropped from 6.08x to 3.19x in the same period.
For early-stage startups, the YC heuristic of 5-7% weekly growth remains a common bar founders use.
Benchmarks by Industry
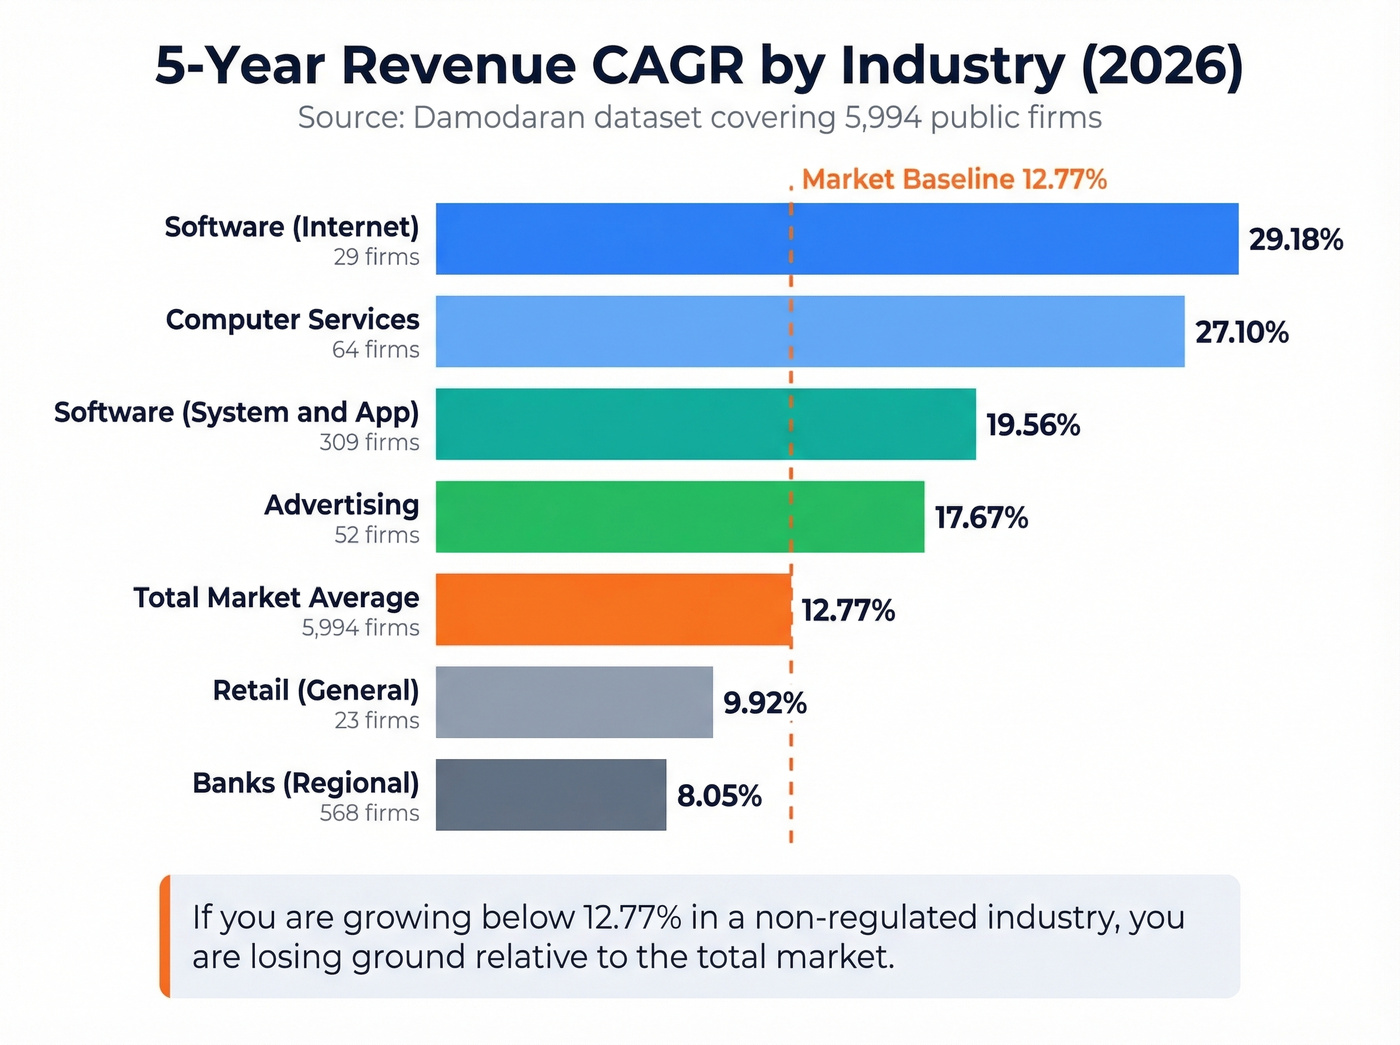
Damodaran's January 2026 dataset covers 5,994 public firms across sectors. Five-year revenue CAGRs show what "normal" looks like outside the SaaS bubble:
| Sector | 5-Year CAGR | Firms |
|---|---|---|
| Software (Internet) | 29.18% | 29 |
| Computer Services | 27.10% | 64 |
| Software (System & App) | 19.56% | 309 |
| Advertising | 17.67% | 52 |
| Retail (General) | 9.92% | 23 |
| Banks (Regional) | 8.05% | 568 |
| Total Market | 12.77% | 5,994 |
The total market CAGR of 12.77% is your baseline. If you're growing below that in a non-regulated industry, you're losing ground.
For churn context by segment: SMB SaaS typically runs 5-7% monthly churn, mid-market 2-4%, and enterprise 0.5-1.5%. If your churn numbers are above these ranges, that's your growth problem - not your sales team. (If you want to go deeper, see our churn analysis guide.)
How to Calculate Revenue Growth in Excel
Basic Growth Formula
In cell C2, with current revenue in B2 and prior revenue in B1:
=(B2-B1)/B1
Format the cell as percentage. Done.
CAGR Formula
For a 4-year period with starting revenue in B2 and ending revenue in B6:
=(B6/B2)^(1/4)-1
Recommended Spreadsheet Layout
| Year | Revenue | YoY Growth | CAGR (from Year 1) |
|---|---|---|---|
| 2023 | $10,000,000 | - | - |
| 2024 | $12,500,000 | 25.0% | 25.0% |
| 2025 | $14,000,000 | 12.0% | 18.3% |
| 2026 | $17,500,000 | 25.0% | 20.5% |
Column C uses =(B3-B2)/B2. Column D uses =(B3/$B$2)^(1/(A3-$A$2))-1. Anchoring the starting values with $ lets you drag the formulas down without breaking references.
GROWTH() for Forecasting
Excel's GROWTH() function projects future values using exponential regression:
=GROWTH(B2:B5, A2:A5, A6:A7, TRUE)
Where B2:B5 is your historical revenue, A2:A5 is the corresponding periods, and A6:A7 are the future periods you want to forecast. This is more sophisticated than extending a CAGR line - it fits an exponential curve to your actual data. Always sanity-check the output against your CAGR. If GROWTH() projects something wildly different, your historical data probably has an outlier distorting the curve.
Common Mistakes
Forgetting to subtract 1. The ratio form (Current / Prior) gives you 1.2, not 20%. You need to subtract 1 to get the growth rate. We've seen financial models sent to investors with this error baked in. Embarrassing and avoidable.
Mixing up bookings, billings, and revenue. A $120K annual contract isn't $120K in revenue the month it's signed. It's $10K/month recognized over 12 months. Bookings = contract value signed. Billings = cash collected. Revenue = recognized over the service period. Conflating these will wreck your forecasts.
Ignoring churn in projections. If you're projecting 40% growth but your monthly churn is 6%, you need to acquire far more than 40% in gross new revenue just to stay even. Build churn into every projection from day one.
Hockey-stick forecasts without drivers. Every startup pitch deck shows a hockey stick. Almost none tie the inflection point to a concrete input - a new sales hire ramping, a channel partnership going live, a pricing change taking effect. If you can't name the driver, the hockey stick is fiction.
Revenue recognition timing. Cash hits your bank account on different schedules than revenue hits your P&L. Annual prepaid contracts create a timing mismatch that can make a profitable company look cash-negative. Model both.
How to Increase Revenue Growth
Four levers, in order of speed and impact.
Pricing. This ties directly back to the PVM framework. Price is the fastest growth lever because it drops straight to the top line with zero incremental cost of goods. Even a 3-5% price increase, applied across your customer base, compounds meaningfully. Most companies underprice and wait too long to adjust.
Retention. The NRR math makes this obvious. Fixing churn from 85% to 95% NRR quadruples the long-term value of every sales dollar. Retention improvements are cheaper than acquisition and compound forever. If your GRR is below 90%, skip the rest of this list - that's where your growth problem lives. (If you need a framework, start with what is churn.)
Expansion revenue. Upsell and cross-sell within existing accounts. Customers who already trust you convert faster and at lower cost. This is how NRR gets above 100% - and it's the difference between linear and exponential growth curves. Companies that treat expansion as a dedicated motion, not an afterthought layered onto customer success, see compounding returns. For tactics and definitions, see Cross Selling vs Upselling.
Pipeline quality. Revenue growth starts with pipeline. Pipeline starts with reaching real decision-makers. In our experience, the single biggest drag on pipeline velocity isn't messaging or sequencing - it's bad data. Every bounced email is a wasted rep touch and a hit to your domain reputation. When we built Prospeo, we designed the verification pipeline around this exact problem: 98% email accuracy across 143M+ verified emails, refreshed on a 7-day cycle, at roughly $0.01 per lead. Bad data doesn't just slow your pipeline - it compounds into weaker top-line performance quarter after quarter. If you're tightening the top of funnel, start with sales prospecting techniques and a clean lead generation workflow.

Volume-driven growth demands a GTM engine that can sustain high-velocity outbound without bouncing. Teams using Prospeo book 35% more meetings than Apollo users - because 98% email accuracy and 125M+ verified mobiles mean your reps actually reach decision-makers. Data refreshed every 7 days, not 6 weeks.
Stop decomposing missed targets - start filling the pipeline with verified contacts.
FAQ
What's a good revenue growth rate?
Median private SaaS companies at $3M-$20M ARR grow at 20%, while the total public market CAGR sits at 12.77% across nearly 6,000 firms. Early-stage startups often target 5-7% weekly growth per the classic YC heuristic. "Good" without specifying stage, industry, and business model is a meaningless question.
What's the difference between revenue growth and CAGR?
Revenue growth measures percentage change between two specific periods - this quarter vs. last, this year vs. last. CAGR smooths multi-year growth into a single annualized rate as if growth had been perfectly steady each year. Use CAGR when comparing companies of different ages or evaluating performance across uneven time spans.
How do I calculate revenue growth in Excel?
Use =(Current-Prior)/Prior for basic growth between two periods, formatted as a percentage. For CAGR over multiple years: =(Ending/Starting)^(1/years)-1. For projections based on historical data, Excel's GROWTH() function fits an exponential regression curve to your revenue history.
How does prospect data quality affect revenue growth?
Bounced emails, wrong numbers, and outdated titles waste 20-30% of sales capacity and tank pipeline velocity. Accurate contact data - verified emails, direct dials, fresh records - means reps spend time selling instead of chasing dead leads. That difference compounds across every stage of the funnel.