SaaS Industry Benchmarks: The Only Reference Guide You Need in 2026
SaaS companies planned to grow 35% in 2024. They actually grew 26%. That nine-point gap between ambition and reality is the story of the current market - every metric that matters has shifted, and most teams are still running last year's playbook.
What follows covers the core KPIs with segmentation where the data exists (stage, ACV, vertical, funding type), plus the editorial opinions most benchmark reports are too polite to include. The global SaaS market hit $315.68B in 2025 and is projected to reach $1.48T by 2034 at an 18.7% CAGR, with North America still commanding 46.9% of that market.
Quick Reference Table
Stop benchmarking against medians. Target top quartile. Here's where private SaaS landed:
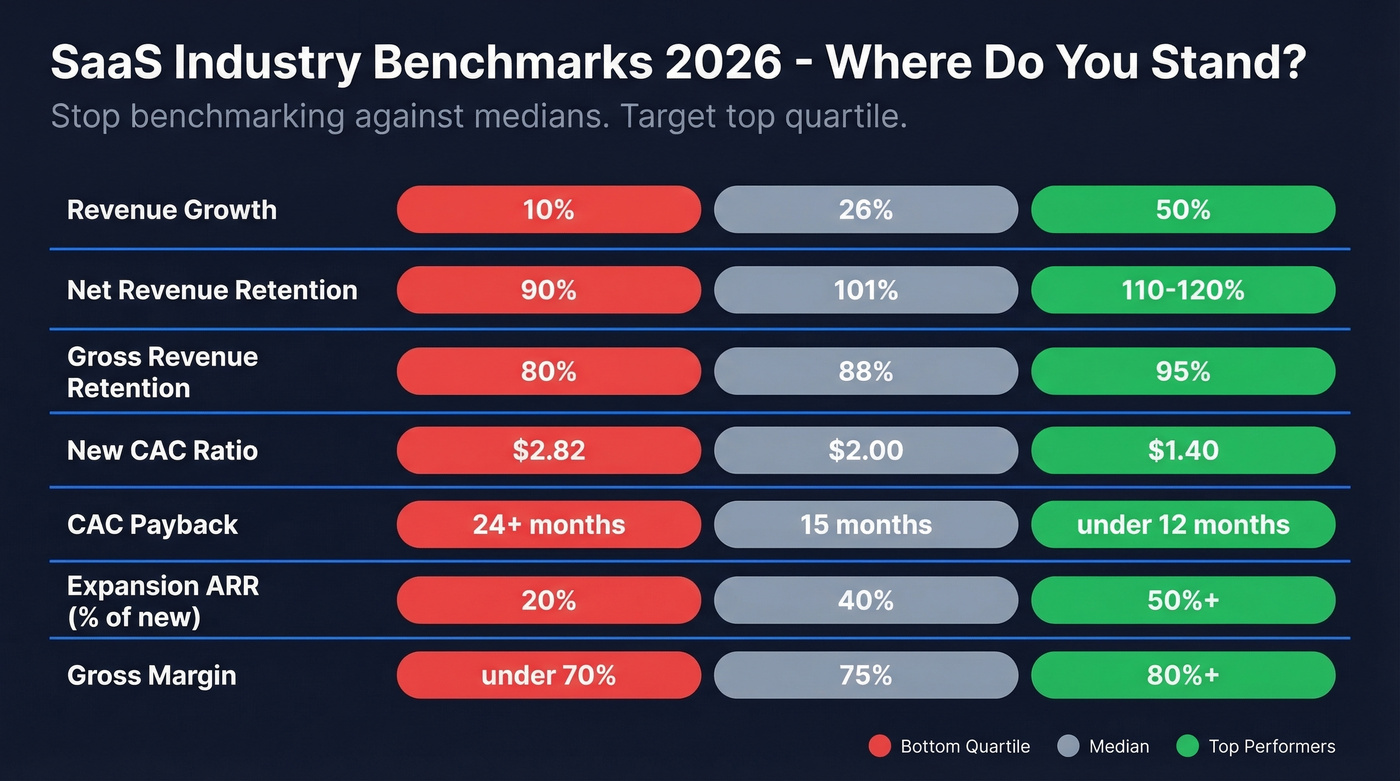
| Metric | Median | Top Performers | Bottom Quartile |
|---|---|---|---|
| Revenue Growth | 26% | ~50% | ~10% |
| Net Revenue Retention | 101% | 110-120% | ~90% |
| Gross Revenue Retention | 88% | ~95% | ~80% |
| New CAC Ratio | $2.00 | ~$1.40 | $2.82 |
| CAC Payback | 15 months | <12 months | >24 months |
| Expansion ARR (% of new) | 40% | >50% | ~20% |
| Gross Margin | 75% | 80%+ | <70% |
Growth Rate Benchmarks
Median private SaaS growth sits at 26%. That's the actual number - not the 35% companies planned for. The Maxio/Benchmarkit analysis of planned-versus-actual growth is one of the most sobering data points in the entire report.
Top-quartile growth declined from 60% in 2023 to roughly 50% in 2024. The bigger story is simple: deceleration is real, and a lot of teams are still budgeting like it isn't. Anyone referencing a 2023 revenue benchmark report without adjusting for this slowdown is working with outdated assumptions.
| Segment | Median Growth | Top Quartile |
|---|---|---|
| <$5M ARR | ~35-40% | 60%+ |
| $5M-$50M ARR | ~25% | 40-50% |
| >$50M ARR | ~20% | 30%+ |
Bootstrapped and VC-backed companies are diverging sharply. VC-backed companies spend 47% of revenue on sales and marketing versus 33% for PE-backed - and the market is rewarding efficiency far more than it did in 2021.
AI-core products grew fastest across every ARR band in High Alpha's 2025 dataset of 800+ SaaS companies. ICONIQ finds AI-native companies growing 2-3x faster than top-quartile performers, which we'll break down in its own section below.
Retention: NRR vs. GRR
Median NRR has slid from 105% in 2021 to 101% in 2024. On the surface, that looks fine - you're still net-positive on existing customers. But here's the metric nobody talks about enough: gross revenue retention dropped from 90% to 88% over the same three years.
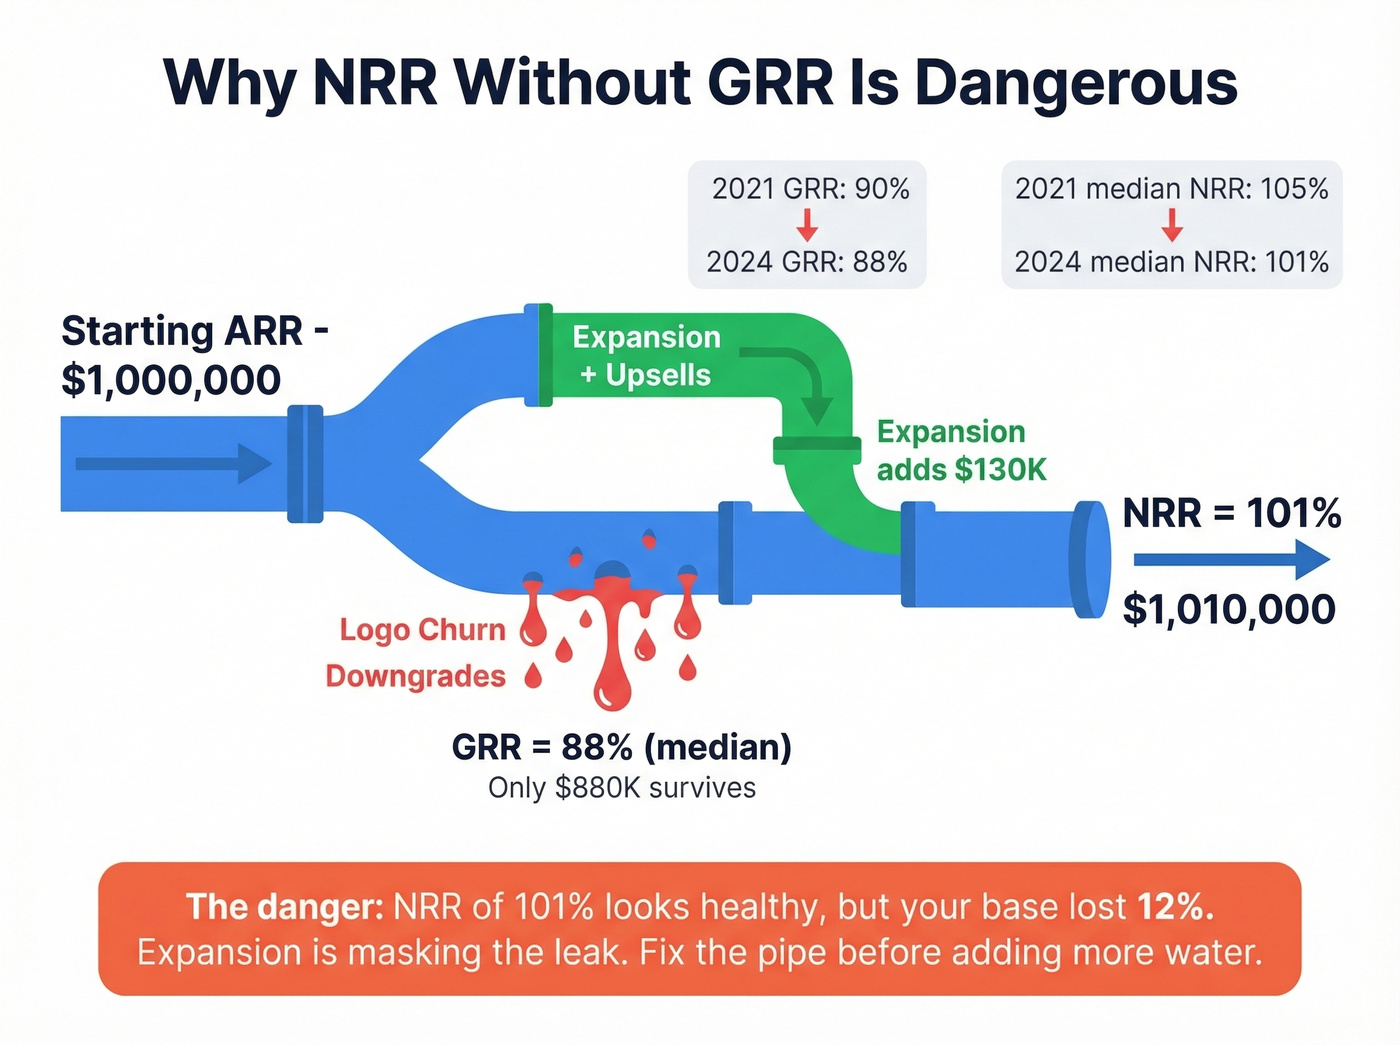
GRR is the metric that matters most, and it's the one most teams ignore. NRR can look healthy at 101% while your underlying customer base quietly erodes. Expansion revenue masks the churn. You're replacing leaking water with a bigger hose instead of fixing the pipe. We've seen this pattern repeatedly in our own analysis of outbound pipeline data - teams celebrating "healthy retention" while their base contracts underneath. Revenue team benchmarks should always decompose NRR into its GRR and expansion components, or sales, CS, and marketing end up celebrating a number that hides the real story.
ICONIQ's 2025 State of Software report puts top-performer NDR in the 110-120% range. If you're below 100% NRR, you don't have a growth problem - you have a retention crisis that growth is temporarily hiding. The consensus on r/SaaS echoes this: operators are increasingly vocal that tracking NRR without GRR is dangerous because it lets teams celebrate while the foundation crumbles.
The winning combination is high NRR paired with short CAC payback. Companies that nail both consistently outperform on growth and Rule of 40. Hybrid pricing models - subscription plus usage - deliver the best NRR, which is one reason outcome-based AI pricing is gaining traction.
Churn Benchmarks
"Average SaaS churn is 5%" is about as useful as "average temperature on Earth is 59 degrees." The number changes dramatically depending on what you sell, who you sell to, and how you charge.
Churn by Vertical
| Vertical | Monthly Churn | Annual Churn |
|---|---|---|
| Infrastructure & DevOps | 1.8% | 19.8% |
| CRM | 2.4% | 25.6% |
| Collaboration & Productivity | 4.1% | 40.7% |
| Email & Communication | 8.1% | 67.2% |
Infrastructure products are sticky by nature - they're embedded in workflows and painful to rip out. Email tools? Customers switch on a whim. If you're building in a high-churn vertical, your retention strategy needs to be fundamentally different from a DevOps company's.
A math note that matters: Don't multiply monthly churn by 12 to get annual churn - compound it. A 3% monthly rate isn't 36% annual; it's 30.6%. The difference matters at scale, and getting this wrong will make your board deck look worse than reality.
Churn by Company Stage
| Stage | Monthly Churn | Annual Churn |
|---|---|---|
| Pre-PMF (<$1M ARR) | 8.2% | 67.8% |
| Early-stage ($1-$5M) | 5.7% | 52.3% |
| Growth-stage ($5-$20M) | 3.9% | 39.1% |
| Established ($50M+) | 1.9% | 21.0% |
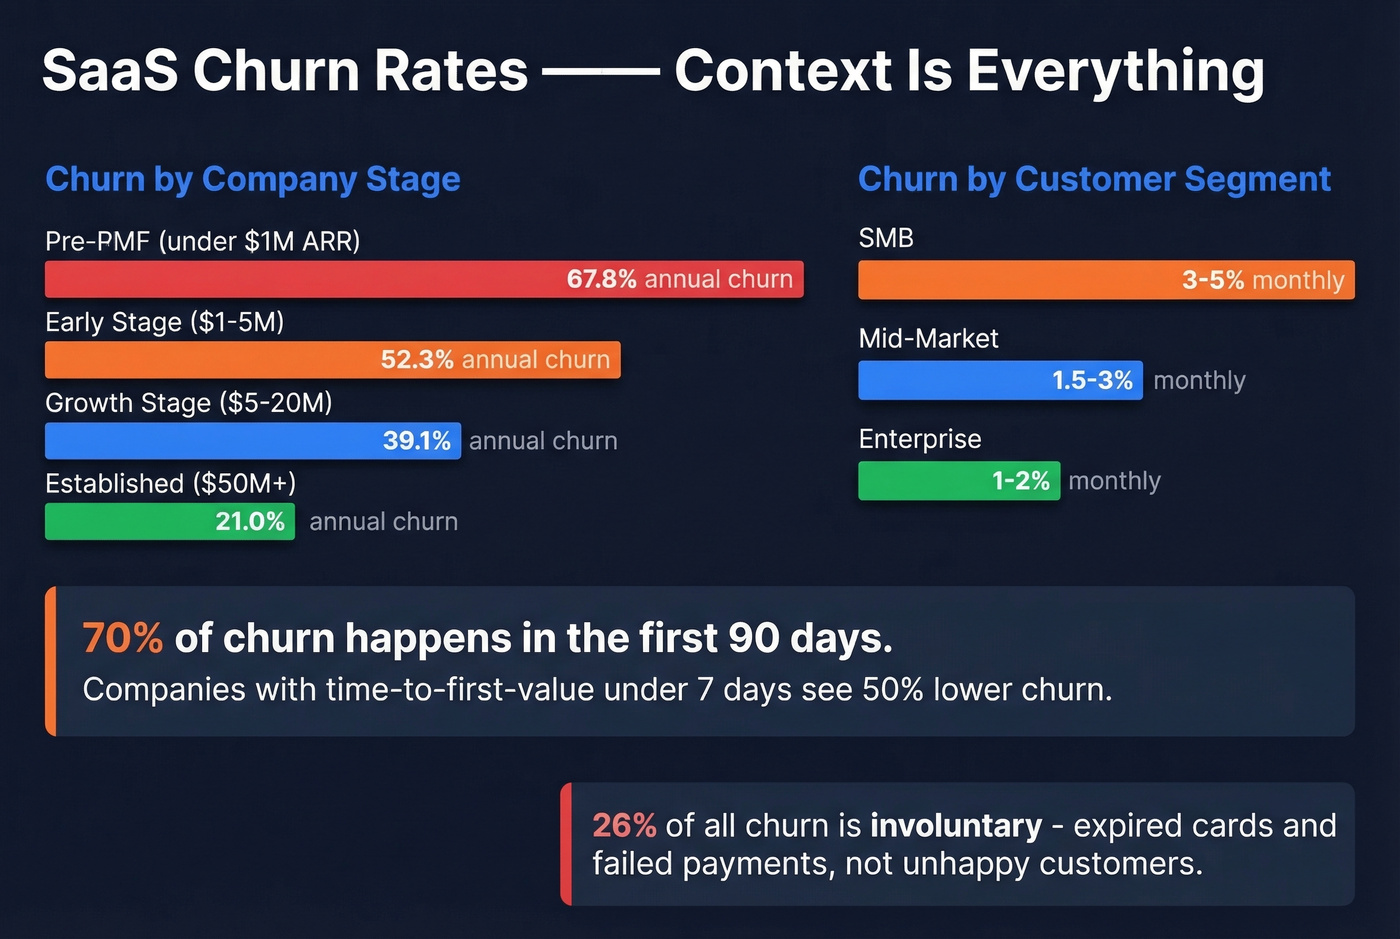
Optifai's separate dataset of 939 B2B SaaS companies segments differently by customer type: SMB churn runs 3-5% monthly, mid-market 1.5-3%, and enterprise 1-2%. Best-in-class companies maintain under 1% monthly regardless of category. When you benchmark B2B churn, always match by customer segment - comparing SMB churn to enterprise churn is comparing apples to aircraft carriers.
Here's the thing: 70% of churn happens in the first 90 days. Companies with time-to-first-value under seven days see 50% lower churn in that window. If your onboarding takes two weeks, you're losing customers before they ever experience what you built. That's not a retention problem. It's an onboarding problem.
If you want a deeper breakdown of what churn actually is (and how to measure it correctly), start with our churn analysis guide.
Churn by Pricing Model
| Pricing Model | Monthly Churn | Annual Churn |
|---|---|---|
| Usage-based | 2.1% | 22.9% |
| Hybrid | 2.8% | 29.4% |
| Per-seat | 3.9% | 39.1% |
| Flat-rate | 5.6% | 52.1% |
Usage-based pricing wins on retention because customers self-select their spend level - they don't feel locked into a tier they're not using. Flat-rate is the worst because there's no natural expansion path and no usage-based stickiness.
One data point that doesn't get enough attention: involuntary churn accounts for 26% of total churn. Expired credit cards cause 42% of involuntary churn, and insufficient funds cause another 31%. That means roughly a quarter of your churn isn't customers choosing to leave - it's payment infrastructure failing. If you're not running dunning campaigns and card-update flows, you're leaving retention on the table.
CAC and Efficiency Metrics
CAC Ratios and Payback
The New CAC Ratio - how much S&M spend it takes to acquire $1 of new customer ARR - hit $2.00 in 2024, up 14% year-over-year. Landing new logos is getting more expensive.
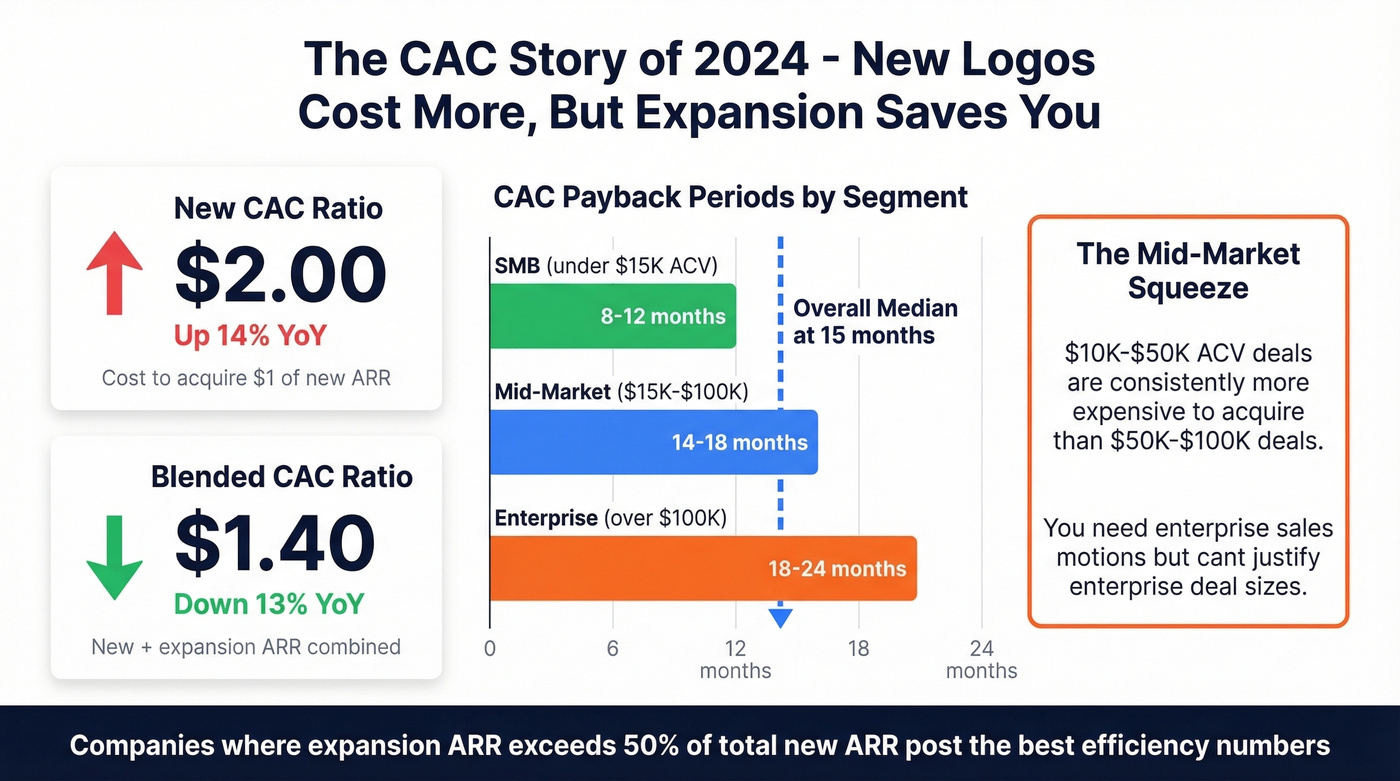
The silver lining: Blended CAC Ratio (new plus expansion ARR) dropped from $1.61 to $1.40, a ~13% improvement. Expansion revenue is doing the heavy lifting. Companies where expansion ARR exceeds 50% of total new ARR - typically those above $50M ARR - post the best efficiency numbers.
| Segment | CAC Payback |
|---|---|
| SMB (<$15K ACV) | 8-12 months |
| Mid-market ($15K-$100K) | 14-18 months |
| Enterprise (>$100K) | 18-24 months |
| Overall Median | 15 months |
There's a persistent anomaly in the data: $10K-$50K ACV solutions are consistently more expensive to acquire than $50K-$100K ACV deals. The mid-market squeeze is real - you need enterprise-grade sales motions but can't justify enterprise-grade deal sizes.
If you need to standardize your definition before comparing benchmarks, use a consistent cost to acquire customer framework.

One underrated lever for CAC compression is contact data quality. If 15-20% of outbound emails bounce, you're burning budget on prospects you'll never reach. When your median CAC payback is already 15 months and climbing, eliminating dead-end outreach becomes a unit economics imperative, not a nice-to-have. Tools like Prospeo - with 98% email accuracy and a 7-day data refresh cycle - exist specifically to close that gap. (If you're auditing deliverability, start with email bounce rate benchmarks and fixes.)
A 75% gross margin is the floor for healthy SaaS unit economics. Drop below that and your CAC payback math gets much harder, because you're trying to earn back acquisition spend with less contribution margin per dollar.
Spend Mix and Productivity
VC-backed companies spend 47% of revenue on sales and marketing versus 33% for PE-backed. R&D runs 34% of revenue at private companies versus 23% at public ones - the gap reflects the build-versus-optimize trade-off at different stages.
ARR per FTE scales predictably: $200K at the $50M-$100M ARR band, $300K above $100M ARR. If your headcount is growing faster than your ARR per employee, you've got a productivity problem that more hiring won't solve.
If you want to connect these efficiency metrics to pipeline reality, compare against sales pipeline benchmarks and pipeline health indicators.
Your CAC ratio is climbing because bad data burns budget on bounced emails and wrong numbers. Prospeo delivers 98% email accuracy and 30% mobile pickup rates - so every dollar of S&M spend actually reaches a real buyer. At $0.01 per verified email, your blended CAC ratio drops fast.
Stop inflating your CAC with data that doesn't connect.
Rule of 40 and Valuation
Revenue growth rate plus profit margin should equal or exceed 40%. It's a simple formula with outsized importance: ICONIQ's analysis found that Rule of 40 is now the most reliable predictor of SaaS valuation, with a 1-point increase in revenue growth carrying nearly 2x the valuation impact of a 1-point increase in FCF margin.
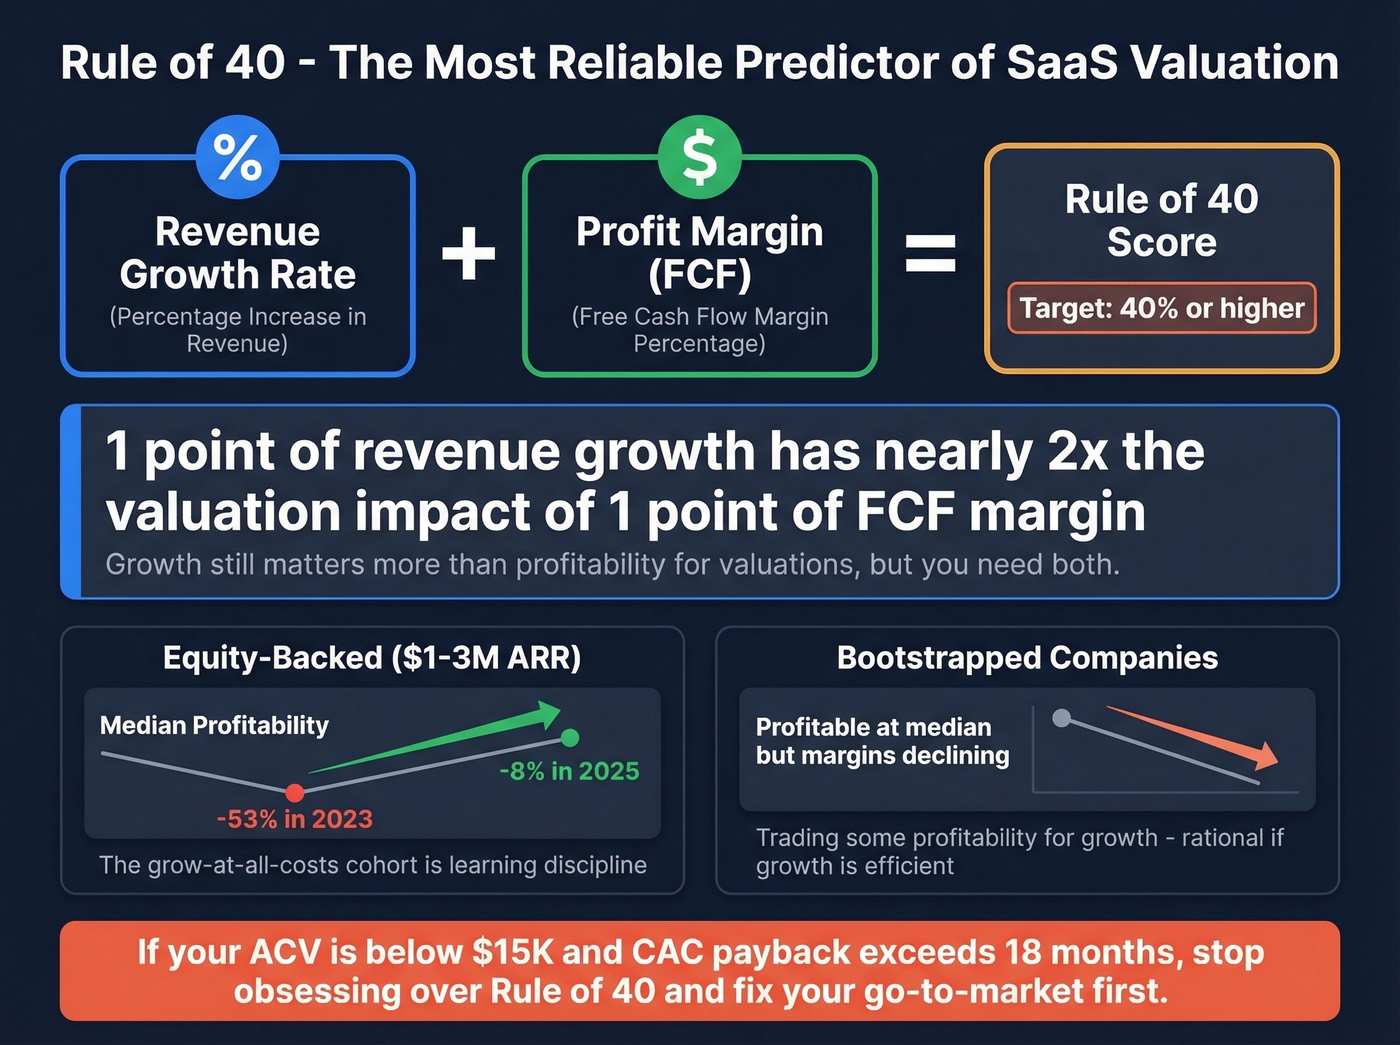
SaaS Capital's data shows Rule of 40 scores have contracted across ARR sizes and funding types over the past two years. Falling revenue growth is the primary driver. But there's a bright spot: equity-backed companies at $1-3M ARR improved median profitability from -53% to -8% between 2023 and 2025. The "grow at all costs" cohort is learning discipline.
Bootstrapped companies remain profitable at the median but have seen margins decline. They're trading some profitability for growth - a rational move if the growth is efficient.
Let's be honest: if your ACV sits below $15K and your CAC payback exceeds 18 months, stop obsessing over Rule of 40 and fix your go-to-market. The Rule of 40 is a useful north star, but it's a compound metric. Most companies that "fail" it are actually failing on one specific input, not the whole equation. Decompose it into growth rate, margin, and the levers behind each before you panic.
AI-Native SaaS Benchmarks
Stop panicking about AI companies growing 2-3x faster than traditional SaaS. They're playing a different game with different rules.
Bessemer's "Supernova" AI companies - the top performers in their State of AI 2025 analysis - hit $40M Year-1 ARR and $125M Year-2 ARR. Their ARR per FTE runs $1.13M, roughly 4-5x the traditional SaaS benchmark. But gross margins sit around 25%, often negative. These aren't SaaS businesses in the traditional sense - they're compute-heavy platforms with fundamentally different cost structures.
| Metric | AI-Native (Top) | Traditional SaaS |
|---|---|---|
| Year-1 ARR | ~$40M | ~$2-5M |
| Gross Margin | ~25% | 75%+ |
| ARR/FTE | $1.13M | $200-300K |
| Rule of 40 | 60-80+ (growth-driven) | 25-40 |
High Alpha's data confirms AI-core products carry roughly 5 points lower gross margin due to compute costs but post stronger Rule of 40 scores because the growth more than compensates.
The VC market reflects this divergence: over 50% of venture dollars now flow to AI startups, with average round sizes of $40M for AI versus $10M for non-AI. If you're a traditional SaaS company benchmarking against AI-native growth rates, skip it - you're measuring yourself against a fundamentally different business model. Benchmark against your own category.
Public SaaS Context
For reference against public markets, the BVP Nasdaq Emerging Cloud Index provides a useful ceiling:
| Metric | Value |
|---|---|
| Total Market Cap | $1.8T |
| Avg Revenue Multiple | 6.2x |
| Avg Revenue Growth | 18.7% |
These are averages, not medians - a few hypergrowth names pull the numbers up. Public SaaS growth at 18.7% versus private SaaS at 26% reflects the maturity gap: public companies are larger, slower-growing, and more profitable. Use these as a reference for what "scaled SaaS" looks like, not as a target for your Series B.
Common Benchmarking Mistakes
Using inconsistent CAC payback formulas. The same company can report 22.5 months or 15 months depending on whether expansion ARR is in the denominator. That's a 33% difference from a formula choice, not a performance change. Always confirm whether a benchmark uses new-logo-only or blended ARR before comparing.
Trusting LTV/CAC at face value. The inputs are interdependent - higher ARPA can increase churn, higher growth can inflate CAC. Using 1/churn to estimate customer lifetime from three years of data to model a 15-year horizon is fantasy math.
Tracking NRR without GRR. We've beaten this drum already, but it bears repeating. Expansion masking churn is the single most common way teams fool themselves. Decompose NRR into its components every quarter.
Benchmarking without matching your profile. A $3M ARR bootstrapped vertical SaaS company has nothing in common with a $50M ARR VC-backed horizontal platform. Match by ACV, ARR band, GTM motion, and funding type - or the comparison is noise. (If you need a practical way to define “match,” use an ideal customer profile template and score it.)
Ignoring operational benchmarks. Financial KPIs get all the attention, but SaaS companies are increasingly tracking security posture, app sprawl, and governance metrics. These don't show up in most benchmark reports, but they affect your ability to close enterprise deals and pass procurement reviews.
If you only read three benchmark reports this year: Benchmarkit, SaaS Capital, and Bessemer's State of AI.
How to Actually Use These Numbers
Match benchmarks by ACV plus ARR band plus GTM motion plus funding type. A number without context is just a number. Track trends over three or more quarters, not single snapshots - one quarter of 30% growth followed by one quarter of 15% tells a very different story than two quarters of 22%.
Decompose compound metrics ruthlessly. NRR breaks into GRR plus expansion. CAC Ratio breaks into new versus blended. Rule of 40 breaks into growth versus margin. The compound number tells you where you are; the components tell you what to fix.
If you can only track five metrics, track these in this order: GRR, NRR, New CAC Ratio, CAC Payback, Rule of 40. GRR comes first because it's the foundation everything else sits on. If your base is eroding, nothing else matters.
And stop benchmarking against medians. Medians include companies that are stagnating, shrinking, or about to run out of runway. Top quartile is the target. Everything else is a consolation prize.

Expansion revenue is the lever top-quartile SaaS companies use to hit 110%+ NRR. But you can't expand accounts you can't reach. Prospeo's 300M+ profiles with 30+ filters - including headcount growth, funding signals, and buyer intent - help you find expansion contacts inside existing accounts before competitors do.
Turn your retention metric from a vanity number into real pipeline.
FAQ
What's a good SaaS growth rate in 2026?
Median private SaaS growth is 26%, with top quartile around 50%. Early-stage companies under $5M ARR should target 50%+, while companies above $50M ARR are healthy at 20-30%. AI-native companies grow 2-3x faster but operate with structurally different economics and lower gross margins.
What's the average SaaS churn rate?
Monthly churn ranges from 1.8% for Infrastructure/DevOps to 8.1% for email tools, and from 1-2% for enterprise customers to 3-5% for SMB. Best-in-class companies maintain under 1% monthly regardless of segment. Always compare by vertical, customer size, and pricing model - a single "average" number is meaningless without that context.
How do you calculate CAC payback?
Divide total customer acquisition cost by (monthly ARPU x gross margin). Including expansion revenue in the denominator can reduce your result by 33%, so always confirm the formula before comparing against any benchmark. Median payback across private SaaS is 15 months; SMB deals recover fastest at 8-12 months.
What's the Rule of 40?
Revenue growth rate plus profit margin should equal or exceed 40%. A 1-point increase in growth carries nearly 2x the valuation impact of a 1-point margin improvement. Most private SaaS companies don't pass it - scores have contracted across all ARR sizes since 2023.
Where can I find reliable SaaS industry benchmarks?
The three best sources are Benchmarkit for private SaaS financials, SaaS Capital for Rule of 40 and growth-profitability analysis, and Bessemer's State of AI for AI-native metrics. Supplement with ICONIQ's State of Software for valuation context and the BVP Cloud Index for public-company comparisons.