Sales Activity Management: Track Less, Close More
Vantage Point Performance identified 306 different metrics tracked across sales organizations. Only 17% relate to activities reps can actually control. Meanwhile, 84% of reps missed quota last year. Those two numbers are connected, and the fix isn't more dashboards - it's smarter sales activity management.
The short version: Track 5-8 activity metrics per role, not 50. Use "tension metrics" - pairing volume with quality and cost - so reps can't game any single number. Refresh your contact data weekly, because if a third of your phone numbers are dead, your activity metrics are fiction. And run a 15-minute weekly coaching review per rep instead of staring at daily dashboards that create anxiety, not insight.
What Is Sales Activity Management?
Sales activity management is the practice of identifying, tracking, and optimizing the leading-indicator behaviors - calls, emails, meetings, follow-ups - that move deals forward. It's about inputs, not outcomes. You can't directly manage revenue. You can manage how many qualified conversations your team has this week.
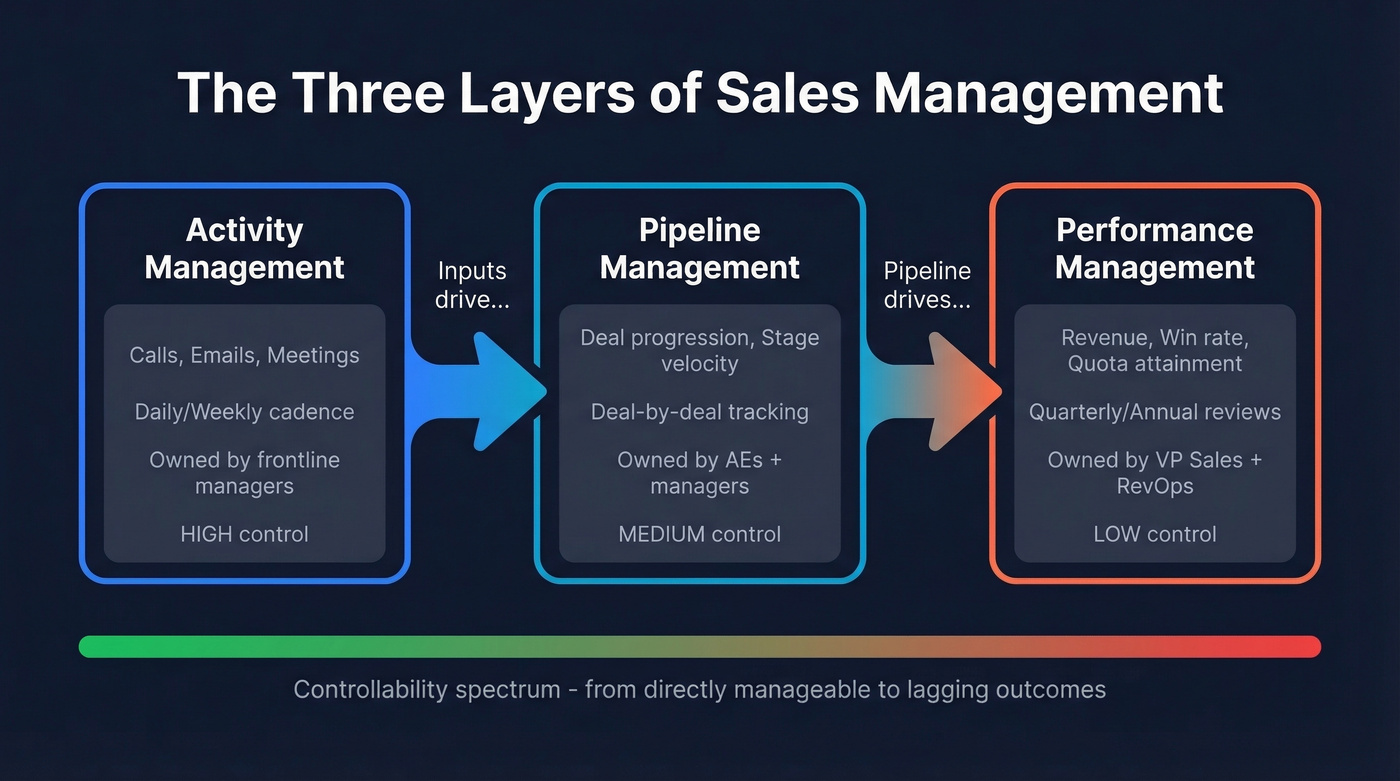
People sometimes describe it as "controlling the controllable," and that's accurate but incomplete. It's not just about control - it's about creating a feedback loop between effort and outcomes that helps reps get better every week. The confusion usually starts when people lump it together with pipeline management or sales performance management. They're related but distinct:
| Activity Management | Pipeline Management | Performance Management | |
|---|---|---|---|
| Focus | Inputs & behaviors | Deal progression | Outcomes & incentives |
| Measures | Calls, emails, meetings | Stage movement, velocity | Revenue, win rate, quota |
| Timeframe | Daily/weekly | Deal-by-deal | Quarterly/annual |
| Who owns it | Frontline managers | AEs + managers | VP Sales + RevOps |
| Control level | High (directly manageable) | Medium | Low (lagging) |
If the inputs are wrong - wrong volume, wrong targets, wrong cadence - pipeline and performance metrics downstream will reflect it. But tracking activities without understanding what they feed is just busywork surveillance.
Why It Matters in 2026
The selling environment has shifted in ways that make managing rep activity both more important and harder to execute.
Reps spend only a third of their time actively selling. Forrester's productivity research puts it starkly: the [average rep wastes about 14](https://www.forrester.com/resources/sales-productivity/activity-study/) of 51 hours per week on admin tasks - 27% of the workweek gone before a single prospect hears from you. The sales enablement platform market is growing at 20% CAGR, reaching an estimated $10.6B by 2030, because companies are desperate to claw back that lost time.
[Fewer than 50% of sales reps](https://hbr.org/sponsored/2024/11/breaking-down-silos-to-boost-sales-performance-and-drive-growth) have hit quota annually since 2017. That's not a blip - it's structural. Digital activities are harder to observe, easier to fake, and more numerous than in-person ones, which makes the management challenge steeper than it was five years ago.
The response has been predictable: more tools, more tracking. 81% of sales teams now use AI, and the sales planning software market has ballooned from $6.8B to a projected $18B by 2032. But more technology hasn't fixed the fundamental problem. Most teams still track the wrong things, or track the right things and do nothing useful with the data.
Activity management isn't about surveillance. It's coaching infrastructure. When it works, reps improve. When it doesn't, it's a spreadsheet that makes everyone miserable.
Five Categories of Activity Metrics
Most teams default to "calls made" and "emails sent" because those are easy to pull from the CRM. That's like judging a restaurant by how many plates leave the kitchen. You need a framework that captures the full picture.
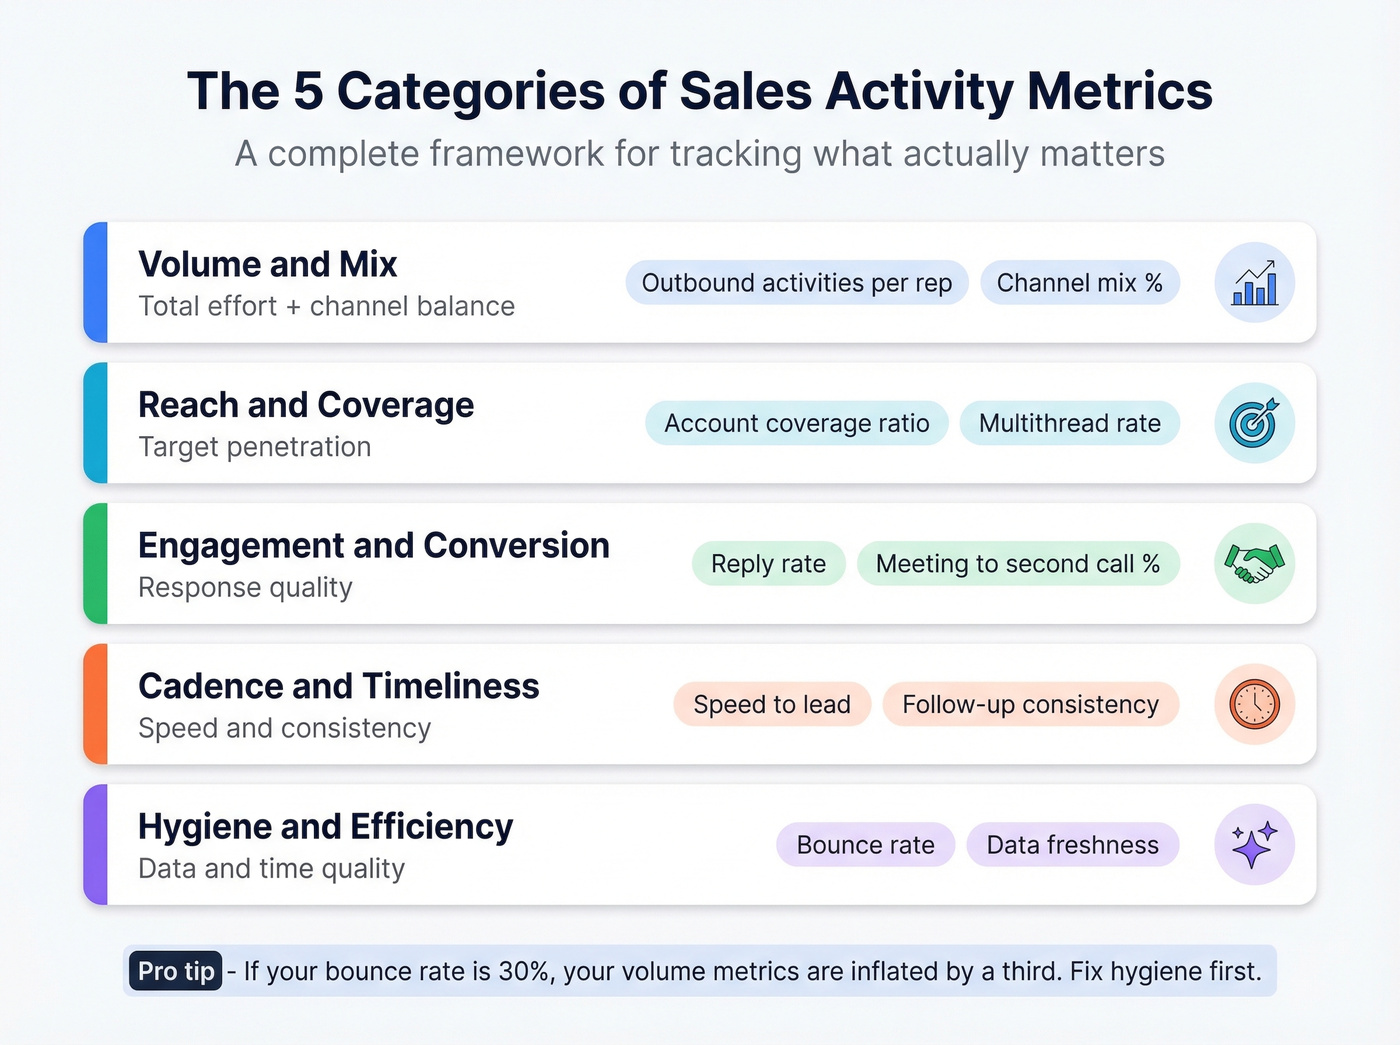
We use a five-category taxonomy that covers the spectrum from raw effort to data quality. Each category serves a different diagnostic purpose.
| Category | What It Measures | Example Metrics | Sample Formula |
|---|---|---|---|
| Volume & Mix | Total effort + channel balance | Outbound activities/rep, channel mix % | Email % = Emails / Total Activities |
| Reach & Coverage | Target penetration | Account coverage ratio, multithread rate | Coverage = Accounts Touched / Total Targets |
| Engagement & Conversion | Response quality | Reply rate, meeting-to-second-call % | Conversion = Meetings / Connects |
| Cadence & Timeliness | Speed and consistency | Speed-to-lead, follow-up consistency | Avg Hours to First Touch |
| Hygiene & Efficiency | Data and time quality | Bounce rate, data freshness, time/activity | Bounce Rate = Bounced / Sent |
Volume & Mix is the baseline. You need to know total activity levels, but raw volume is meaningless without channel distribution. A rep logging 200 activities per week sounds productive until you realize 180 of them are one-line emails to the same 30 accounts.
Reach & Coverage answers the question most volume metrics miss: are we actually touching enough of our target market? The multithread rate - accounts where you've engaged two or more stakeholders - is one of the most underused metrics in outbound. Single-threaded deals die when your one contact changes jobs.
Engagement & Conversion is where activity meets reality. High volume with low reply rates points to a messaging or targeting problem, not an effort problem. Track meeting-to-second-call rate to catch reps who book meetings that go nowhere. This metric alone has saved us from promoting "meeting machines" who never close.
Cadence & Timeliness matters because speed-to-lead is one of the few activity metrics with well-documented impact on conversion. But consistency of follow-up cadence - not just speed on the first touch - is what separates top performers from everyone else.
Hygiene & Efficiency is the category everyone ignores until it torpedoes the other four. If your bounce rate is 30%, your volume metrics are inflated by a third. If reps spend 20 minutes per activity because the CRM is a nightmare, your time-per-activity metric reveals a systems problem, not a people problem.
Build Your Activity Scorecard
The consensus on r/sales is blunt: constant activity pressure feels like babysitting. Veteran reps especially resent it. And they're not wrong - when activity tracking becomes surveillance, it destroys the judgment and timing that make experienced sellers effective.
The fix isn't to stop tracking. It's to track smarter.
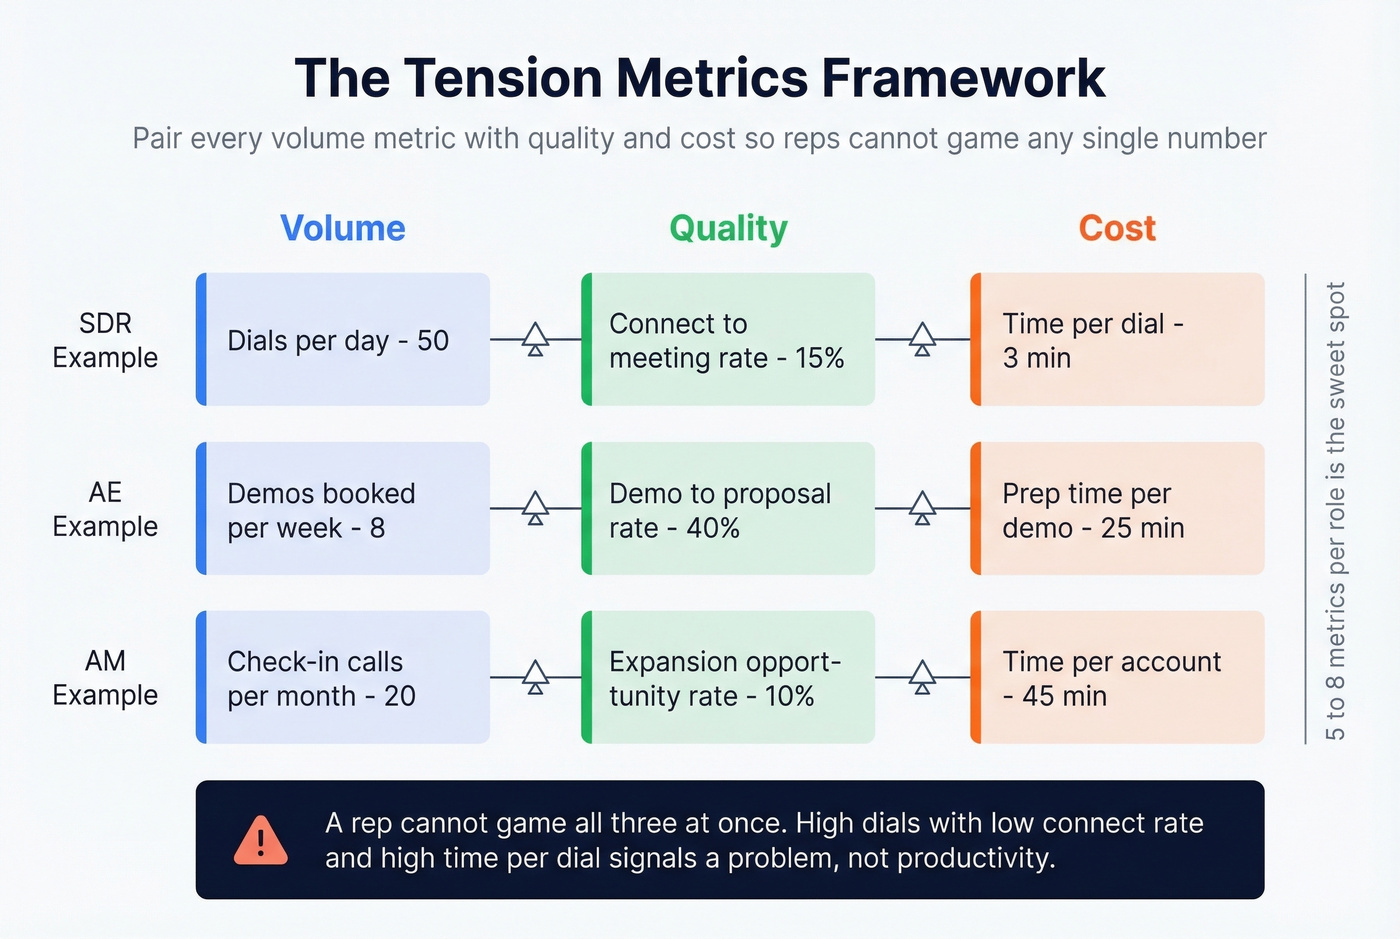
Start with the "tension metrics" framework from a well-upvoted Reddit thread on metric design: pair every volume metric with a quality metric and a cost metric. If you measure dials per day (volume), also measure connect-to-meeting rate (quality) and time-per-dial (cost). A rep can't game all three simultaneously.
Five to eight metrics per role is the sweet spot. SDRs need different metrics than AEs, and AEs need different metrics than account managers. A one-size-fits-all scorecard guarantees that at least one role is being measured on irrelevant activity. If you need a starting list, use these sales activities as your baseline.
Setting Rep Activity Targets
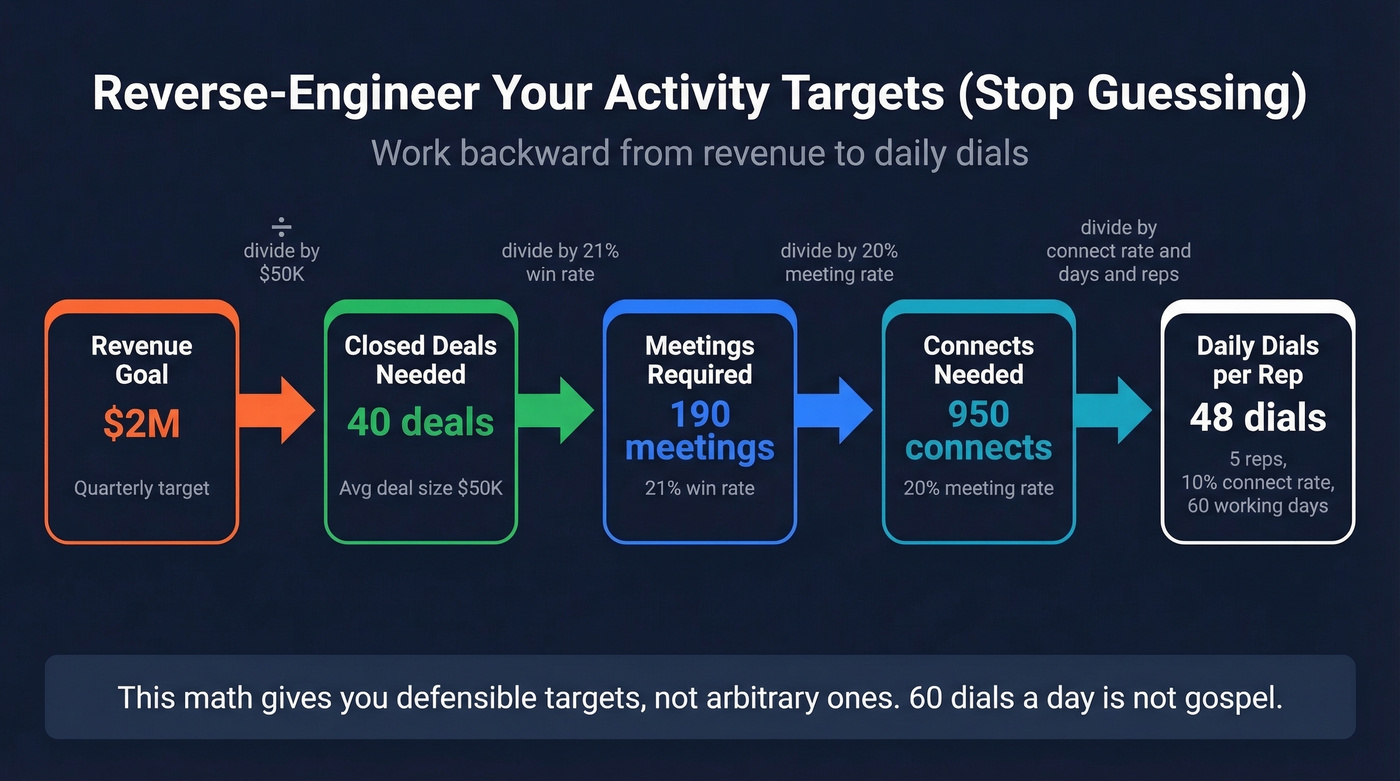
The biggest mistake teams make with sales rep activity targets is pulling numbers out of thin air. "60 dials a day" becomes gospel because a VP heard it at a conference, not because anyone reverse-engineered it from pipeline goals. Work backward instead: how many closed deals do you need, what's your win rate, how many meetings does that require, and how many dials produce a meeting? That math gives you defensible targets, not arbitrary ones.
Weekly 15-minute coaching reviews per rep beat daily dashboard check-ins every time. Daily dashboards create a Pavlovian response - reps optimize for the number that's being watched today, not the behavior that drives pipeline this quarter. Weekly reviews give managers enough data to spot trends and enough distance to have coaching conversations instead of policing ones.
If your reps dread the activity review, you're doing it wrong. The review should answer "what's working and what should we change," not "why didn't you hit 60 dials yesterday."
You just read that bounce rates above 30% inflate every volume metric on your scorecard. Prospeo refreshes all 300M+ profiles every 7 days - not every 6 weeks - so your reps dial real numbers and email real inboxes. 98% email accuracy, 30% mobile pickup rate, and bounce rates under 4% for teams who switched.
Clean your activity data before you try to manage it.
2026 Benchmarks Worth Knowing
Benchmarks are directional, not prescriptive. Your market, deal size, and sales motion will shift these numbers. But you need a starting point.
| Benchmark | Range |
|---|---|
| Active accounts per rep | 100-300 (high-velocity) |
| Book refresh cadence | Every 30-60 days |
| SDR dials per day | 40-80 |
| Time spent selling | ~2 hrs/day |
| Average B2B win rate | 21% |
| Sales cycle change | +32% since 2021 |
Time-allocation stats vary depending on role, segment, and how "selling time" is defined - that's why you'll see both "one-third of time selling" and "~2 hours/day selling" as benchmarks in different studies.
The most actionable benchmark comes from Gradient Works: one company trimmed rep books from sprawling territory lists down to 200-250 high-potential accounts. Their quote - "We used to hand reps zip codes. Now, we hand them opportunity." Win rates jumped from 13% to over 20% in under a year.
That's not an activity metric. It's a coverage decision that made every activity metric downstream more meaningful. Fewer accounts, better targeting, higher conversion on the same effort. This kind of activity prioritization - choosing where reps spend their time before measuring how much they spend - is what separates high-performing teams from busy ones.
Here's the thing: if your average deal is under $15k, you probably don't need 300 metrics or a six-figure tech stack. You need a clean list, a tight scorecard, and a manager who coaches weekly instead of policing daily. Most activity management failures aren't tool problems. They're focus problems.
The Data Quality Blind Spot
Let's walk through a scenario we've seen play out dozens of times. Your SDR team hits 60 dials per day. Pipeline is flat. The manager pulls the data and discovers 35% of phone numbers are disconnected. Your reps made 39 real calls, not 60. Every activity metric on the dashboard is inflated by waste.
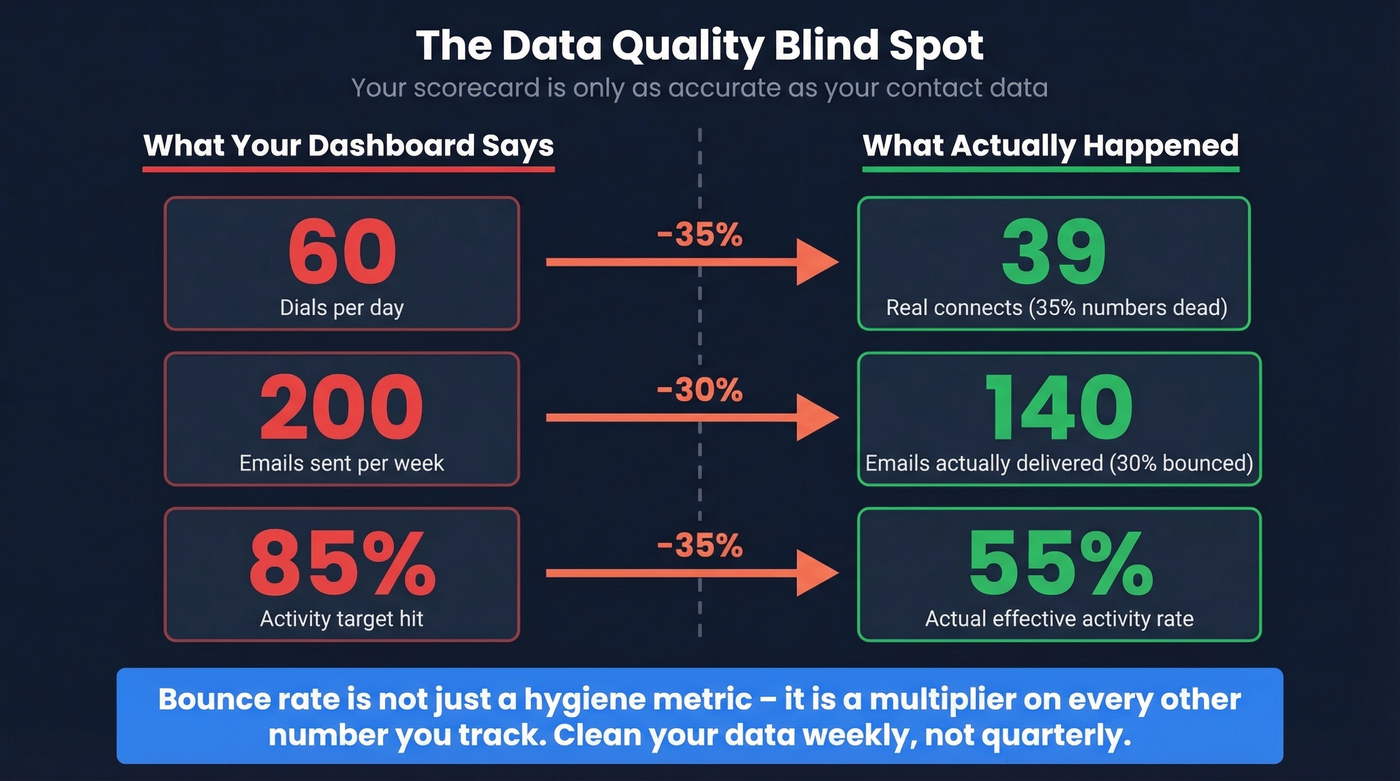
This is the blind spot most teams don't catch until pipeline reviews: your scorecard is only as accurate as your contact data. Bounce rate isn't just a hygiene metric - it's a multiplier on every other number you track. And 79% of sales leaders say their current CRM fails to predict deal outcomes, which is partly a data quality problem, not just a software problem.
Snyk ran into exactly this. Their 50 AEs were prospecting 4-6 hours per week, but bounce rates sat at 35-40%. After switching to Prospeo, bounce rates dropped below 5%. AE-sourced pipeline jumped 180%, generating 200+ new opportunities per month. Same reps, same effort - radically different outcomes because the underlying data was finally accurate.
A 7-day data refresh cycle is what makes this work. The industry average for contact data refresh is six weeks, which means by the time your reps call a number, there's a meaningful chance the person has changed roles. Weekly refresh across 300M+ professional profiles, with 98% email accuracy and 125M+ verified mobile numbers delivering a 30% pickup rate, eliminates the phantom activity problem at the source. If you're diagnosing deliverability issues, start with email bounce rate benchmarks and root causes.
Hygiene & Efficiency is the category everyone ignores - until it wrecks the other four. Prospeo's 5-step verification with catch-all handling, spam-trap removal, and honeypot filtering means your CRM enrichment returns real contacts, not dead ends. 92% match rate, 50+ data points per record, at roughly $0.01 per email.
Stop coaching reps on metrics polluted by bad data.
Tools That Support Activity Tracking
Activity management lives across three layers: a CRM for tracking, an engagement platform for execution, and a data quality layer for accuracy. Most teams have the first two and skip the third - which is like building a house on sand and wondering why the walls crack.
Before picking tools, know what good activity management software actually does. You want a unified activity screen showing all rep touchpoints in one view, automated reminders and follow-up triggers so nothing falls through cracks, mobile capture for field reps logging activities on the go, and activity status tracking that ties inputs to deal progression.
| Layer | Tool | Starting Price | Best For |
|---|---|---|---|
| Data Quality | Prospeo | Free; ~$0.01/verified email | Contact data accuracy |
| CRM | HubSpot Sales Hub | Free; ~$20/user/mo | Best free CRM tier |
| CRM | Salesforce Sales Cloud | ~$25/user/mo | Enterprise workflows |
| CRM | Close | ~$49/user/mo | Calling-heavy teams |
| CRM | Pipedrive | ~$14-25/user/mo | Simplicity |
| CRM | Freshsales | Free; ~$9-19/user/mo | Budget CRM |
| CRM | Zoho CRM | ~$14-23/user/mo | Value suite |
| CRM | Monday Sales CRM | ~$10-12/seat/mo | Visual workflows |
| Intelligence | Gong | By quote | Conversation intelligence |
The CRM handles activity logging and reporting. The engagement layer - your sequencer like Outreach, Salesloft, or Instantly - handles cadence execution. The data quality layer ensures the contacts feeding those sequences are real, current, and reachable. Skip it and you're measuring phantom activity. Every bounced email and disconnected number is a logged "activity" that produced nothing. If you're evaluating vendors, compare data enrichment services and your sales prospecting database options before you lock in a stack.
Mistakes That Kill Activity Programs
Tracking too many metrics. If your QBR slide has 47 metrics, nobody's managing any of them. Pick 5-8 per role. The rest are noise. (If you're standardizing reviews, use these QBR questions to keep it focused.)
Ignoring gaming. When you measure only dials, reps will dial. They'll also hang up after two rings. Pair volume metrics with quality metrics or you're incentivizing theater.
Measuring activity on a broken database. 60 dials on a list with 35% dead numbers is 39 real dials. Your dashboard won't tell you that unless you're tracking bounce rate and data freshness alongside volume.
Daily dashboards instead of weekly coaching. Daily visibility creates daily anxiety. Reps start optimizing for today's number instead of this quarter's pipeline. Weekly reviews give enough signal to coach without creating a surveillance culture.
One-size-fits-all metrics. SDRs, AEs, and account managers do fundamentally different work. An SDR's volume metrics are irrelevant for an AE managing 30 enterprise accounts. Build role-specific scorecards or don't bother.
Setting activity goals without context. Telling a team to "make more calls" without tying those goals to pipeline math creates resentment and wasted motion. Activity-oriented sales goals work when they're reverse-engineered from revenue targets and adjusted for data quality - otherwise they're just arbitrary quotas that punish reps for systemic problems. If you need a repeatable outbound system, start with sales prospecting techniques and tighten your sales follow-up templates.
Sales Activity Management FAQ
What's the difference between sales activities and sales outcomes?
Activities are the inputs you control - calls, emails, meetings, follow-ups. Outcomes are the results - revenue, win rate, deal size. Activity management focuses on optimizing inputs because they're the only lever reps and managers can directly pull. Tracking both and connecting them through conversion ratios is what makes coaching actionable.
How many activity metrics should I track per role?
Five to eight per role is the sweet spot. Research shows 306+ metrics tracked across sales organizations, but only 17% are directly manageable. Pair each volume metric with a quality and cost metric to prevent gaming - this "tension metrics" approach keeps scorecards honest.
How does data quality affect activity metrics?
If 30-40% of your contact data bounces, every activity metric is inflated by waste - 60 dials becomes 39 real conversations. Teams using weekly-refresh verified data see bounce rates drop below 5% and pipeline grow over 100%, which is exactly what happened when Snyk cleaned up their contact database.
How should managers prioritize rep coaching?
Start by identifying which reps show high volume but low conversion - that pattern signals a targeting or messaging problem, not an effort problem. Segment accounts by potential value and buying signals, then coach reps to allocate effort accordingly. Without clear prioritization, reps default to working whoever responds first, often spending the most time on the least valuable opportunities.