How to Build a Sales Budget That Doesn't Fall Apart by February
Your leadership team just handed down a 25% quota increase for the year. You hit actual plan two months last year. The reps are already doing the math on their draw, and finance is wondering why pipeline coverage looks thin.
One sales rep on r/sales described this exact scenario - a 25% bump with no additional headcount, no new territories, and no explanation for how the math was supposed to work. This is what happens when sales budgeting gets done top-down with a spreadsheet and a prayer, and it's more common than anyone admits. 84% of sales reps didn't meet quota last year. The budget wasn't the only reason, but it was the first domino.
What You Need (Quick Version)
Your sales budget needs five things to survive contact with reality: historical conversion data, capacity math, three revenue scenarios, a template with separate expense/income/analysis sheets, and a monthly variance cadence. If you already have a working budget and just want to stress-test it, skip to the mistakes section.
What Is a Sales Budget?
A sales budget is a financial plan that estimates how much revenue your sales team will generate over a defined period - and what it'll cost to get there. It's not a forecast. It's not an expense report. People confuse all three constantly.
Your sales budget sets the target: we expect $4.2M in revenue this year, and we'll spend $1.1M on the team to get it. Your sales forecast is a rolling prediction of what you'll actually close based on current pipeline (if you need a clean breakdown, see sales forecast vs goal). Your sales expense budget is the cost side only - headcount, tools, travel, commissions. These three documents talk to each other, but they aren't the same thing. Treating them interchangeably is how you end up with a "budget" that's really just a revenue wish list with no cost discipline underneath.
Why Budgets Matter Beyond the Obvious
A well-constructed budget does three things: it aligns headcount and spend to a revenue target your team can actually hit, it gives finance the confidence to release funds for hiring and tools, and it creates an early-warning system when reality diverges from plan. Without one, you're flying blind - and that 84% quota miss rate suggests most teams already are.
How to Build a Sales Budget in 5 Steps
Pick Your Budget Structure
You've got three structural choices, and each implies a different philosophy about how much you trust your historical data.
Top-down means leadership sets a revenue target and you reverse-engineer the team and spend to hit it. Bottom-up means reps and managers build territory-level estimates that roll up into a company number. Zero-based means you justify every dollar from scratch each cycle, with no "last year plus 15%" shortcuts.
Most teams use a hybrid - leadership sets a directional target, and sales ops builds the bottom-up model to pressure-test it. If your revenue is volatile, use a rolling quarterly budget instead of a static annual plan. When monthly revenue swings between $12K and $68K, an annual budget is fiction by March. Rolling forecasts let you adjust assumptions every 90 days without abandoning the annual frame entirely.
Forecast Revenue in Three Tiers
Don't forecast revenue as a single number. Break it into three probability-weighted tiers:
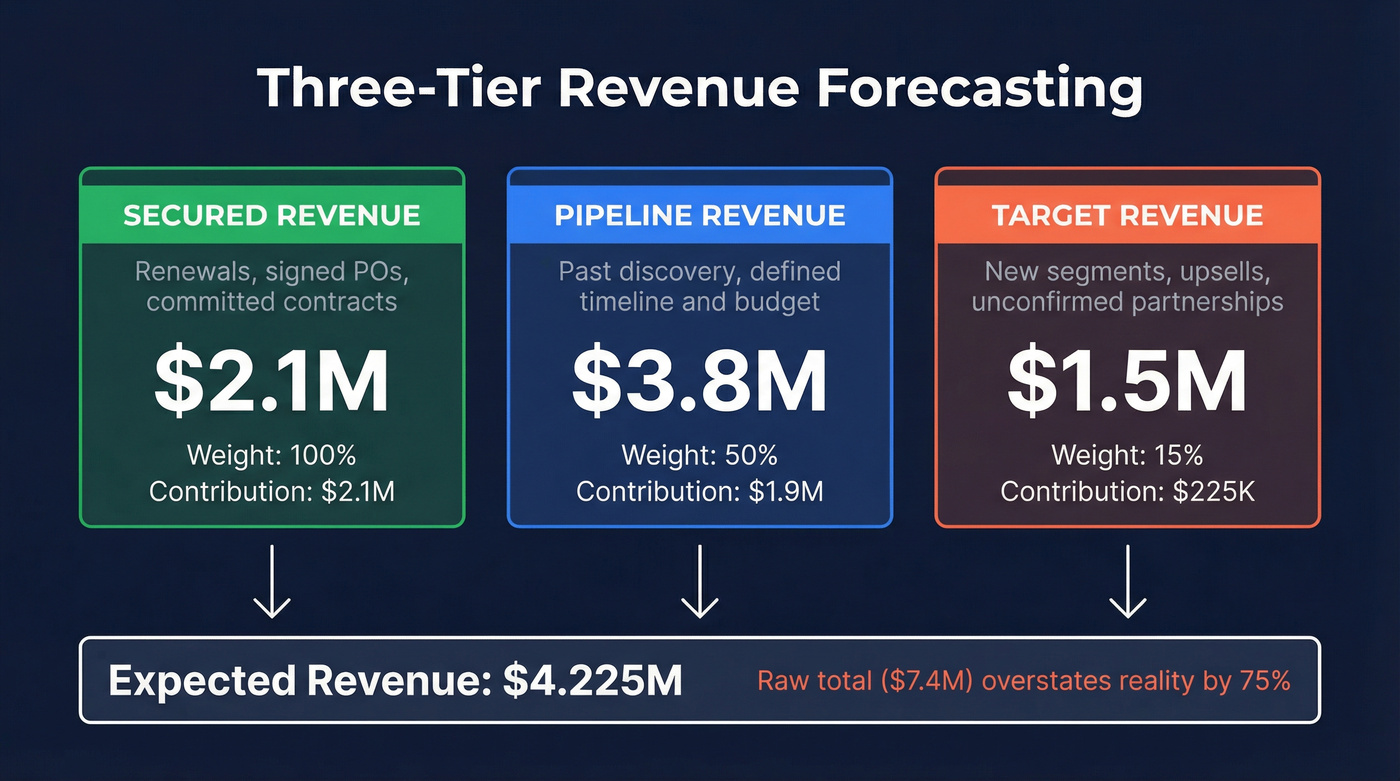
Secured revenue includes renewals, committed contracts, and anything with a signed PO. That's your floor. Pipeline revenue covers high-probability opportunities - deals past discovery with a defined timeline and budget. Weight these at 40-60% depending on your historical conversion rates (use sales conversion rate benchmarks if you’re missing clean data). Target revenue is the strategic ambition layer: expansion into new segments, upsell campaigns, partnerships that haven't closed yet. Weight these at 10-20%.
Say your secured revenue is $2.1M, pipeline is $3.8M weighted to $1.9M at 50%, and target is $1.5M weighted to $225K at 15%. Your expected revenue is $4.225M, not the $7.4M that shows up if you add the raw numbers. This tiered approach - a model SIA Consultancy recommends - prevents the most dangerous mistake in budgeting: treating pipeline as revenue.
Here's the thing most guides skip: adjust your tier weights by quarter if your business has any seasonality. A B2B company selling to schools will see pipeline dry up in summer. A company selling to retailers will see Q4 spike. Flat weights across all four quarters make your Q1 and Q3 budgets look identical when the underlying reality is anything but.
Run the Capacity Math
This is where most budgets either earn credibility or lose it.
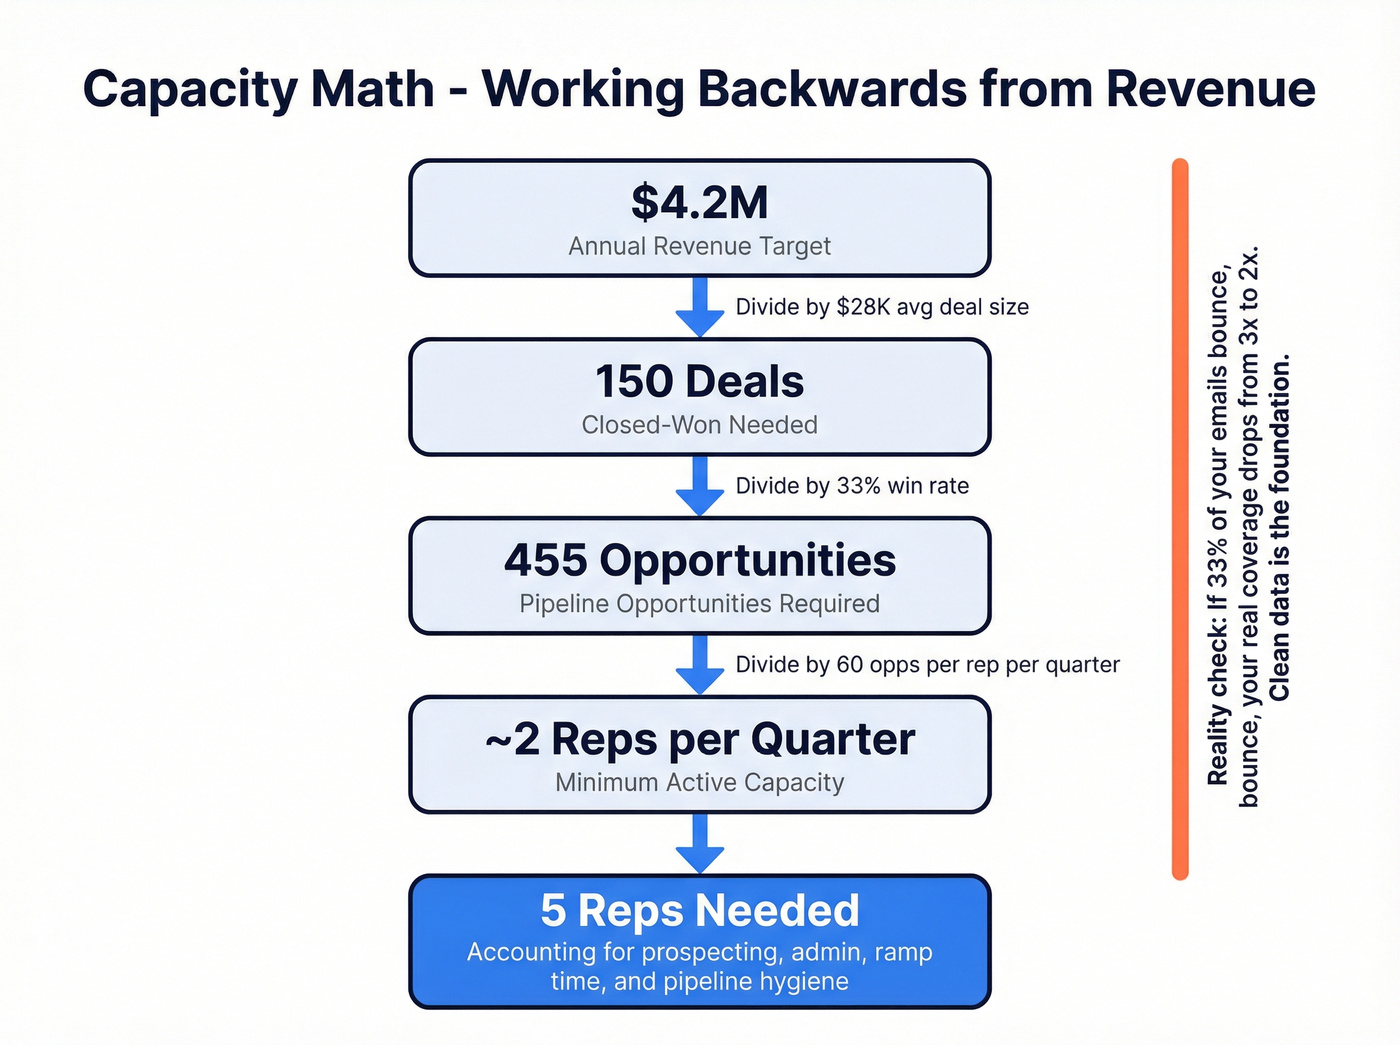
Start with your revenue target ($4.2M). Divide by average deal size ($28K) to get deals needed (150). Divide by your win rate to get opportunities needed. Here's the benchmark that matters: opportunities closed within 50 days convert at a 47% win rate, but deals that drag past that threshold drop below 20%. Use your own win rate if you have it; if you don't, 30-35% is a reasonable starting point for B2B.
At a 33% win rate, you need roughly 455 opportunities to close 150 deals. Now sanity-check rep capacity. If a rep can actively work around 60 opportunities per quarter, you need about 2 reps' worth of capacity just to touch 455 opps - and more once you account for prospecting, meetings, follow-ups, and admin (see sales activities if you need a baseline list). This is why capacity math has to be grounded in your actual activity data, not just a quota spreadsheet.
Pipeline coverage of 3-4x only works if your data is clean. If a third of your emails bounce, your real coverage is 2x and your capacity math is built on sand. We've seen teams fix this overnight by running their lists through Prospeo's verification - 98% email accuracy on a 7-day refresh cycle keeps pipeline numbers honest so the math downstream actually holds.
Model Three Scenarios
Build three versions of your budget: conservative (10-20% below your expected case), expected, and optimistic (10-20% above).
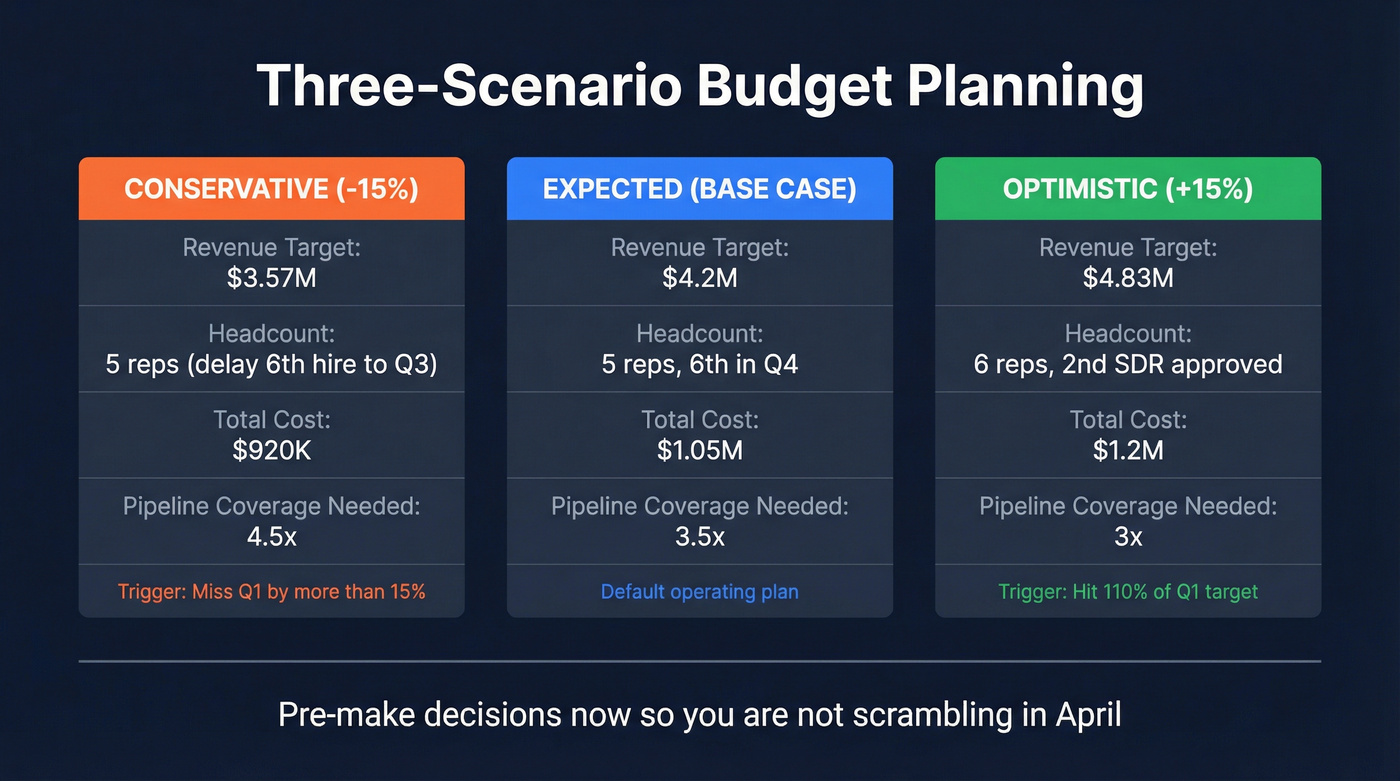
The conservative scenario isn't pessimism - it's your contingency plan. It answers the question every CFO will ask: "What happens if we miss?" Each scenario should adjust revenue assumptions and the corresponding expense decisions. In the conservative case, maybe you delay that sixth hire until Q3. In the optimistic case, you pre-approve budget for a second SDR. The point isn't to predict the future. It's to pre-make decisions so you aren't scrambling in April.
Document Assumptions and Get Sign-Off
Every number in your budget rests on an assumption. Write them down. Average deal size: $28K, based on trailing four quarters. Win rate: 33%. Ramp time for new reps: 4 months to full productivity (a simple 30-60-90 day plan helps make ramp assumptions real). Sales cycle: 45-60 days. Commission rate: 10% of closed revenue.
Finance needs to validate these - not because they know your pipeline better than you do, but because they'll catch the assumptions you're unconsciously optimistic about. Cycle length, ramp time, and especially conversion rates are the usual culprits. If leadership is pushing a top-down number that your bottom-up model can't support, this is where you push back with data. "We'd need 7 reps to hit that target. We have budget for 5. Here's what 5 reps can realistically deliver." That conversation is uncomfortable, but it's better than missing plan by 30% and having it be a surprise.
Core Components of a Sales Budget
Every plan breaks down into these elements, and understanding each one helps you avoid gaps that surface mid-year:
- Revenue targets - broken out by rep, territory, segment, and quarter
- Headcount costs - base salaries, on-target earnings, benefits, and ramp-adjusted quotas for new hires
- Variable compensation - commissions, bonuses, and SPIFs tied to closed revenue
- Tools and technology - CRM licenses, prospecting platforms, dialers, data providers (your stack choices matter; compare options in sales prospecting databases)
- Travel and entertainment - field visits, conferences, client dinners
- Training and enablement - onboarding programs, coaching tools, ongoing skill development
Track each line item separately. Lumping "tools" and "travel" into a single "other" category makes it impossible to know where you're overspending when the quarterly review arrives.
Sales Budget Template
Your template doesn't need to be fancy, but it does need structure. The most effective setup uses three separate sheets - a model Sheetgo describes well for budget-vs-actual workflows:
Sheet 1: Expenses. Columns for rep name, territory, base salary, commission (projected), tools/licenses, travel, training, and total cost. Sheet 2: Income. Columns for rep name, territory, quota, pipeline value, weighted pipeline, actual revenue updated monthly, and variance. Sheet 3: Master Analysis. The CFO's view - pulls from both sheets and shows budget vs. actual at the team, territory, and company level with monthly and YTD rollups.
Here's what a completed budget looks like for a 5-rep mid-market team targeting $4.2M:
| Line Item | Q1 | Q2 | Q3 | Q4 | Annual |
|---|---|---|---|---|---|
| Revenue Target | $950K | $1.05M | $1.1M | $1.1M | $4.2M |
| Headcount (reps) | 5 | 5 | 5 | 6 | - |
| Base Salary | $125K | $125K | $125K | $150K | $525K |
| Commission (10%) | $95K | $105K | $110K | $110K | $420K |
| Tools/Licenses | $15K | $15K | $15K | $18K | $63K |
| Travel | $10K | $10K | $10K | $12K | $42K |
| Total Cost | $245K | $255K | $260K | $290K | $1.05M |
Notice the Q4 bump - that's the sixth rep coming online. Your budget should reflect hiring timing, not just annual averages. The revenue target also ramps through the year, accounting for the new rep's 4-month ramp period.
Google Sheets or Excel works fine for smaller teams. Beyond 10-15 reps, you'll want an FP&A tool like Mosaic, Pigment, or Cube (typically $1,000-10,000+/month depending on team size) that connects to your CRM. The template structure stays the same either way - three views, three audiences, one source of truth.
Your capacity math is only as good as your contact data. If a third of your emails bounce, that 3x pipeline coverage is really 2x - and your budget is built on sand. Prospeo delivers 98% email accuracy on a 7-day refresh cycle, so every opportunity in your model maps to a real, reachable buyer.
Stop budgeting around bad data. Start with contacts that connect.
SaaS Sales Budgeting
SaaS budgets are structurally different because of recurring revenue. You're not budgeting for one-time transactions - you're modeling new business, renewals, expansion, and churn as separate streams. Lumping them into one pipeline is a common mistake that makes your forecast look healthier than it is (if you need a framework, start with churn analysis).
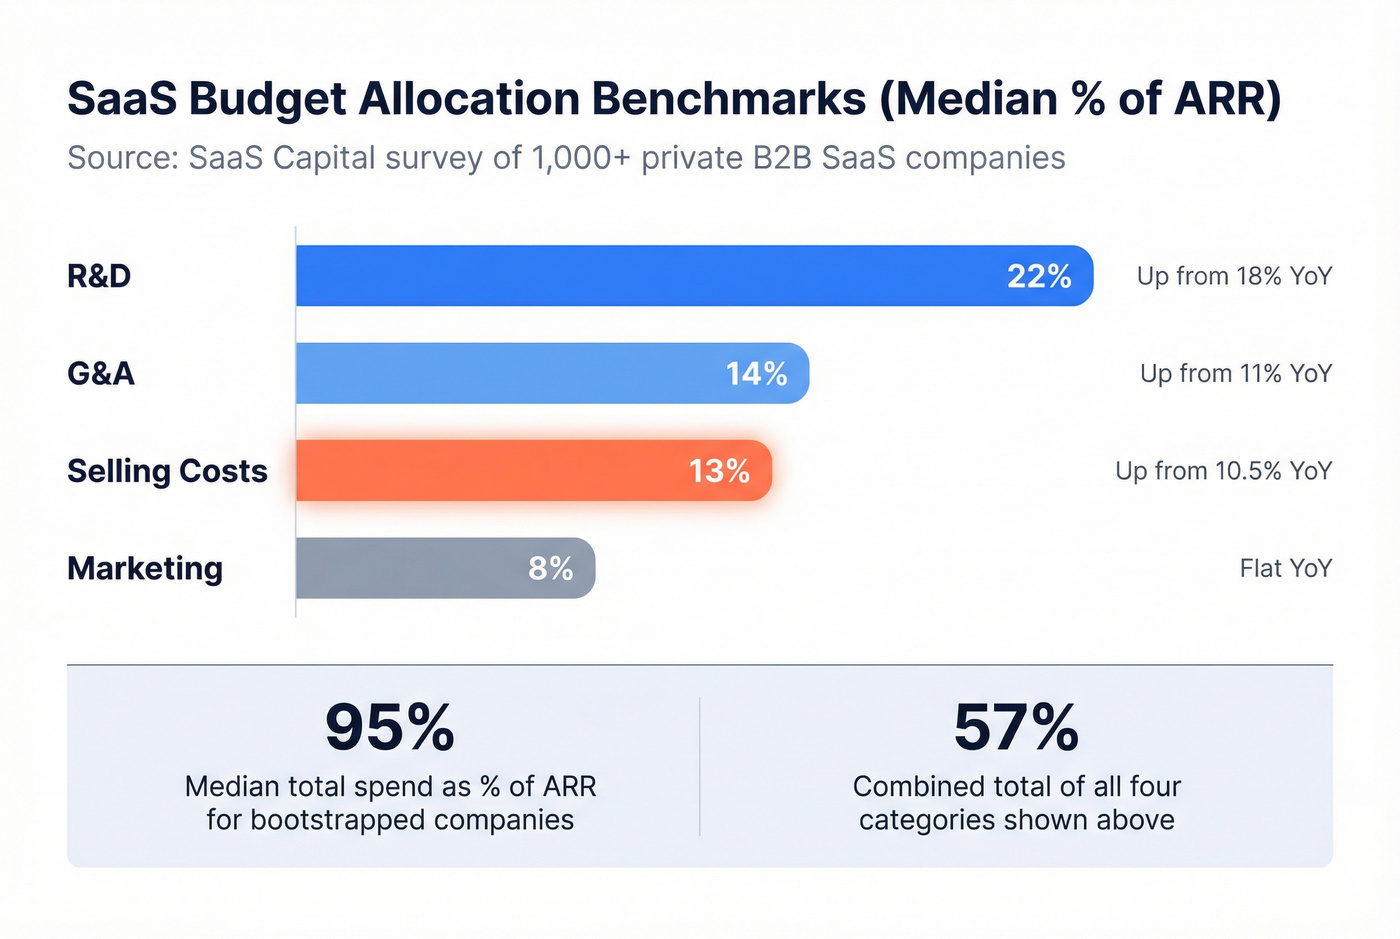
SaaS Capital's survey of 1,000+ private B2B SaaS companies gives us the clearest benchmarks for budget allocation:
| Category | Median % of ARR | YoY Change |
|---|---|---|
| Selling Costs | 13% | Up from 10.5% |
| Marketing | 8% | Flat |
| R&D | 22% | Up from 18% |
| G&A | 14% | Up from 11% |
Bootstrapped companies spend a median of 95% of ARR across all departments. Equity-backed companies spend 107% - which is why 85% of bootstrapped SaaS companies are profitable versus just 46% of funded ones. If you're bootstrapped, your selling cost envelope needs to stay around that 13% mark or you're eating into margin that funds everything else.
Let's be honest: most SaaS companies over-invest in sales headcount and under-invest in data quality. Adding a sixth rep costs $150K-$250K+ fully loaded. Cleaning your pipeline data so your existing five reps aren't wasting 30% of their time on dead contacts costs a fraction of that - and often delivers more incremental revenue.
One more thing: don't calculate ARR by multiplying MRR by 12. MRR fluctuates with renewals, churn, expansion, and seasonality. Your ARR should reflect annual contract values, not a monthly snapshot extrapolated forward. Getting this wrong inflates your revenue baseline, which inflates your budget, which inflates your hiring plan. It compounds fast.
Metrics That Drive Your Budget
Every assumption in your budget maps to a metric. These are the ones that matter most:
| Metric | Benchmark | Why It Matters |
|---|---|---|
| Win Rate | 47% within 50 days | Sets opportunity volume |
| Pipeline Coverage | 3-4x target | Below 3x = high miss risk |
| Sales Cycle | 34% of teams: 1-2 quarters | Affects cash flow timing |
| Quota Attainment | 84% of reps miss | Budget for real attainment |
| CAC | Varies by segment | Total sales cost / new customers |
| CLTV:CAC Ratio | 3:1+ healthy | Below 3:1 = overspending |
The win rate benchmark deserves special attention. If your average sales cycle runs longer than 50 days, your effective win rate is probably below 20%. That single metric can double the number of opportunities - and reps - your budget needs. Segment your win rates by source and motion, or your capacity math will be wrong.
Best Practices
A few principles separate budgets that hold up from those that collapse:
Tie every dollar to a metric. If you can't explain what a line item produces in pipeline or revenue, cut it or justify it with a test period.
Budget for attrition. Assume 15-20% annual rep turnover and build the recruiting and ramp costs into your plan rather than treating departures as surprises.
Separate new business from expansion. They have different costs, cycle lengths, and conversion rates. Blending them hides problems in both.
Lock assumptions, not the plan. Your assumptions should be documented and revisited quarterly. The plan adjusts when assumptions prove wrong, not when leadership gets nervous.
Invest in data hygiene early. Accurate contact data reduces wasted outreach and makes every other budget line item more efficient. We've watched teams cut their bounce rate from 35% to under 4% just by verifying their lists before launch - that's pipeline coverage you're leaving on the table otherwise (more on bounce-rate targets in email bounce rate).
7 Mistakes That Blow Up Sales Budgets
1. Quota inflation without capacity analysis. A 25% quota increase requires 25% more pipeline, higher win rates, or larger deals. If none of those changed, you set a number nobody can hit. Back every increase with a capacity model.
2. No ramp assumptions. A rep taking over a volatile territory needs 3-6 months before full quota. Build ramp schedules - 25/50/75/100% over four months.
3. Ignoring cash flow timing. Revenue booked isn't cash received. Net-30 or net-60 terms mean Q1 revenue might not hit the bank until Q2. Model cash collection separately from revenue recognition.
4. Treating the budget as a formality. Build it in November, ignore it until next cycle, and it's not a budget - it's a document. Monthly variance reviews, minimum.
5. Over-reliance on "last year + 20%." Percentage increases ignore market shifts, team changes, and competitive dynamics. Use unit-based targets - deals, customers, ACV - instead of blanket lifts.
6. Mixing pipelines. New business, renewals, and expansion have different conversion rates, cycle lengths, and costs. Blending them inflates forecast confidence. Model each pipeline separately. Before finalizing assumptions, audit a segment of your prospect list with a verification tool - even 75 verified emails is enough to see how much of your pipeline is actually reachable.
7. No variance review cadence. Without regular check-ins, you won't catch a miss until it's too late. Monthly reviews for actuals, quarterly re-forecasts for assumptions.
Budget vs. Actual: Tracking
A budget that doesn't get reviewed monthly is just a planning exercise.
Monthly: Compare actual revenue and expenses to budget by rep, territory, and segment. Flag variances over ~15%. Don't re-forecast yet - just identify the gaps and understand why. Was it a timing issue or a structural one?
Quarterly: Re-forecast based on updated pipeline data and actual performance. If your win rate is running at 25% instead of 33%, your full-year number needs to change. Rolling forecasts let you do this without throwing out the annual plan.
Look, 10-30% variance is normal, especially in the first half of the year. The goal isn't zero variance - it's catching structural problems before they compound. A team that's 15% behind in Q1 can recover. A team that doesn't notice until Q3 can't. And a team with $12K/month in fixed costs and revenue that sometimes doesn't cover them can't wait until December to discover the annual plan was fiction.
AI in Sales Budgeting
81% of sales teams are already using AI in some capacity, and budgeting is where it saves the most analyst hours. The practical capabilities today: anomaly detection that flags when a territory's pipeline drops 30% week-over-week, scenario modeling that runs 50 what-if cases instead of 3, natural-language querying, and real-time dashboards that update as CRM data changes.
The direction is clear: manual spreadsheet budgets to automated FP&A tools to autonomous agents that surface exceptions and recommend adjustments with human oversight. We're solidly in the middle phase. Tools like Cube, Pigment, and Mosaic handle the automation layer. The agentic layer - where AI refreshes forecasts and flags re-allocation opportunities without being asked - is emerging but not yet reliable enough to trust without heavy oversight.
Don't wait for the autonomous future to modernize your process. Even connecting your CRM to a basic dashboard that auto-updates pipeline coverage saves hours of manual reconciliation every month (if you’re evaluating platforms, start with sales forecasting tools).
FAQ
How often should you update a sales budget?
Monthly variance reviews are the minimum - compare actuals to plan, flag gaps over 15%, and investigate root causes. Quarterly re-forecasts are essential when revenue patterns shift fast. Annual-only budgets create a false sense of certainty that breaks down by Q2.
Who owns the sales budget?
The VP of Sales or CRO builds the budget with input from frontline managers. Finance validates assumptions - conversion rates, cycle length, capacity, and cost models. Sales Ops maintains the living model and runs monthly variance reports. Cross-functional sign-off between sales, finance, and ops is non-negotiable.
What's a normal budget-to-actual variance?
Expect 10-30% depending on segment maturity and seasonality. Enterprise segments with longer cycles tend toward higher variance in any given quarter. Anything above 20% for two consecutive quarters signals a structural problem - revisit your win rate, deal size, or pipeline generation assumptions.
How does data quality affect sales budgeting accuracy?
Bad contact data inflates pipeline coverage and distorts capacity math. If 30% of your emails bounce, your 3x coverage is really 2x. Verification tools close this gap fast - Prospeo's free tier handles 75 emails/month, enough to benchmark your list quality before committing budget dollars.
You just built a three-scenario budget with 455 opportunities needed. Now ask: can your reps actually reach those prospects? Teams using Prospeo book 26% more meetings than ZoomInfo users - at $0.01 per verified email. That's the kind of cost efficiency that makes your conservative scenario look like your expected case.
Hit your revenue targets without blowing your sales tool budget.