Sales Churn: What It Really Means and How to Fix It
You lost $3M in renewals last year. Your VP of Sales calls it "churn." Your CS leader calls it "churn." Your CFO calls it "churn." They're all talking about different things - and that disconnect is why nobody's actually fixing the problem.
"Sales churn" gets thrown around in pipeline reviews, board decks, and Slack threads, but no two people define it the same way. It can mean customers leaving because of something the sales team did, revenue disappearing from a rep's book of business, or reps themselves walking out the door. Most articles pick one definition and ignore the other two. We're covering all three here - formulas, benchmarks, and the fixes that actually move the needle.
The Three Things People Mean
When someone says "sales churn," they're usually talking about one of these:
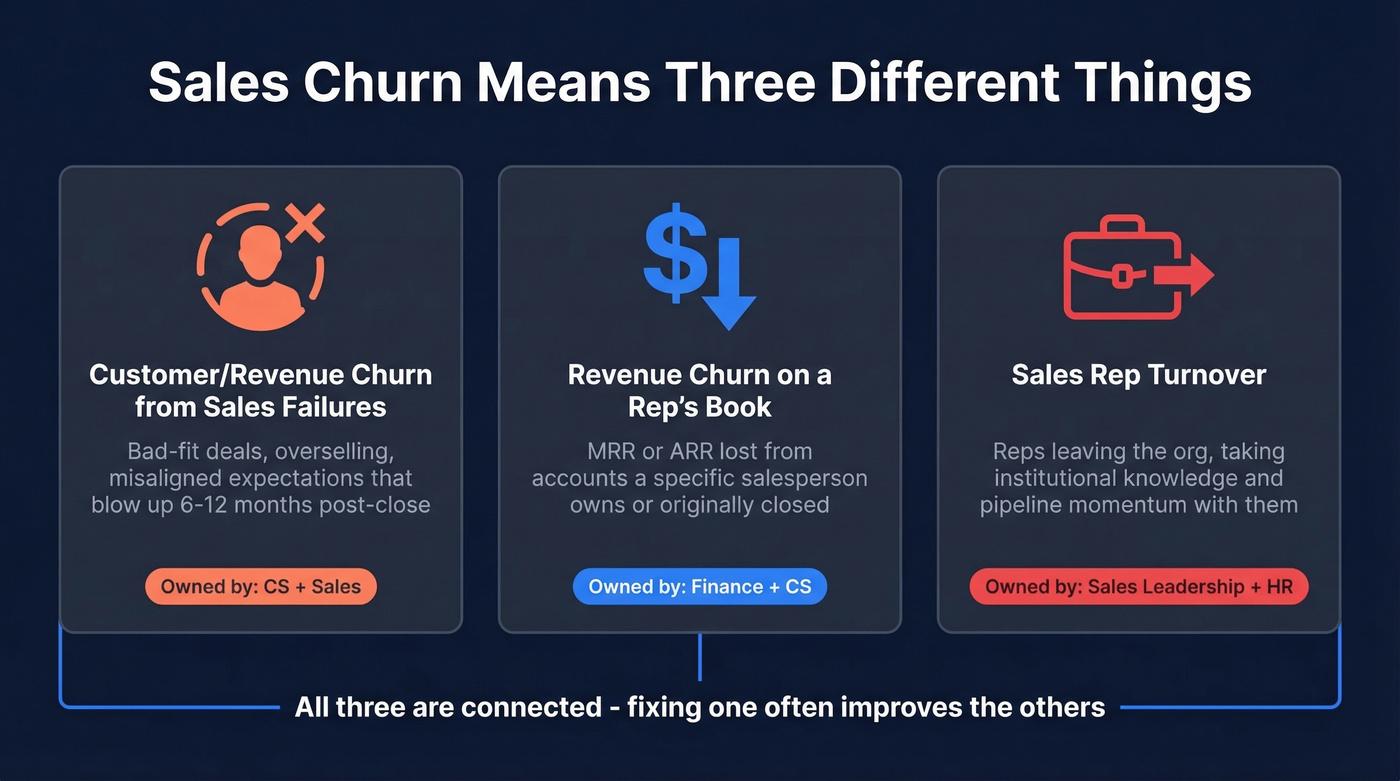
- Customer/revenue churn caused by sales-motion failures - bad-fit deals, overselling, misaligned expectations that blow up 6-12 months post-close.
- Revenue churn on a rep's book - the MRR or ARR lost from accounts a specific salesperson owns or originally closed.
- Sales rep turnover - reps leaving the org, taking institutional knowledge and pipeline momentum with them.
If you're going to track one number, make it net revenue retention. It captures expansion, contraction, and cancellation in a single metric that tells you whether your customer base is growing or shrinking without new logos.
Here's the thing: most companies don't have a churn problem. They have a selling-to-the-wrong-people problem. Fix the data and the targeting first, and half your attrition fixes itself.
What "Sales Churn" Actually Means
This isn't a consistently defined metric. Teams use it as shorthand for different retention problems, which creates real confusion when leadership tries to diagnose why numbers are slipping. One thing you can see in practitioner discussions: people usually frame the problem as customer churn, not a separate taxonomy.
Here's the breakdown that actually matters:
| Type | What It Measures | Who Owns It |
|---|---|---|
| Customer (logo) churn | Accounts lost in a period | CS + Sales |
| Revenue churn | MRR/ARR lost from cancellations and downgrades | Finance + CS |
| Rep turnover | Salespeople leaving the org | Sales leadership + HR |
All three fall under the umbrella depending on who's talking. The first two are about your customers; the third is about your team. They have different formulas, different benchmarks, and different fixes. Conflating them guarantees you'll solve the wrong problem.
The reason this matters for sales specifically: your sales motion is often the cause of customer and revenue churn, not just a bystander. Bad-fit deals, oversold features, and misaligned expectations all originate in the sales cycle. And when reps leave, the pipeline gaps they create accelerate customer losses too. These three metrics are connected, even if your org tracks them in separate dashboards.
How to Calculate Churn Rate
Customer (Logo) Churn Rate
The simplest version. Take the number of customers you lost during a period, divide by the number you had at the start, multiply by 100.
Formula: (Customers lost / Customers at start of period) x 100
If you started Q1 with 500 customers and lost 20, your quarterly logo churn is 4%. Straightforward - but it treats a $500/mo account the same as a $50,000/mo account. That's why you need revenue churn alongside it.
Build cohort tracking into your process. If your January 2026 cohort retains better than your September 2025 cohort, you know your sales motion or product is improving. Without cohort analysis, aggregate churn rates mask whether things are getting better or worse over time.
Gross vs. Net Revenue Churn
This is where it gets useful.
Gross revenue churn: (Cancellation MRR + Downgrade MRR) / Starting MRR x 100
Net revenue churn: (Cancellation MRR + Downgrade MRR - Expansion MRR) / Starting MRR x 100
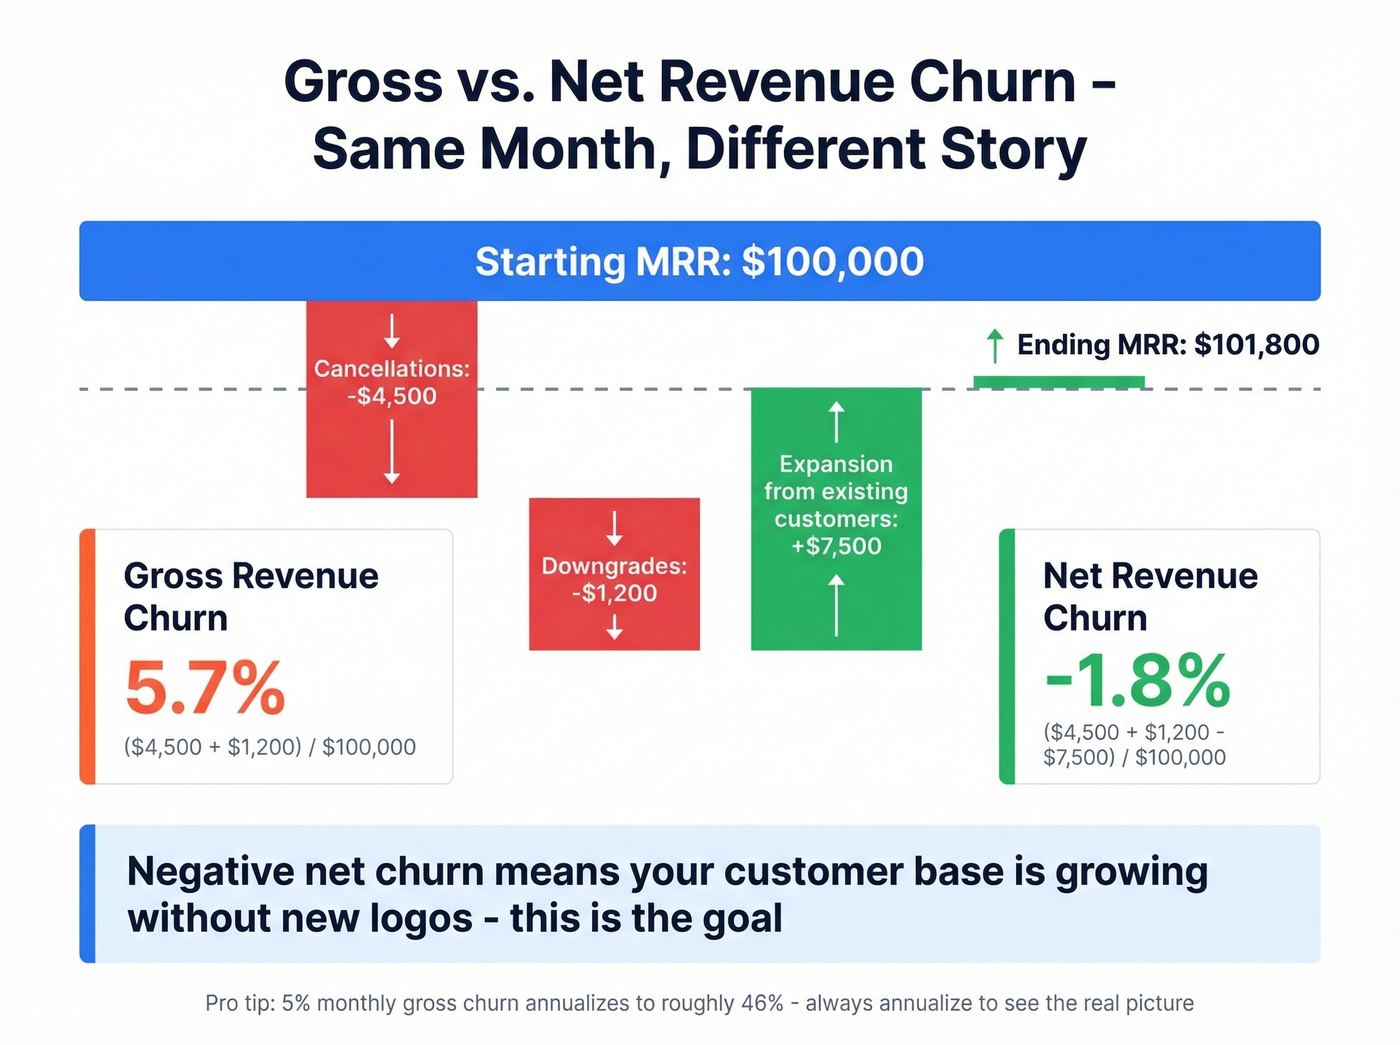
Let's run the numbers. You start the month with $100,000 in MRR. You lose $4,500 to cancellations and $1,200 to downgrades. But existing customers expand by $7,500 through upsells and add-ons.
- Gross revenue churn: ($4,500 + $1,200) / $100,000 = 5.7%
- Net revenue churn: ($4,500 + $1,200 - $7,500) / $100,000 = -1.8%
That negative number is the goal. It means your existing customer base is growing even without new logos. To annualize monthly churn, use: 1 - (1 - monthly churn rate)^12. A 5% monthly gross churn annualizes to roughly 46% - which looks a lot scarier than the monthly number suggests.
Common Calculation Mistakes
The r/SaaS community has flagged these, and we've seen every one of them in client dashboards:
- Wrong denominator. Using end-of-month customer count instead of start-of-month. This deflates your churn rate and makes things look better than they are.
- Mixing logo and revenue churn into one number. They tell different stories. Report them separately.
- Including trials and internal accounts. A trial that doesn't convert isn't churn - it's a failed conversion. Strip these out.
- LTV inflation. The classic ARPU / churn formula for lifetime value usually produces bloated numbers because churn isn't constant across cohorts. Early-stage customers churn at wildly different rates than customers who've been with you for two years. Use cohort-based LTV instead.
Logo Churn vs. Revenue Churn
These two metrics can tell completely opposite stories. A company can have 5% customer churn and 0% net revenue churn simultaneously. How? The remaining customers expand enough to cover the lost revenue.
This is exactly the dynamic described in Lighter Capital's analysis - and it's why revenue churn is a huge indicator of growth potential. A business with high logo churn but negative net revenue churn has a retention problem with small accounts and an expansion engine with large ones. That's a very different diagnosis than "we're losing customers."
For sales leaders, the implication is clear: not all attrition is equal. Losing ten $200/mo accounts hurts less than losing one $50,000/mo account, but logo churn treats them the same. Track both. Report both. Make decisions on revenue churn, but use logo churn as an early warning system for product-market fit issues in specific segments.
Half of customer churn traces back to bad-fit deals - prospects who never should have entered your pipeline. Prospeo's 30+ filters (buyer intent, technographics, headcount growth, funding) let you target accounts that actually match your ICP. 98% email accuracy means your reps reach real decision-makers, not dead ends that inflate your pipeline and deflate your retention.
Stop closing deals that churn. Start with better data.
Benchmarks for 2026
Customer Churn Rates
| Segment | Overall | Voluntary | Involuntary |
|---|---|---|---|
| B2B (Software + Services) | 3.8% | - | - |
| B2C / DTC | 6.5% | - | - |
| All subscriptions | 3.27% | 2.41% | 0.86% |
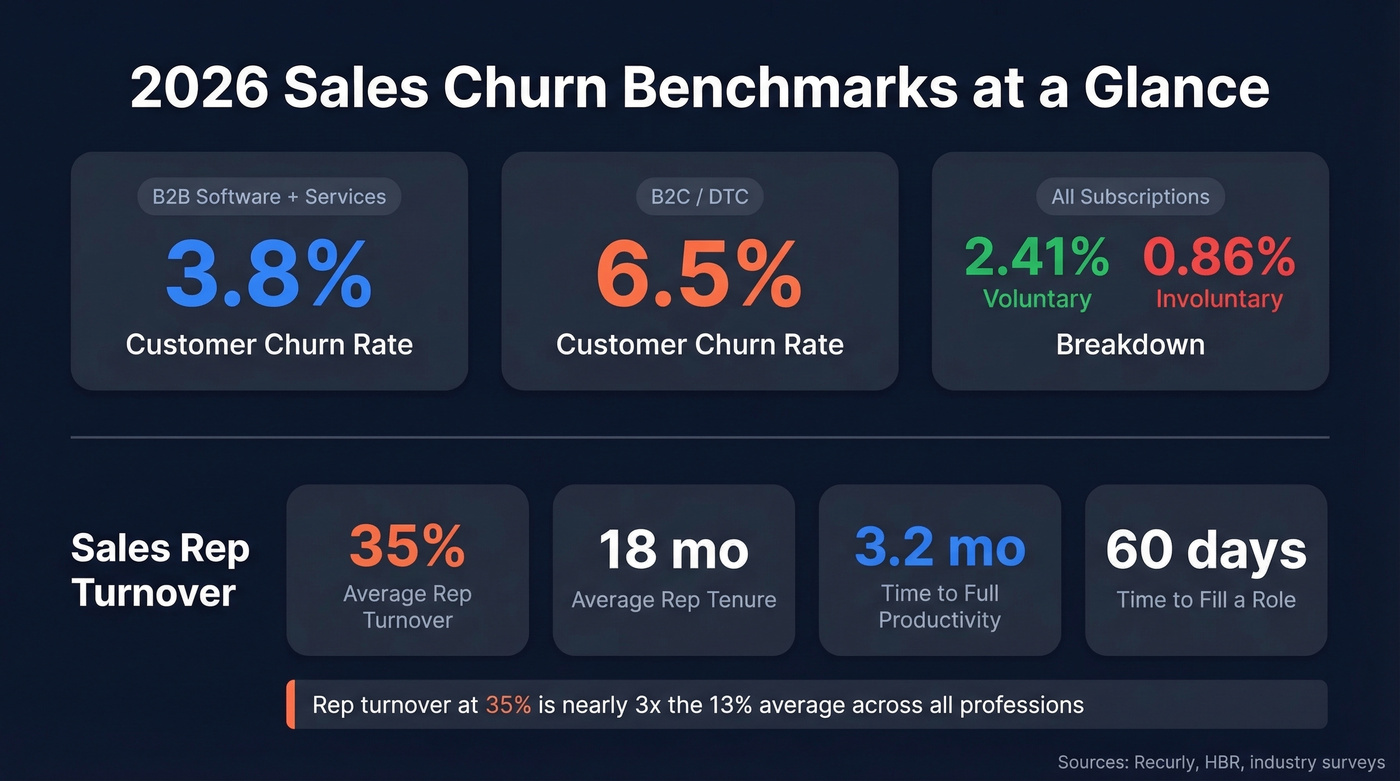
These are Recurly's most recent benchmarks across their subscriber base. The voluntary vs. involuntary split matters - involuntary churn (failed payments, expired cards) is a mechanical problem with mechanical solutions. Voluntary churn is the strategic challenge.
One nuance benchmarks alone won't tell you: a spike in customer losses often follows a period of aggressive acquisition. Those promotion-driven signups or heavily discounted deals were never going to stick. If you ran a big push last quarter, expect the hangover this quarter.
Sales Rep Turnover
| Metric | Benchmark |
|---|---|
| Average rep turnover | ~35% |
| Average rep tenure | 18 months |
| Time to full productivity | 3.2 months |
| Time to fill a B2B sales role | ~60 days |
| Active outside sales reps (US) | 1.03M+ |
That 35% turnover rate is nearly triple the 13% average across all professions. The average outside sales rep has about 19 years of experience and 4.8 years at their current company - so when a tenured rep leaves, you're losing nearly half a decade of account relationships and institutional knowledge. Every departure creates a compounding cost chain that most orgs dramatically underestimate.
What Causes Sales Churn
Churn the Sales Team Creates
This is the category nobody wants to own. A rep closes a bad-fit deal to hit quota. The customer onboards, realizes the product doesn't solve their actual problem, and leaves six months later. The sales team celebrated the close. CS takes the blame for the loss.
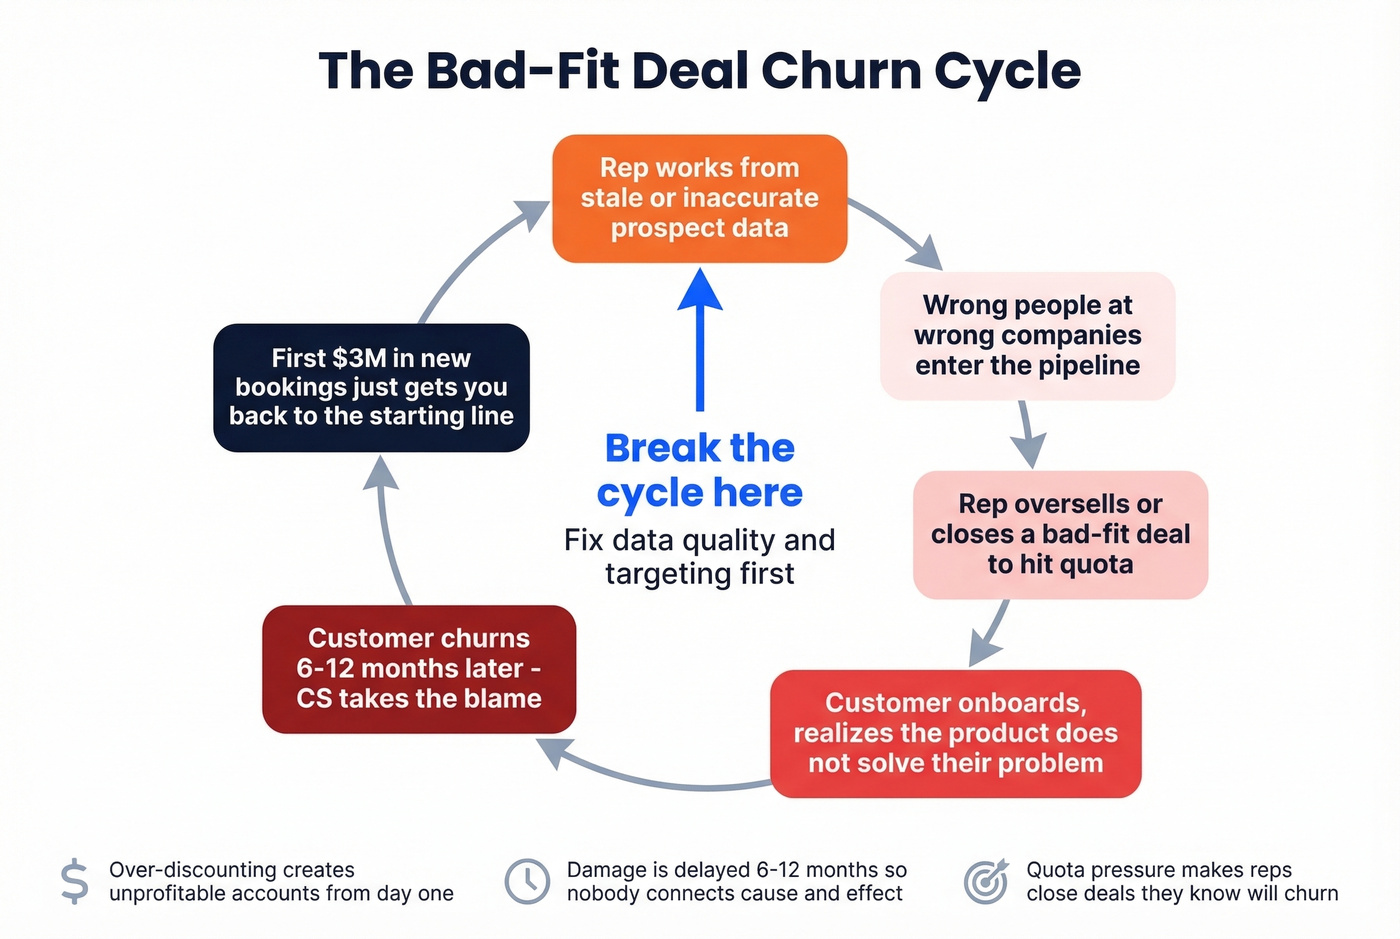
If you lose $3M out of $20M in annual revenue, that's 15% - and your first $3M in new bookings next year just gets you back to the starting line. Overselling, misaligned expectations, and closing prospects who should've been disqualified are the most expensive mistakes a sales org can make, because the damage is delayed and diffuse.
There's a subtler version too: over-discounting. When reps slash pricing or throw in extras to close a deal, they create accounts that are unprofitable from day one. Those accounts get deprioritized by CS, receive less attention, and either leave or get strategically cut. The sale looked great on the board. The unit economics never worked.
Churn from Bad Prospect Data
This one's upstream of everything else. When reps work from stale or inaccurate contact data, they reach the wrong people at the wrong companies. Those conversations produce bad-fit deals that fall apart 6-12 months later. We've seen this pattern repeatedly in our own work - teams that fix data quality at the source cut this problem before it compounds.
If you want a deeper breakdown of the mechanics, start with a proper churn analysis before you change the sales motion.
Rep Turnover Causes
Compensation is the obvious driver, but quota attainability is the silent killer. When reps consistently miss quota - not because they're bad, but because targets are unrealistic - they leave. Culture, ramp support, and territory design all play a role too. A 5% increase in sales rep attrition drives a 4-6% increase in selling costs, and that's before you factor in the pipeline gaps.
"Good Churn"
Not all customer losses are bad.
High-maintenance, low-value customers leaving frees CS bandwidth for accounts that actually grow. Sometimes the right move is to strategically fire clients that sales should never have closed in the first place. If a customer consumes 20% of your support resources and pays 2% of your revenue, their departure is a net positive. The key is making sure "good churn" is intentional, not accidental.
The Hidden Cost of Losing Reps
U.S. firms spend $15B per year training salespeople, per Harvard Business Review, and $800B on incentives. When a rep leaves after 18 months, most of that investment walks out the door.
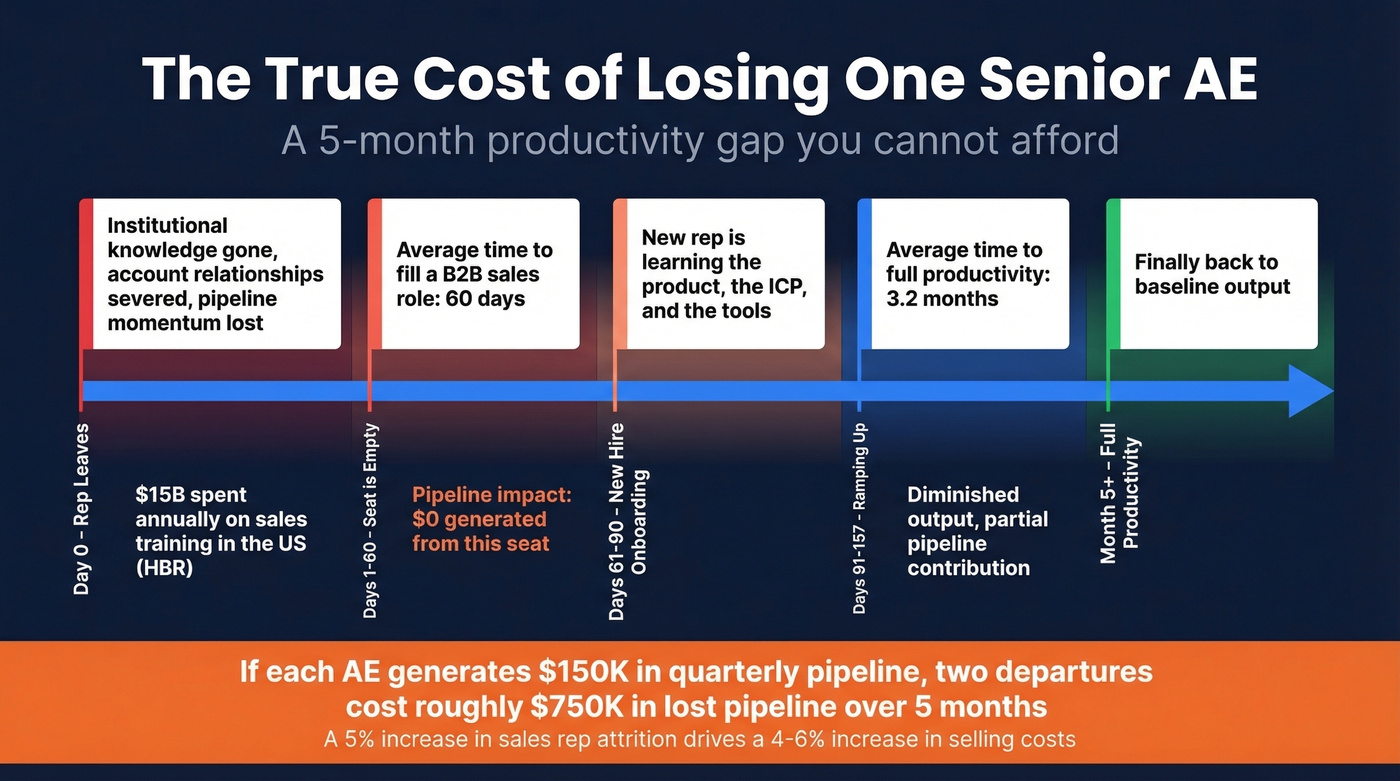
Let's make this concrete. You lost two senior AEs last quarter. It takes 60 days to fill each role and another 3.2 months before the new hires reach full productivity. That's roughly five months of diminished pipeline per seat. If each AE was generating $150K in quarterly pipeline, you're looking at $250K+ in pipeline gaps per departure - before accounting for the deals in progress that went cold during the transition.
And here's what most sales leaders underestimate: the compounding effect. The pipeline gap creates missed targets, which creates pressure on remaining reps, which creates more turnover. It's a flywheel you don't want spinning.
How to Reduce Sales Churn
These five levers are listed in priority order. Start at the top and work down. The goal isn't to eliminate customer losses entirely - it's to systematically address root causes rather than symptoms.
Fix Your ICP and Qualification
Everything starts here. A tighter ICP definition means reps spend time on prospects who actually fit. Layer in MEDDIC or BANT rigor so deals get qualified - or disqualified - early.
If you need a starting point, use an Ideal Customer Profile Template and then pressure-test it in pipeline reviews.
The most underrated retention tactic is expectation-setting during the sales cycle. If a prospect's use case is borderline, say so before they sign. A deal you walk away from is cheaper than a customer who leaves in month four.
Fix Your Prospect Data
Bad data is the silent churn multiplier. When your reps work from outdated lists, they reach people who've changed roles, left companies, or were never the right contact in the first place. Those conversations - when they happen at all - produce misaligned deals.
Prospeo's database covers 300M+ professional profiles with 98% email accuracy and a 7-day data refresh cycle, compared to the six-week industry average. The 30+ search filters - including buyer intent powered by Bombora, technographics, and headcount growth signals - let reps target prospects who actually match your ICP. When Snyk rolled out Prospeo to 50 AEs, their bounce rate dropped from 35-40% to under 5%, and AE-sourced pipeline jumped 180%.
If you're evaluating vendors, compare data enrichment services and make sure you can validate accuracy on your own lists.

Verified data leads to right contacts, which leads to right conversations, which leads to deals that stick. Most churn-reduction playbooks start at the CS handoff. Start at the data layer instead.
Fix the Sales-to-CS Handoff
Every commitment made during the sales cycle needs to transfer to the CS team. Documented expectations, warm introductions, and shared context prevent the "that's not what I was told" conversations that erode trust in the first 90 days. This isn't glamorous work, but it's one of the highest-impact process changes most orgs haven't made.
If you want to standardize the process, use a handoff email template so nothing gets lost between teams.
Fix Retention Mechanics
Quarterly business reviews, usage monitoring, proactive engagement when adoption dips, and NPS tracking at key milestones. None of this is new, but the gap between knowing you should do it and actually doing it consistently is where most revenue leakage lives. Businesses offering retention options like pause, tiered pricing, and loyalty incentives maintain renewal invoice paid rates around 95.6%. Churn management techniques deliver an average 16X return on investment, making retention one of the most capital-efficient growth levers available.
If you're building a retention cadence, start by aligning on renewal rate definitions and reporting.
Fix Involuntary Churn
Involuntary churn - failed payments, expired cards, billing errors - accounts for roughly 0.86% of overall subscription churn. That sounds small until you realize it's entirely preventable. Dunning sequences, automatic payment retries, and card-on-file update prompts reduce this quickly. Skip this if your voluntary churn rate is above 5% - you've got bigger problems to solve first.
Predicting Churn Before It Happens
The leading indicators are well-established: usage drops, support ticket spikes, NPS decline, and login frequency changes. The challenge is building a system that catches these signals early enough to act.
AI churn prediction tools can identify at-risk customers months before renewal, but building a useful model still requires defining your churn event precisely, setting time windows, and evaluating with AUC rather than accuracy - because when only ~5% of customers churn in a given window, a model that predicts "no churn" for everyone still scores 95% accuracy. You also need rigorous separation between training and test periods to avoid data leakage. Modern tools are compressing deployment timelines from 6-9+ months to weeks, but garbage in still means garbage out.
For most teams without a dedicated data science function, the practical move is simpler: build a health score from usage data, payment history, and support interactions. Flag accounts that cross a threshold. Route them to CS for proactive outreach. You don't need machine learning to catch the obvious warning signs - even a basic scoring model helps you spot at-risk accounts before they show up in your quarterly numbers.
If you want to operationalize this, borrow a few ideas from pipeline health reporting and apply the same discipline to post-sale accounts.
When reps leave, pipeline dies and accounts churn. Prospeo's CRM enrichment returns 50+ data points per contact at a 92% match rate - so new reps ramp on verified, current data instead of stale records. With a 7-day refresh cycle, your book of business never goes cold even when the rep who built it does.
Replace tribal knowledge with data that stays when reps don't.
FAQ
What's a good churn rate for B2B SaaS?
B2B software and services average 3.8% monthly overall churn, per Recurly's benchmarks. Net revenue retention above 100% - meaning negative net churn - is the gold standard, indicating expansion revenue outpaces cancellations and downgrades. If you're above 5% monthly gross churn, treat it as urgent and audit your ICP fit first.
Is churn a sales problem or a CS problem?
Most preventable churn starts at the point of sale, not the renewal conversation. Bad-fit deals, overselling, and poor prospect data create losses 6-12 months before CS ever sees warning signs. CS manages retention; sales determines who's worth retaining. The fix requires both teams aligned on ICP and handoff quality.
How do you reduce churn caused by bad prospect data?
Verify contact data before it enters your pipeline. A 98% email accuracy rate and weekly data refresh cycle ensure reps reach the right people at the right companies, so deals match your ICP from the start. When Snyk adopted this approach with Prospeo, bounce rates dropped from 35-40% to under 5% and AE-sourced pipeline rose 180%.
What's the difference between voluntary and involuntary churn?
Voluntary churn happens when customers actively cancel - usually due to poor fit, unmet expectations, or competitive switching. Involuntary churn results from failed payments, expired cards, or billing errors and accounts for roughly 0.86% of subscription losses. Involuntary churn is entirely fixable with dunning sequences and automatic payment retries.