Sales Data Insights That Actually Change Decisions in 2026
Your team built the dashboards. Pipeline by stage, rep activity, win rates by quarter - all the charts leadership asked for. Six months later, nobody opens them. Reps still spend 60% of their time on non-selling tasks, and your forecast is off by double digits. The problem isn't a lack of sales data insights. It's that the data never changed anyone's behavior.
What You Need (Quick Version)
- Track 3-5 outcome metrics - pipeline velocity, win rate, forecast accuracy - not 15 activity metrics nobody acts on.
- Fix your data quality before investing in dashboards or AI. Garbage in, garbage out isn't a cliche; it's a multimillion-dollar problem.
- Use the Sense-Explain-Decide-Act loop to turn raw data into decisions, not just prettier charts.
Why Most Analytics Projects Fail
80-87% of Big Data projects fail to produce sustainable business results. That's not a rounding error. It's the norm, and the root cause is almost always bad data, not bad dashboards.
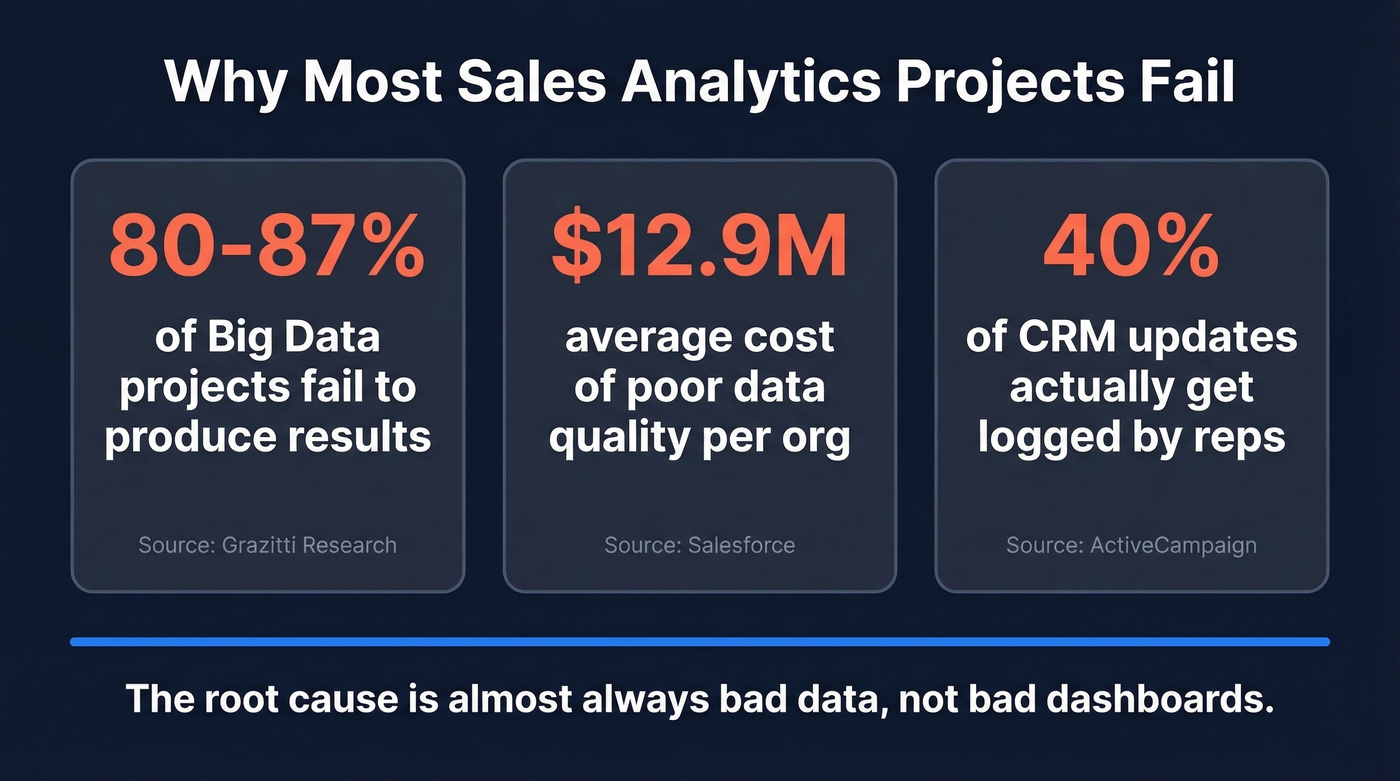
Poor data quality costs organizations $12.9M on average. Only about 40% of CRM updates actually get logged by reps, which means a huge share of sales activity never makes it into the system. When small errors compound - a wrong title here, a stale email there - they create data cascades where minor inaccuracies amplify downstream into unreliable reporting, broken forecasts, and bad decisions.
Only 43% of data and analytics leaders have formal governance frameworks. The rest are building analytics on a foundation they've never audited, and 64% of organizations identify data quality as their top integrity challenge. In practice, sales analytics work tends to follow the same arc: early wins with scorecards and pipeline dashboards, then a plateau where the work devolves into ad-hoc requests and nobody acts on the findings. Without clean inputs, even the most promising initiative stalls before it delivers ROI.
Metrics That Drive Actionable Insights
Most sales teams track too many things and act on too few. We've seen it firsthand - teams tracking more than five outcome metrics end up acting on none of them.
Here's what actually moves revenue:
| Metric | What It Tells You | Benchmark |
|---|---|---|
| Pipeline velocity | Revenue speed through funnel | Use your own baseline, then improve by segment and source |
| Win rate by segment | Where you actually close | Typical B2B ranges sit around 20-30%; segment to find outliers |
| Forecast accuracy | Can leadership trust the number? | 79% of orgs miss by >10% |
| MQL-to-SQL conversion | Marketing-to-sales handoff quality | 15-25% baseline |
| CAC payback period | Time to customer profitability | Under 12 months is a common SaaS target |
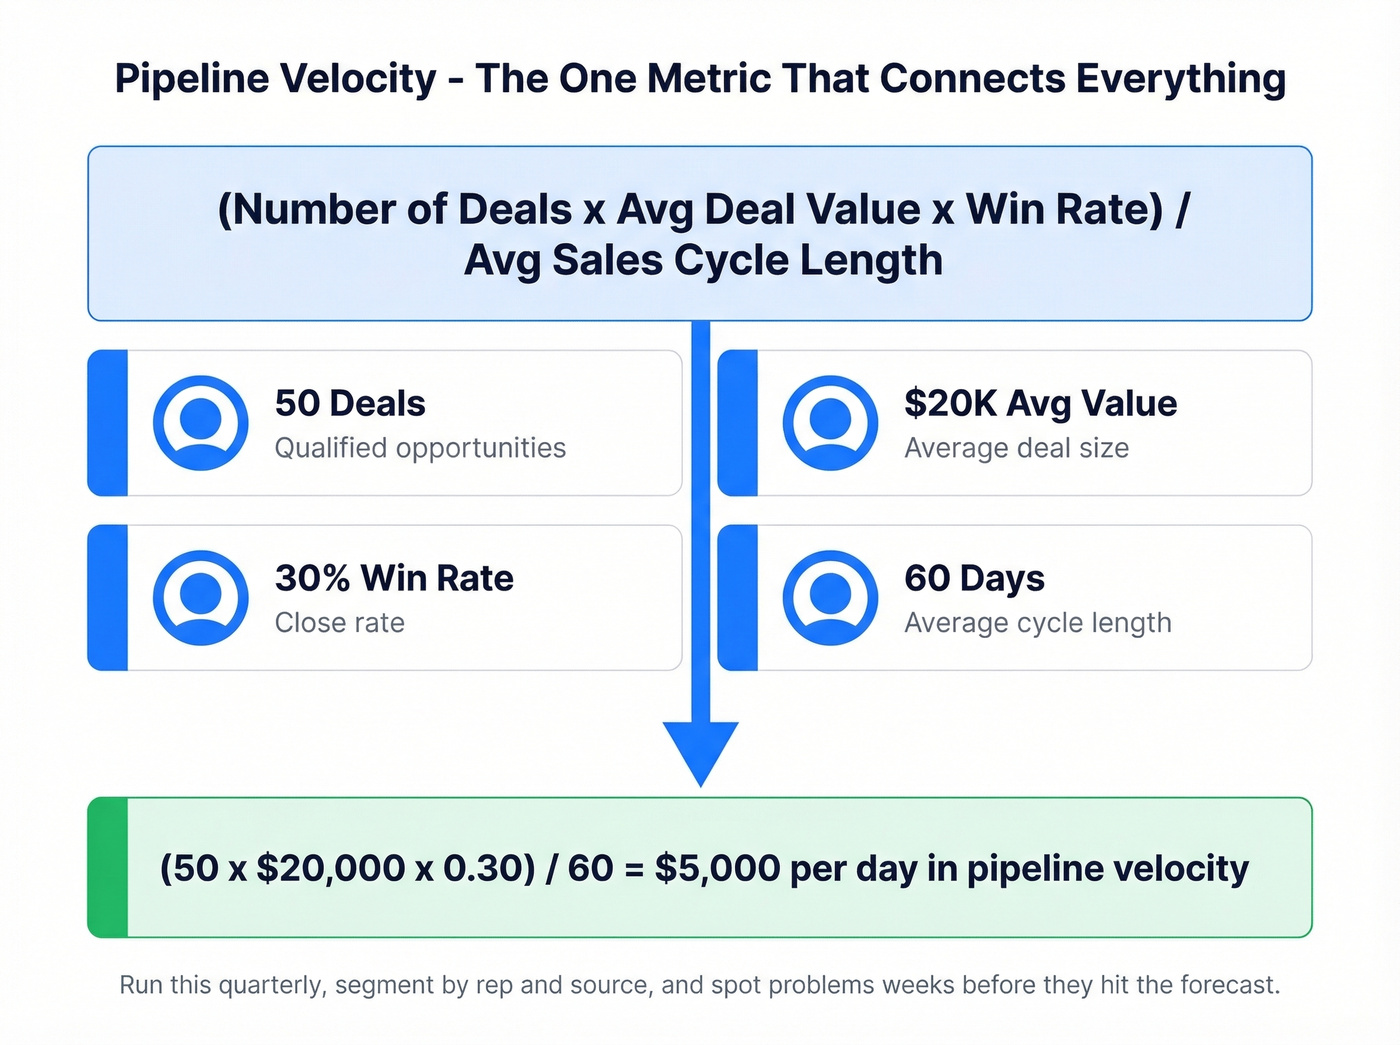
Pipeline velocity deserves special attention because it connects deal count, deal size, win rate, and cycle length into a single number: (number of deals x average deal value x win rate) / average sales cycle length. A worked example: 50 deals at $20K average, a 30% win rate, and a 60-day cycle gives you (50 x $20K x 0.30) / 60 = $5,000/day. Run it quarterly, segment by rep and source, and you'll spot problems weeks before they hit the forecast.
Here's the thing: most teams don't need predictive AI or territory analytics platforms. They need clean data and the discipline to ask "so what?" after every report. If your CRM data is 40% incomplete, no model - no matter how sophisticated - will save your forecast.
You just read that 40% of CRM data never gets logged and 80% of analytics projects fail. The fix starts upstream: clean, verified contact data. Prospeo enriches your CRM with 50+ data points per contact at a 92% match rate - refreshed every 7 days, not every 6 weeks.
Stop building forecasts on stale data. Start with 75 free verified emails.
Turning Insights Into Action
The gap between "we have a dashboard" and "we changed how we sell" is where most analytics investments die. Bridge it with the DecisionOps loop: Sense - Explain - Decide - Act.
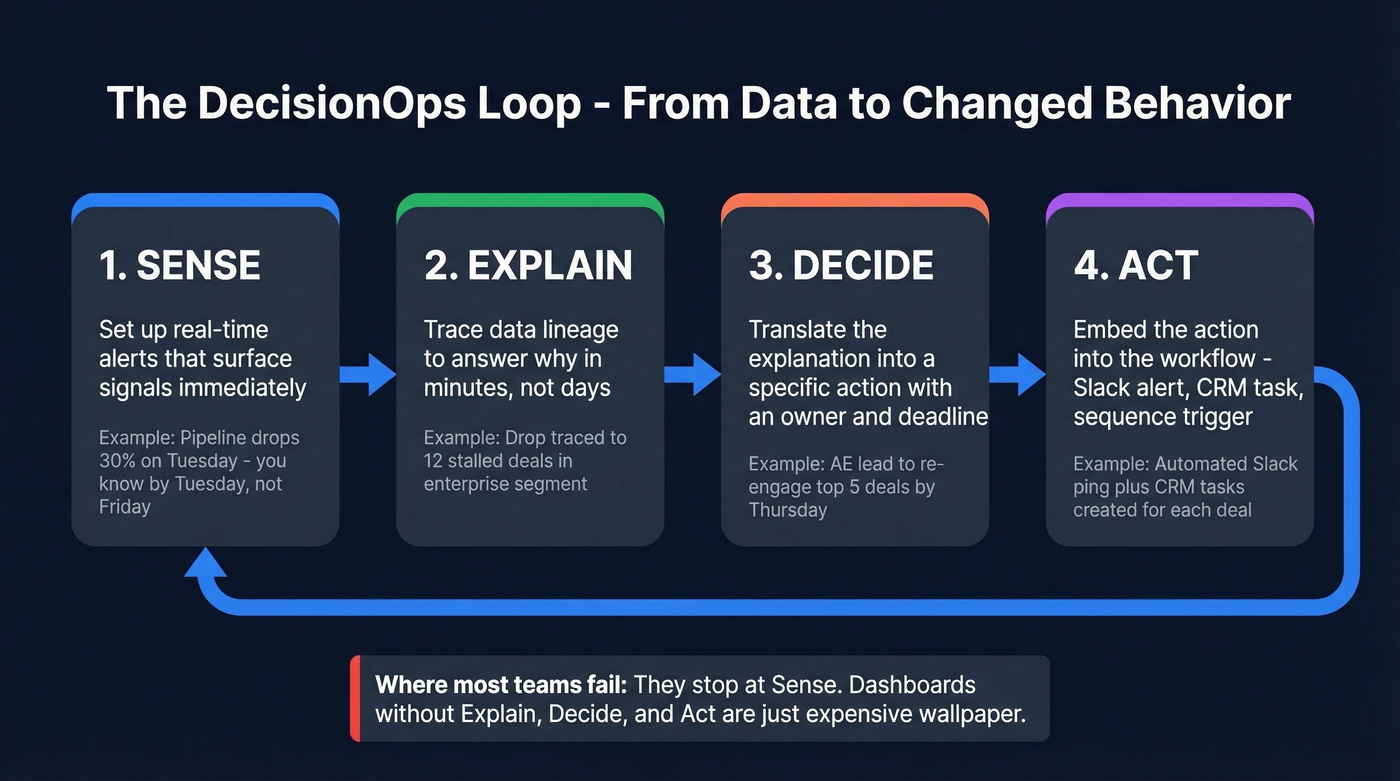
Sense means setting up alerts that surface real-time signals - not waiting for a weekly review to notice pipeline dropped 30% on Tuesday. Explain means having the data lineage to answer "why" in minutes, not days. Decide means translating the explanation into a specific action with an owner and a deadline. Act means embedding that action into the workflow through a Slack alert, a CRM task, or a sequence trigger, not a slide buried in the next QBR deck.
Don't overlook unstructured data. Call recordings, email threads, and chat logs contain signals that dashboards miss entirely - 90% of enterprise customer data sits in formats most analytics stacks can't tap. Conversation intelligence tools are catching up, but the foundation still matters: 84% of data and analytics leaders agree that AI outputs are only as good as data inputs. The teams generating real business intelligence are the ones combining structured CRM data with these unstructured signals, and they're doing it because they fixed the structured layer first.
Fix the Foundation First
Before you invest another dollar in dashboards or revenue intelligence, fix your contact and account data. Everything downstream depends on it.
- Stand up a governance team. Cross-functional - sales, marketing, ops. Define who owns data quality and give them authority to enforce standards.
- Standardize data entry. Validation rules, dropdowns, required fields. Stop letting reps type "VP Sales" six different ways.
- Run monthly profiling and cleansing. Deduplication, format normalization, decay detection.
- Train your reps. Show them how bad data kills their own pipeline. They won't maintain what they don't value.
- Monitor continuously. Quality metrics, audits, feedback loops. Data quality is a practice, not a project.
Contact data decay is the upstream problem nobody addresses. 69% of cold email senders report year-over-year performance declines, and a huge chunk of that comes from deliverability damage caused by stale emails. Your analytics stack is built on contact data. If that data is stale, everything downstream - forecasts, segmentation, AI models - is wrong.

Prospeo tackles this at the foundational layer. All records refresh every 7 days with 98% email accuracy and a 92% API match rate for CRM enrichment. If you're running enrichment workflows through Salesforce or HubSpot, native integrations push 50+ data points per contact directly into your CRM - which means the metrics you're tracking are actually built on current, verified information.
If you're comparing vendors, start with a shortlist of data enrichment services and validate refresh cadence and match rates.
Every metric in this article - pipeline velocity, win rate, forecast accuracy - breaks down when built on decayed contact data. Prospeo's 5-step verification delivers 98% email accuracy at $0.01 per lead, with native Salesforce and HubSpot integrations that keep your data current automatically.
Accurate insights require accurate data. Fix the foundation for free today.
Tools by Maturity Stage
Not every team needs a $250/user/month revenue intelligence platform. Match your tooling to where you actually are.
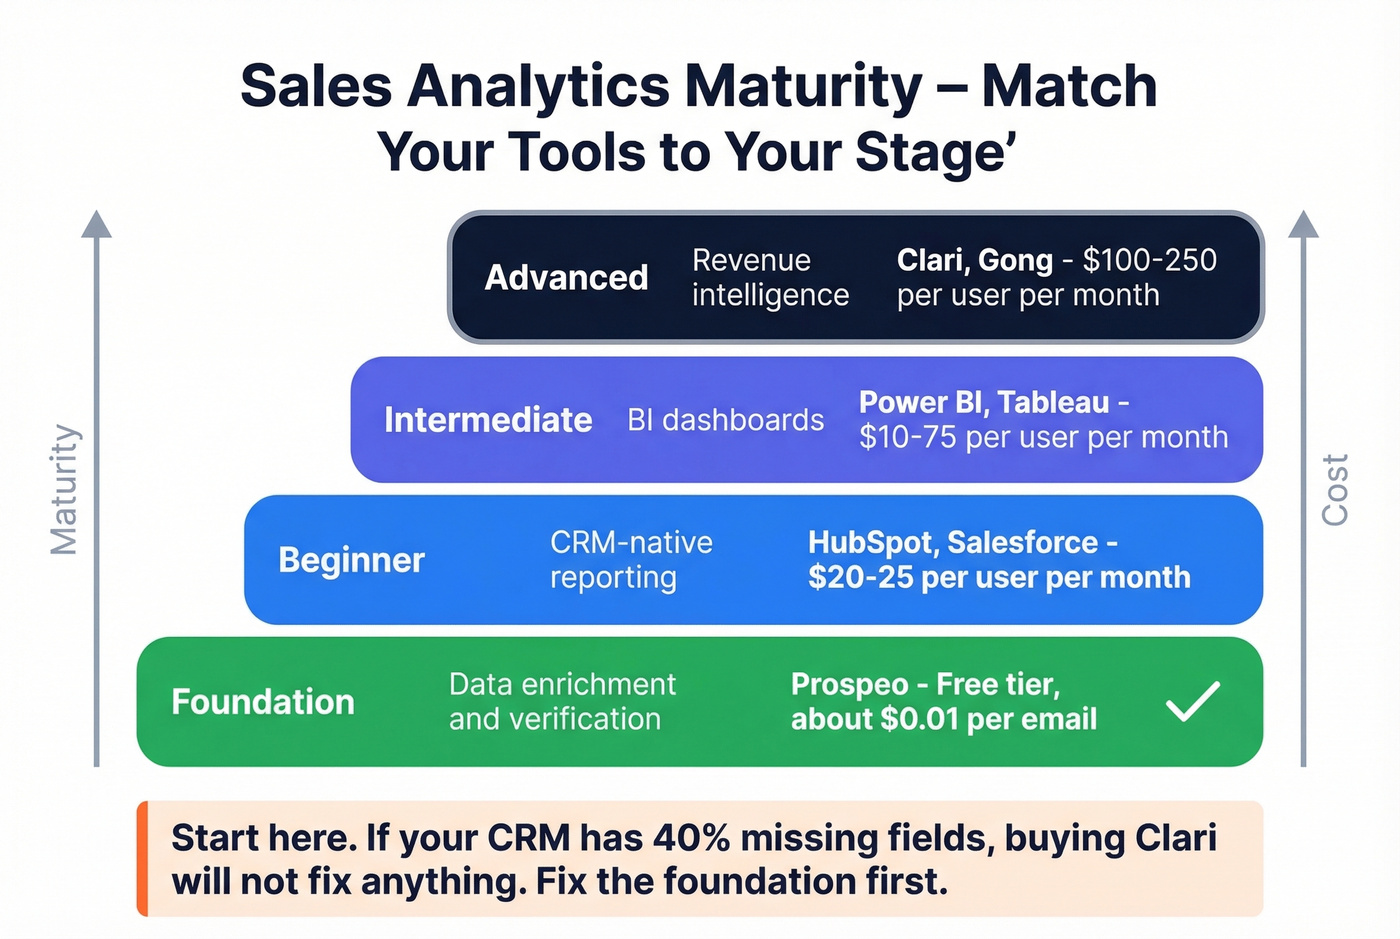
| Stage | Tool Category | Examples | Starting Price |
|---|---|---|---|
| Foundation | Data enrichment & verification | Prospeo | Free tier; ~$0.01/email |
| Beginner | CRM-native reporting | HubSpot, Salesforce | ~$20-25/user/mo |
| Intermediate | BI dashboards | Power BI, Tableau | ~$10-75/user/mo |
| Advanced | Revenue intelligence | Clari, Gong | ~$100-250/user/mo |
We've watched teams spend tens of thousands per year on Gong licenses before their CRM data was clean enough to make the conversation insights useful. Skip the advanced tier until your foundation is solid. Your CRM's native reporting handles the first year; add a BI layer when you outgrow it. The goal at every stage is the same: data-driven sales insights that change rep behavior, not just executive slide decks.
Let's be honest - if you're a team of five reps and your CRM has 40% missing fields, buying Clari won't fix anything. Start with enrichment and governance, prove the value of clean data, and scale from there. If forecasting is the pain point, evaluate sales forecasting solutions only after your inputs are reliable.
FAQ
What's the difference between sales data and sales insights?
Sales data is raw numbers - calls made, deals closed, revenue booked. Insights are the patterns you extract that change how you sell. Data tells you what happened; actionable insights tell you what to do next. The real value comes when you translate raw numbers into strategy shifts fast enough to act mid-quarter, not just during annual planning.
How often should sales data be refreshed?
Contact and account data should be refreshed at minimum every 30 days - ideally weekly. Stale data is the top reason forecasts and outreach campaigns underperform. Most enrichment providers refresh on a 4-6 week cycle, which means your analytics are already outdated by the time you review them.
Which sales metrics matter most?
Pipeline velocity, win rate by segment, and forecast accuracy. These three connect directly to revenue decisions. Activity metrics like calls made and emails sent are inputs, not outcomes. Track them lightly, not obsessively, and use the core metrics to guide coaching, territory planning, and resource allocation.
Can small teams benefit from sales analytics?
A 3-person team with clean CRM data and three core metrics will outperform a 30-person team drowning in dashboards nobody opens. Start with free CRM reporting, layer in a data enrichment tool, and add BI tooling only when you've outgrown native reports. You don't need a data team to get this right - you need discipline and clean inputs.