Sales Funnel Conversion Rate: 2026 Benchmarks, Formulas, and How to Fix a Leaky Funnel
Your sales funnel conversion rate is a symptom, not a diagnosis. Most guides hand you a "3-10%" benchmark and call it a day - a range so wide it's like saying a house costs "between $50,000 and $5 million." That number only means something when you segment by industry, channel, company size, and funnel stage. This piece gives you those segments, the formulas behind them, and a framework for figuring out where your funnel actually breaks.
What Is Funnel Conversion and Why Does It Matter?
A funnel conversion rate measures the percentage of prospects who move from one stage to the next, or from top to bottom:
(Conversions / Entries into that stage) x 100 = Conversion Rate
If 500 leads enter your funnel and 15 become customers, your overall rate is 3%. But that single number hides everything interesting. Where did the other 485 go? Did they stall at MQL? Ghost your reps at the proposal stage? The stage-by-stage breakdown is where the real insight lives.
The Short Version
Most B2B funnels land around 3-7% end-to-end, depending on channel, ACV, and sales cycle. Ecommerce purchase rates typically sit around 1.9-3%, and the real story is always in the stage-by-stage drop-offs.
The median landing page conversion rate is 6.6% across industries, but that's visitor-to-lead, not visitor-to-customer. Your number means nothing without segmentation - a 2% rate from SEO traffic and a 2% rate from paid ads are completely different animals. And if your MQL-to-SQL rate is below 30%, check your data quality before you redesign anything. Reps can't convert contacts they can't reach.
Funnel Stages and What Converts
The FirstPageSage framework provides a clean standard most B2B teams can map to. Benchmark ranges below draw from VWO and commonly cited B2B benchmark data.
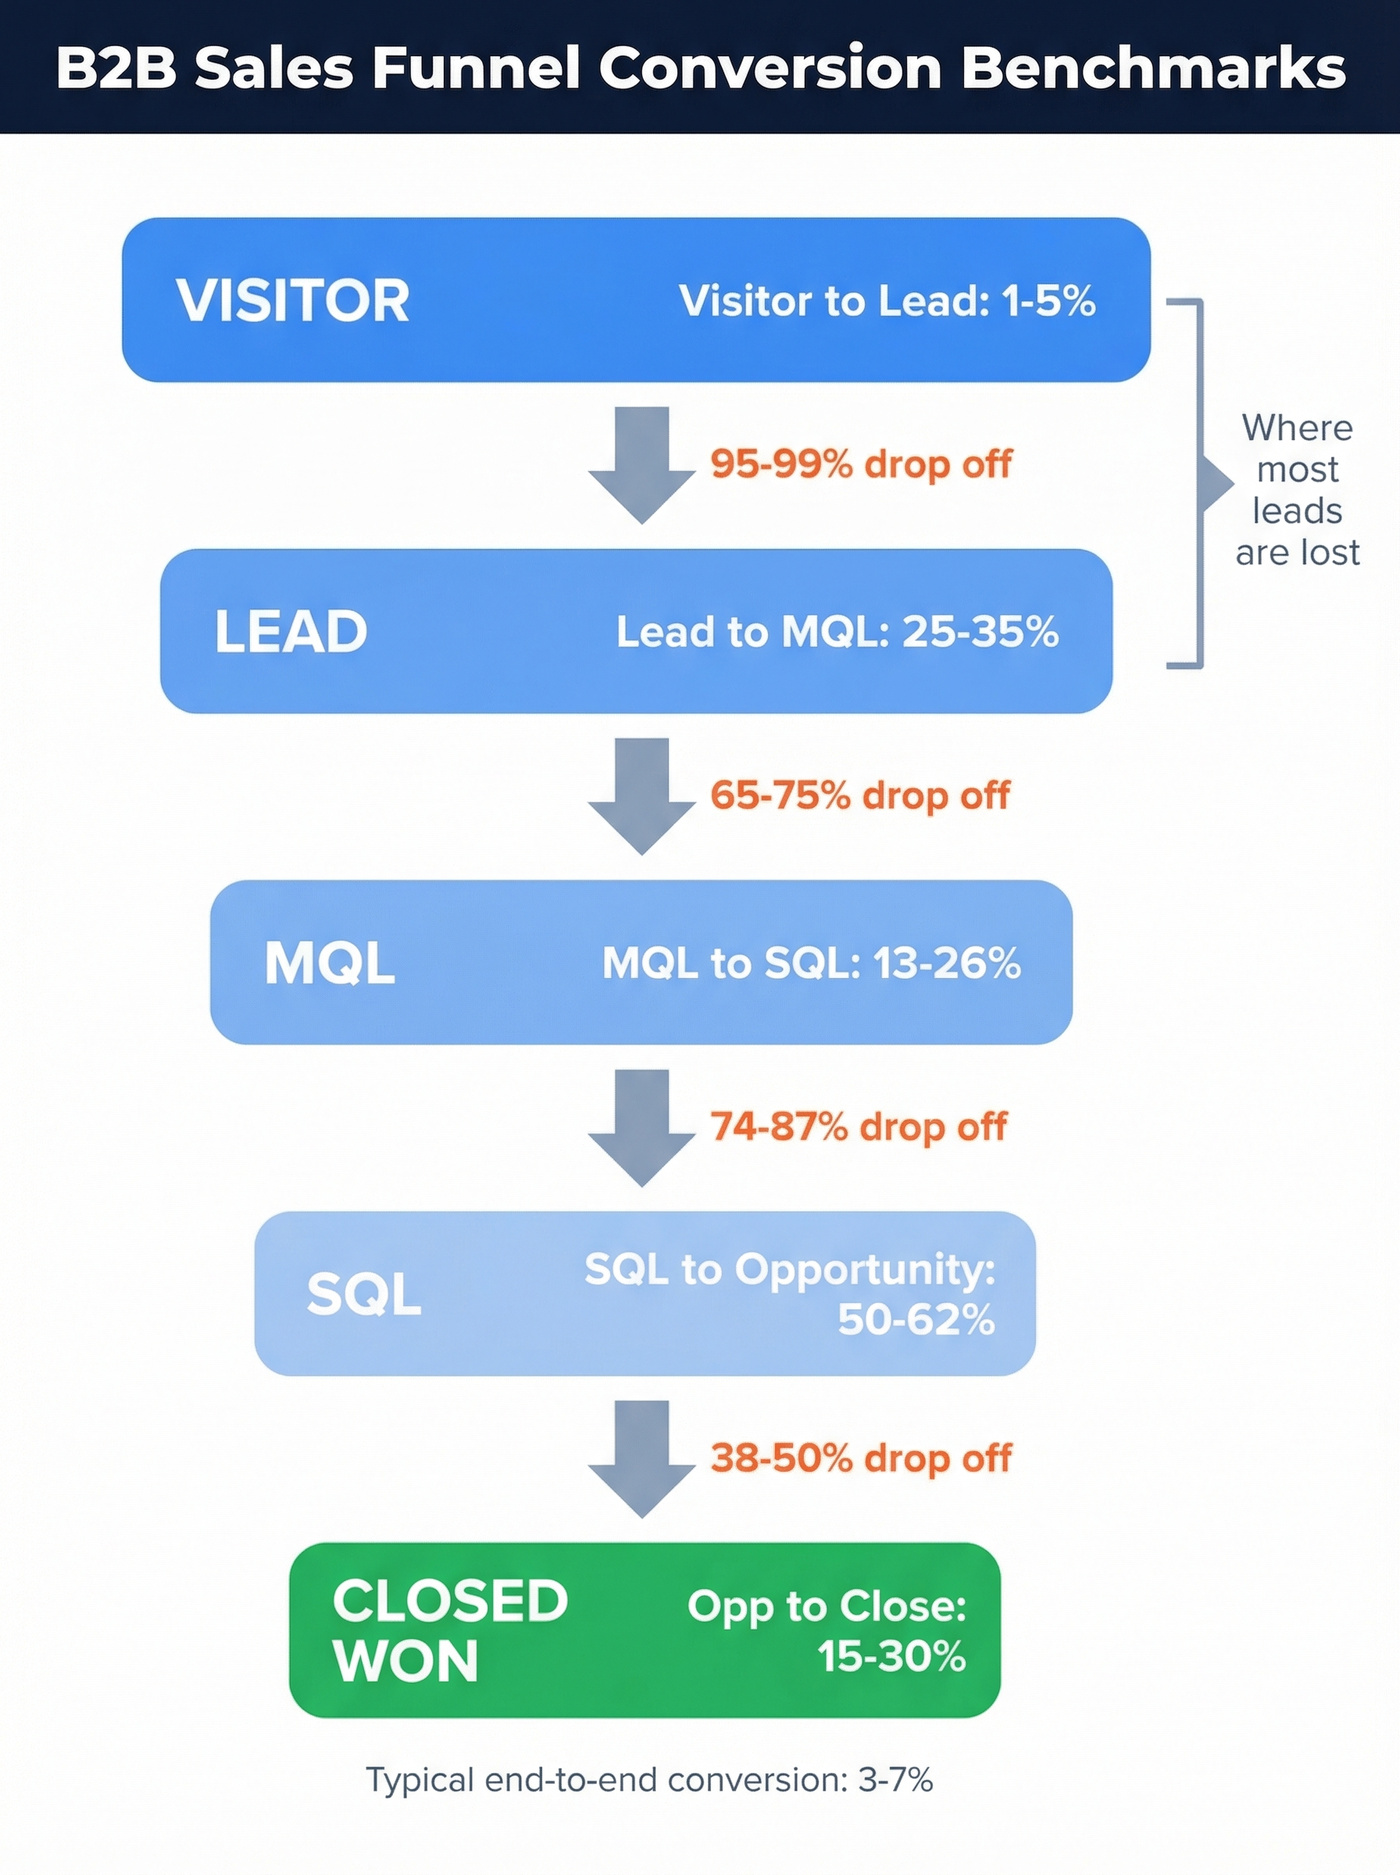
| Stage | What Triggers It | Typical Conversion Range |
|---|---|---|
| Lead | Form fill, demo request, trial | Visitor-to-Lead: 1-5% |
| MQL | Meets marketing criteria | Lead-to-MQL: 25-35% |
| SQL | Sales-accepted, qualified | MQL-to-SQL: 13-26% |
| Opportunity | Active deal in pipeline | SQL-to-Opp: 50-62% |
| Closed Won | Signed contract / purchase | Opp-to-Close: 15-30% |
Early stages have the steepest drop-offs. Later stages - where prospects have self-selected - convert at much higher rates, and that's normal. If your SQL-to-Opportunity rate is below 50%, it usually points to a qualification or handoff problem, not a marketing problem. Tracking these funnel metrics at each stage is what separates teams that guess from teams that diagnose.
Benchmarks by Industry
Here's what the data shows when you segment by vertical, drawn from FirstPageSage's dataset spanning 2017-2026 and covering roughly 65% B2B, 20% B2C, and 15% hybrid companies.
| Industry | Lead-to-MQL | MQL-to-SQL | SQL-to-Opp | SQL-to-Closed |
|---|---|---|---|---|
| B2B SaaS | 39% | 38% | 42% | 37% |
| eCommerce | 23% | 58% | 66% | 60% |
| Financial Services | 29% | 38% | 49% | 53% |
| Healthcare | 24% | 38% | 51% | 51% |
| Cybersecurity | 24% | 40% | 43% | 46% |
eCommerce has the lowest Lead-to-MQL rate at 23% but the highest SQL-to-Closed at 60%. That's because ecommerce "leads" are often just site visitors who filled out a form - a low bar. By the time someone reaches SQL in ecommerce, they're practically holding their wallet.
B2B SaaS sits in the middle across every stage. If you're in SaaS and your MQL-to-SQL rate is significantly below 38%, your lead scoring model or your contact data needs work - not your sales pitch.
Financial services and healthcare both close above 50% once a deal reaches SQL. These are high-trust, high-consideration industries where the qualification process does the heavy lifting. The sales cycle is long, but the deals that survive it tend to close.
Benchmarks by Channel
Where your leads come from changes everything. This Digital Bloom analysis breaks it down clearly.
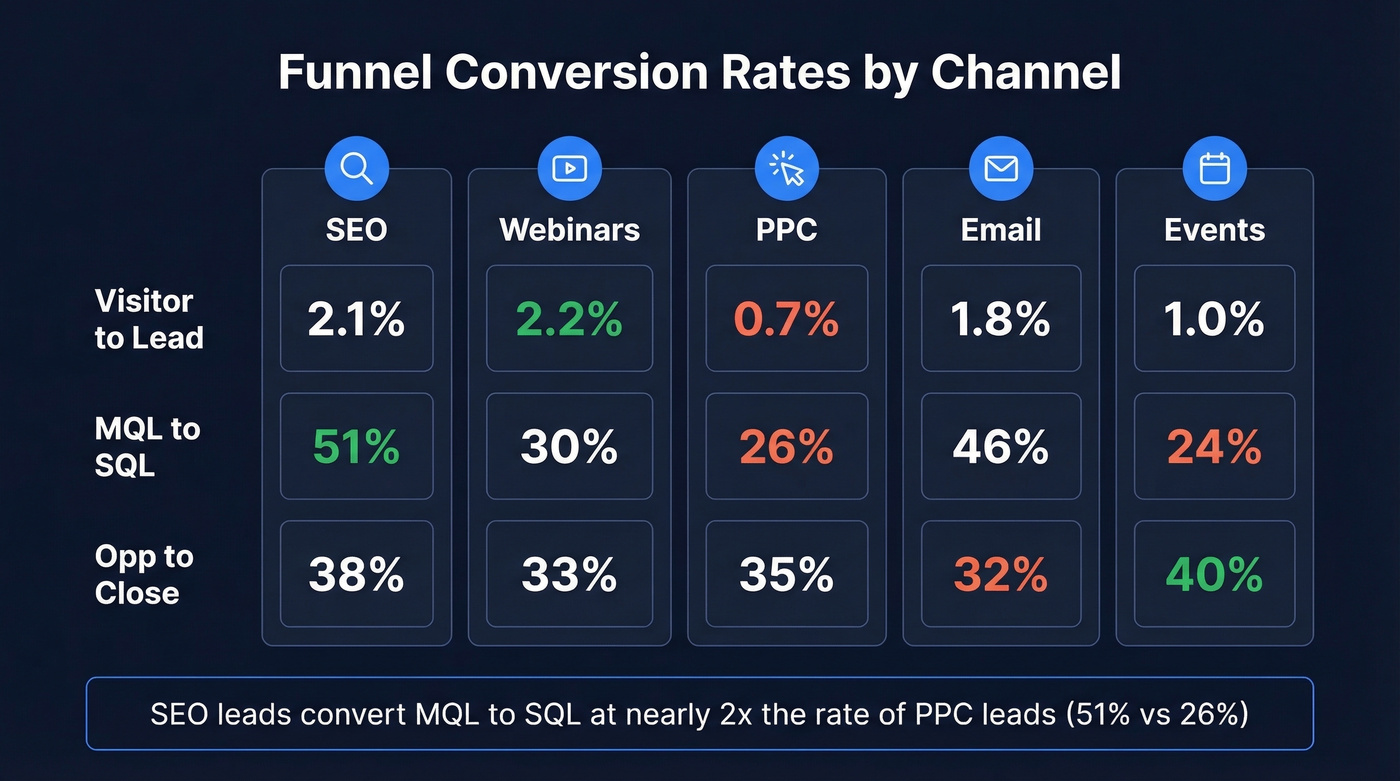
| Channel | Visitor-to-Lead | MQL-to-SQL | Opp-to-Close |
|---|---|---|---|
| SEO | 2.1% | 51% | 38% |
| Webinars | 2.2% | 30% | 33% |
| PPC | 0.7% | 26% | 35% |
| 1.8% | 46% | 32% | |
| Events | 1.0% | 24% | 40% |
SEO leads convert at nearly 2x the MQL-to-SQL rate of PPC leads (51% vs 26%). Organic search visitors have higher intent - they're actively researching a problem. PPC visitors clicked an ad, which is a much weaker signal.
Events tell an interesting story. They have the lowest MQL-to-SQL rate at 24% but the highest close rate at 40%. Events generate a lot of badge scans that never become real conversations, but the ones that do tend to close. If you're measuring event ROI on MQL volume alone, you're missing the point entirely.
Outbound deserves its own callout. Belkins' pipeline data shows outbound sequences average 62 touches across 3+ channels before converting, with an appointment-to-discovery rate of 48.19%. A single follow-up boosts response rates by 49%. Outbound funnels have fundamentally different stage definitions than inbound - comparing them on the same scale is an apples-to-oranges mistake.
If your MQL-to-SQL rate is below 30%, the problem isn't your pitch - it's your data. Reps waste hours chasing bounced emails and dead numbers. Prospeo's 98% email accuracy and 125M+ verified mobiles mean your pipeline converts at every stage, not just the top.
Stop losing deals to bad contact data. Start reaching real buyers.
SMB vs Enterprise
Company size changes your funnel math dramatically.
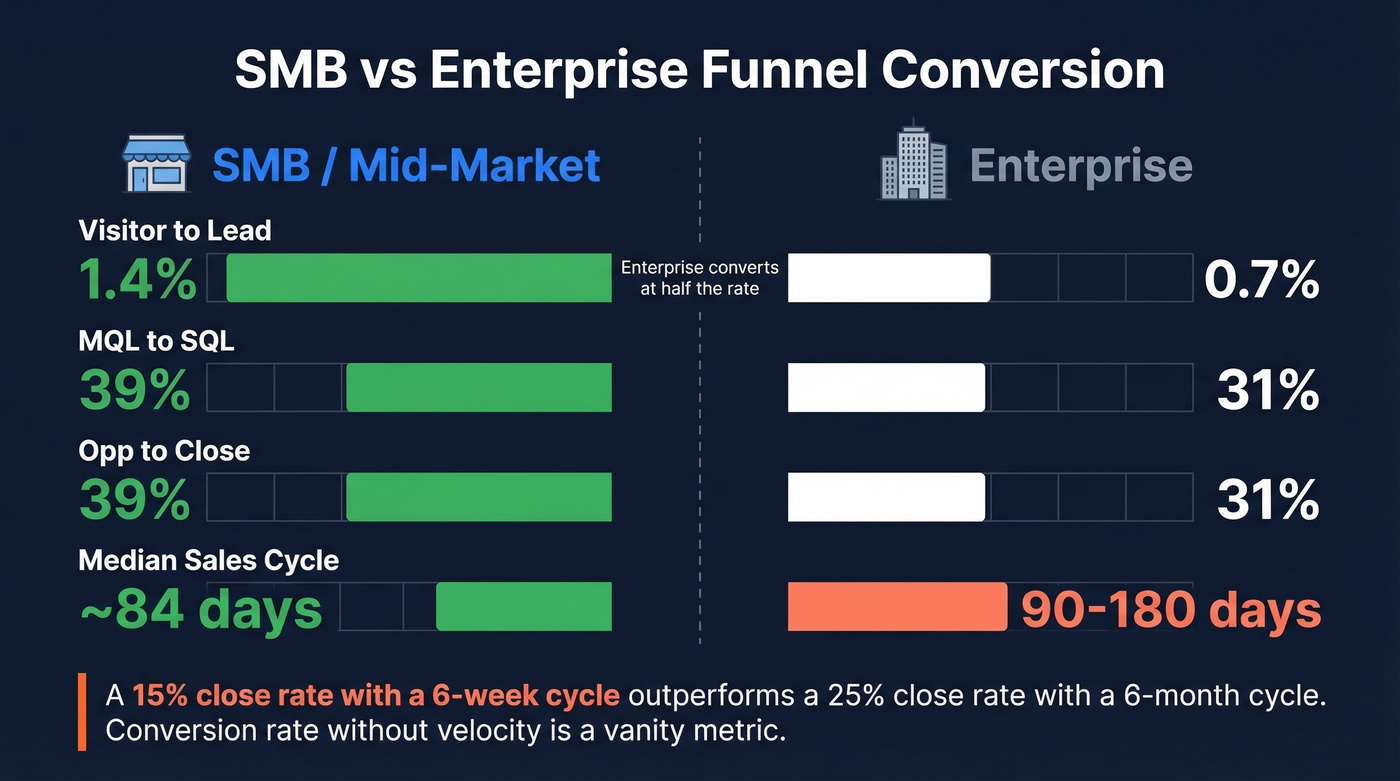
| Metric | SMB / Mid-Market | Enterprise |
|---|---|---|
| Visitor-to-Lead | 1.4% | 0.7% |
| MQL-to-SQL | 39% | 31% |
| Opp-to-Close | 39% | 31% |
| Median sales cycle | ~84 days | ~90-180 days |
Enterprise funnels convert at roughly half the rate of SMB funnels at the top, and the gap persists through close. That's not a problem to fix - it's the nature of selling to organizations with procurement committees, legal reviews, and multi-stakeholder buying groups.
Digital Bloom puts the median sales cycle at 84 days, with an optimal range of 46-75 days. If your deals consistently exceed 84 days, the issue is usually in the SQL-to-Opportunity handoff or in deal velocity, not in lead generation.
Here's the thing: if your average deal size is under $15k, you probably don't need an enterprise-length sales cycle. A 15% close rate with a 6-week cycle will outperform a 25% close rate with a 6-month cycle every time. Conversion rate without velocity context is a vanity metric.
Ecommerce Funnel Benchmarks
Ecommerce funnels operate on a compressed timeline with different stage definitions entirely.
| Stage | Benchmark |
|---|---|
| Browse to Add-to-Cart | 6.5-7.5% |
| Cart to Checkout | ~30% (70% abandon) |
| Overall CVR (global) | ~1.9-2.0% |
| Overall CVR (Shopify) | 2.5-3.0% |
The device split is brutal: desktop converts at 3.9% while mobile converts at 1.8% - despite mobile driving about 73% of traffic. If you're not optimizing your mobile checkout experience, you're ignoring where most of your traffic actually shops.
Cart abandonment averages 70.22%, and the #1 reason is unexpected costs at checkout. Shipping calculators and transparent pricing earlier in the flow are the lowest-hanging fruit in ecommerce CRO. Category matters too: Fashion converts at 1.6-1.9%, Beauty can hit 6.8%, and Electronics lands around 3-3.6%.
For context on what "good" looks like, Triple Whale's data shows the top 20% of ecommerce stores convert at 3.2%+, and the top 10% hit 4.7%+. Below 2% puts you in the bottom half.
Real-World Funnel Walkthrough
Let's diagnose an actual funnel. A B2C SaaS founder shared their numbers on r/SaaS:
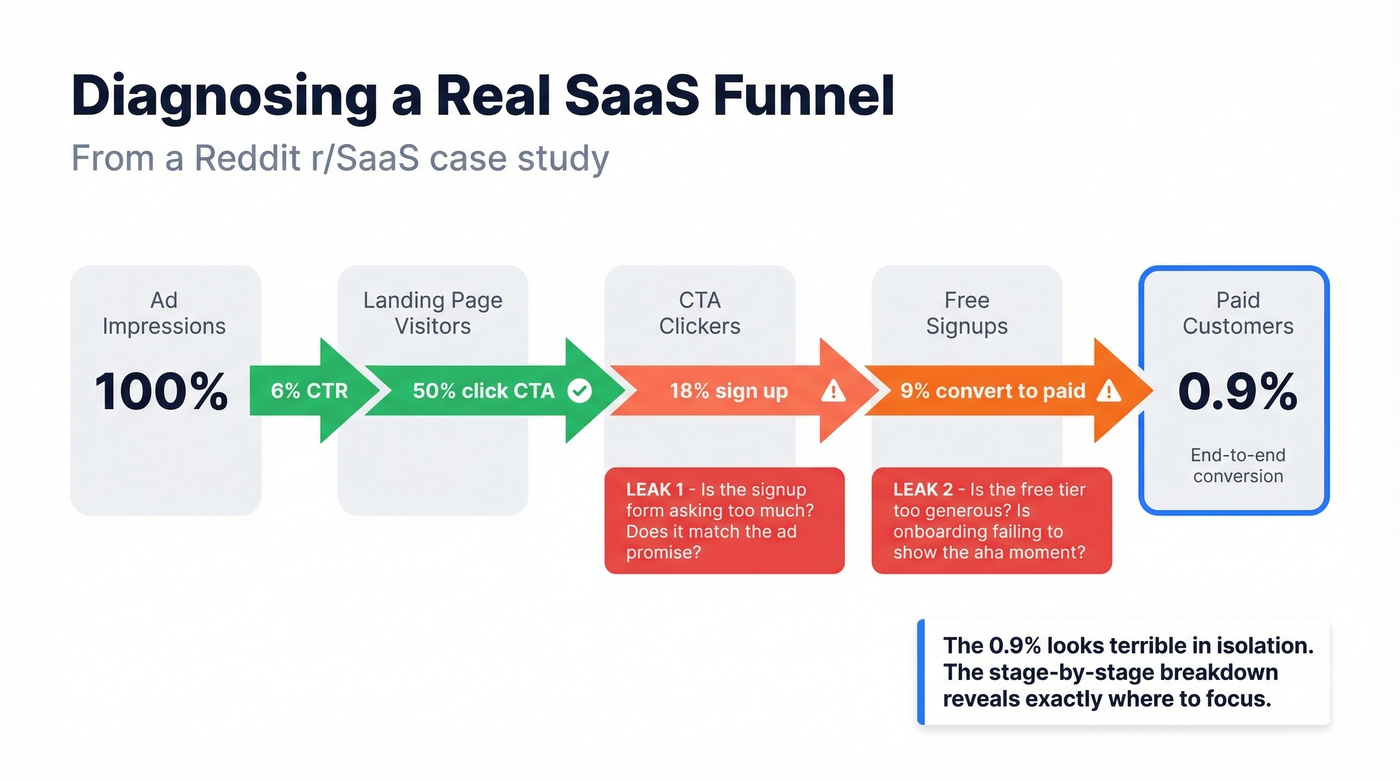
- Google PPC CTR: 6%
- Landing page CTA click: 50%
- Free signup: 18%
- Paid subscription: 9% of signups
- End-to-end (ad click to customer): 0.9%
That 0.9% looks terrible in isolation. Break it apart and the picture changes. The 6% CTR is solid for PPC. The 50% CTA engagement is strong - the landing page is doing its job. The real leaks are between CTA click and signup (50% down to 18%) and between signup and paid (18% down to 9%).
The diagnostic questions write themselves. At the CTA-to-signup drop: Is the signup form asking for too much? Is there a mismatch between what the ad promised and what the signup flow delivers? At signup-to-paid: Is the free tier giving away too much value? Is onboarding failing to demonstrate the "aha" moment?
This is how you use funnel conversion data - not as report card grades, but as diagnostic signals pointing you to the specific stage that needs work.
5 Mistakes That Skew Your Numbers
1. Funnel vision. Optimizing one stage without considering upstream effects is a classic trap. You can double your MQL-to-SQL rate by loosening qualification criteria, but you'll just push garbage into your pipeline. As Geckoboard's analysis puts it: great conversion rates with bad leads is worse than mediocre rates with qualified ones.
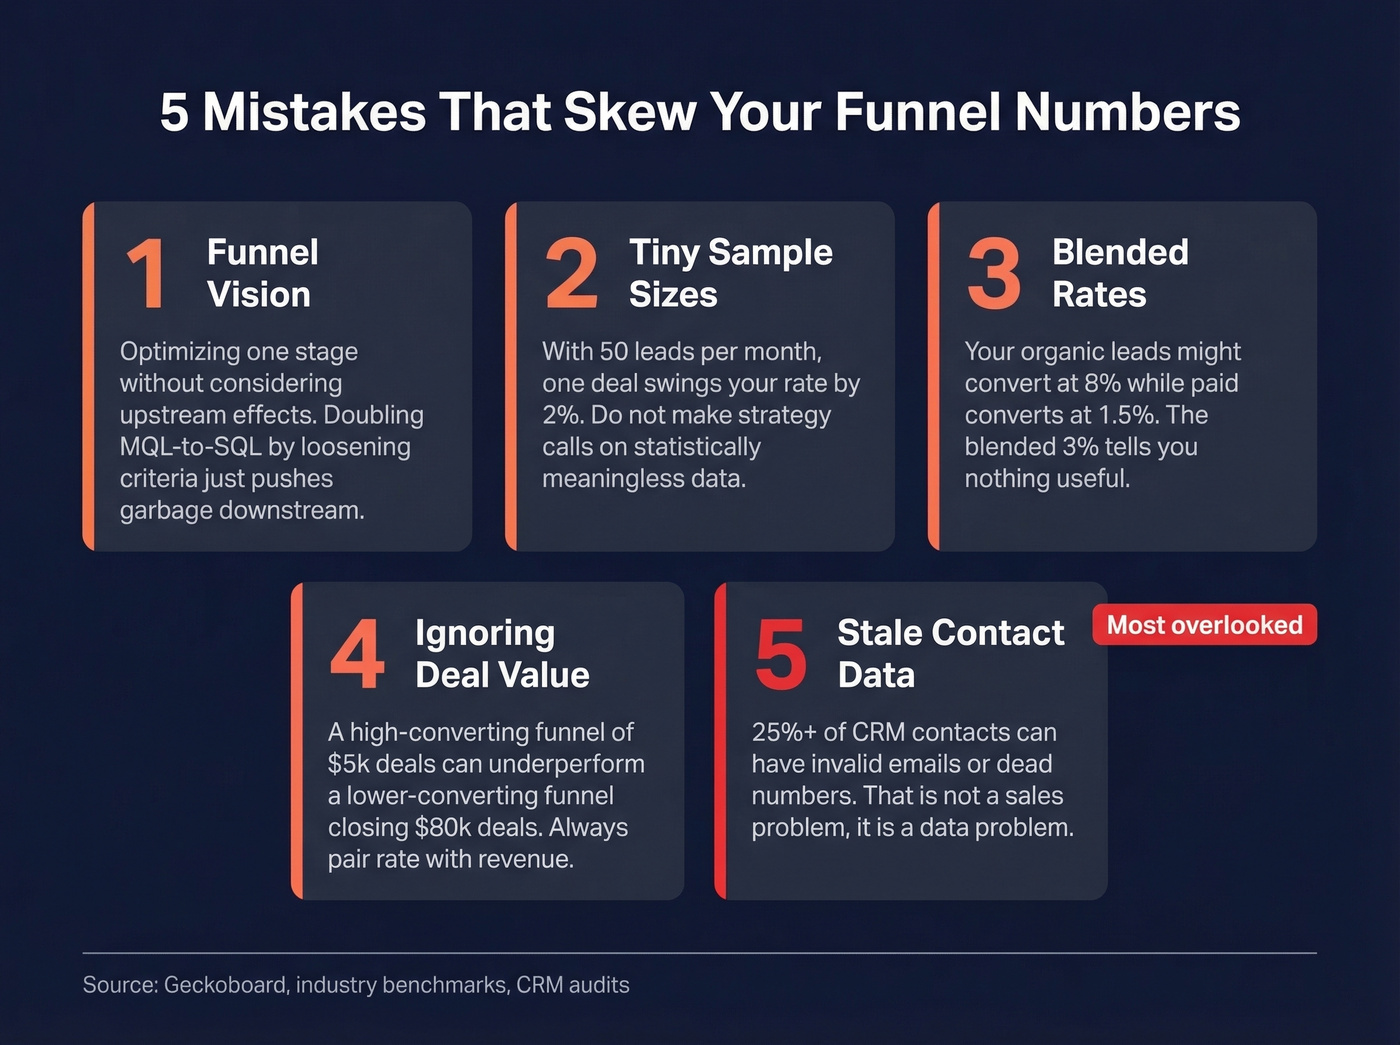
2. Bad sample sizes. If you're measuring conversion rates on 50 leads per month, a single deal closing or falling through swings your rate by 2%. Don't make strategic decisions on statistically meaningless samples.
3. Not segmenting new vs existing, ad vs organic. A blended rate hides the signal. Your organic leads might convert at 8% while your paid leads convert at 1.5%. The blended 3% tells you nothing useful.
4. Confusing conversion rate with revenue. A high-converting funnel of $5k ACV deals can underperform a lower-converting enterprise funnel closing $80k deals. Always pair conversion rate with deal value and LTV.
5. Ignoring data freshness. Stale emails and phone numbers make your MQL-to-SQL rate look artificially low - not because reps can't sell, but because they can't reach anyone. We've seen teams where 25%+ of CRM contacts had invalid emails or disconnected numbers. That's not a sales problem. It's a data problem.
Funnel Velocity - The Metric You're Probably Ignoring
Conversion rate tells you how many deals move forward. Velocity tells you how fast. We've watched teams obsess over close rates while ignoring that their average deal takes 6 months to close - a 20% close rate with a 6-month cycle is objectively worse than 15% with a 6-week cycle.
| Stage Transition | Typical Timeframe |
|---|---|
| Lead to MQL | 1-3 weeks |
| MQL to SQL | 2-4 weeks |
| Mid-market cycle | 4-8 weeks |
| Enterprise cycle | 3-6 months |
Pipeline velocity in dollars per day varies dramatically by industry: the low end is around $743/day, SaaS & Tech averages $1,847/day, Financial Services hits $2,134/day, and Real Estate & Construction leads at $2,456/day. If you're not tracking velocity alongside conversion rate, you're only seeing half the picture.
How to Improve Each Funnel Stage
Top of Funnel
A 1-second page-load delay reduces conversions by 7%. Personalized CTAs convert 200%+ better than generic ones. If your visitor-to-lead rate is below 1.5%, fix page speed and CTA relevance before you touch anything else. Those two changes alone can move the needle more than a full site redesign.
Middle of Funnel
Multichannel outreach - email, phone, and social - produces 2-4x the conversion lift versus single-channel approaches. The MQL-to-SQL handoff is the most common bottleneck in B2B funnels, and it's almost always a process problem, not a content problem.
Are reps following up within 24 hours? That single follow-up boosts response rates by 49%. Speed and process beat messaging every time at this stage. If you need a repeatable system, start with proven sales follow-up templates.
Bottom of Funnel
For ecommerce, two-step checkout flows improve conversion by 20-40% versus single-step. For B2B, social proof at the proposal stage - case studies, customer logos, reviews - reduces friction for buyers who need internal justification. Don't underestimate how much a well-placed case study can do when your champion is selling internally.
Fix Your Data Before Your Funnel
Look, if your MQL-to-SQL rate is below 30%, audit your contact data before you blame your reps. Prospeo's email finder verifies emails in real time with 98% accuracy and refreshes data every 7 days, so your funnel metrics reflect actual sales performance rather than data decay. The free tier gives you 75 emails and 100 Chrome extension credits per month to test the impact. If you're comparing vendors, start with data enrichment services and a dedicated email deliverability guide so fixes stick.
Outbound funnels need 62 touches to convert - and every bounce resets the clock and torches your domain. Prospeo refreshes data every 7 days (not the 6-week industry average), so your sequences hit live inboxes from touch one through touch sixty-two.
Your funnel can't convert contacts that don't exist. Get verified data at $0.01/email.
FAQ
How do you calculate sales funnel conversion rate?
Divide conversions at any stage by entries into that stage, then multiply by 100. For overall funnel performance: (Closed Won / Total Leads) x 100. A funnel that closes 15 of 500 leads has a 3% end-to-end rate. Track each stage separately - overall numbers hide where drop-offs actually happen.
What's a good B2B funnel conversion rate?
Most B2B funnels convert 3-7% end-to-end, but this varies heavily by industry and channel. B2B SaaS averages roughly 37% SQL-to-Closed; financial services averages around 53%. Benchmark against your specific vertical and track quarter-over-quarter trends rather than chasing generic averages.
Does funnel velocity matter more than conversion rate?
Neither metric is useful alone. A 25% close rate means nothing if deals take 6 months. Track both: conversion rate shows how much pipeline converts, velocity shows how fast revenue materializes. The combination reveals whether your funnel is healthy or just slow.
How does bad contact data affect funnel metrics?
Invalid emails and disconnected phone numbers artificially deflate your MQL-to-SQL rate - reps aren't failing to sell, they're failing to connect. Cleaning your CRM data and using verified contact sources can shift that number meaningfully within a single quarter.