Sales Funnel Metrics: What to Track in 2026
Your VP asks why pipeline is up 30% but closed-won revenue is flat. You pull up the dashboard, and it's a wall of numbers - leads, MQLs, opportunities, activities - none of which answer the actual question. The problem isn't a lack of data. It's tracking the wrong sales funnel metrics, or tracking the right ones without knowing what "good" looks like.
A Reddit practitioner who audited 100+ sales funnels found that most teams "collected vanity metrics instead of insights." Traffic numbers and basic conversion rates tell you almost nothing about why people aren't buying. Let's fix that.
The Short Version
- Track three metrics minimum: stage-to-stage conversion rate, Lead Velocity Rate (LVR), and sales velocity. Everything else is supporting detail.
- Benchmarks vary wildly by industry. B2B SaaS converts 39% of leads to MQLs; eCommerce converts 23%. Know your baseline before you start optimizing.
- Your metrics are only as good as your data. If your email bounce rate is above 5%, every downstream conversion rate is inflated. Garbage in, garbage out - literally.
Define Your Funnel Stages First
Before you measure anything, you need shared definitions. We've seen teams where one rep counts "any meeting interest" as an SQL while another waits for full BANT qualification. That inconsistency makes your conversion data meaningless, and any funnel report built on top of it will be unreliable.
Here's the standard five-stage framework most B2B teams use:
| Stage | Definition |
|---|---|
| Lead | Any identified contact |
| MQL | Meets marketing criteria |
| SQL | Sales-qualified, ready to work |
| Opportunity | Active deal in pipeline |
| Closed Won | Signed contract |
The specific criteria matter less than consistency. Pick definitions, document them, and enforce them across every rep and every quarter. As Airtree's framework warns, inconsistency across reps is a major source of unreliable funnel data.
One caveat: real buyers don't move through these stages in a neat line. Prospects revisit earlier stages, loop back after going dark, and skip steps entirely. Track the linear stages for measurement, but build your process to handle the non-linear reality.
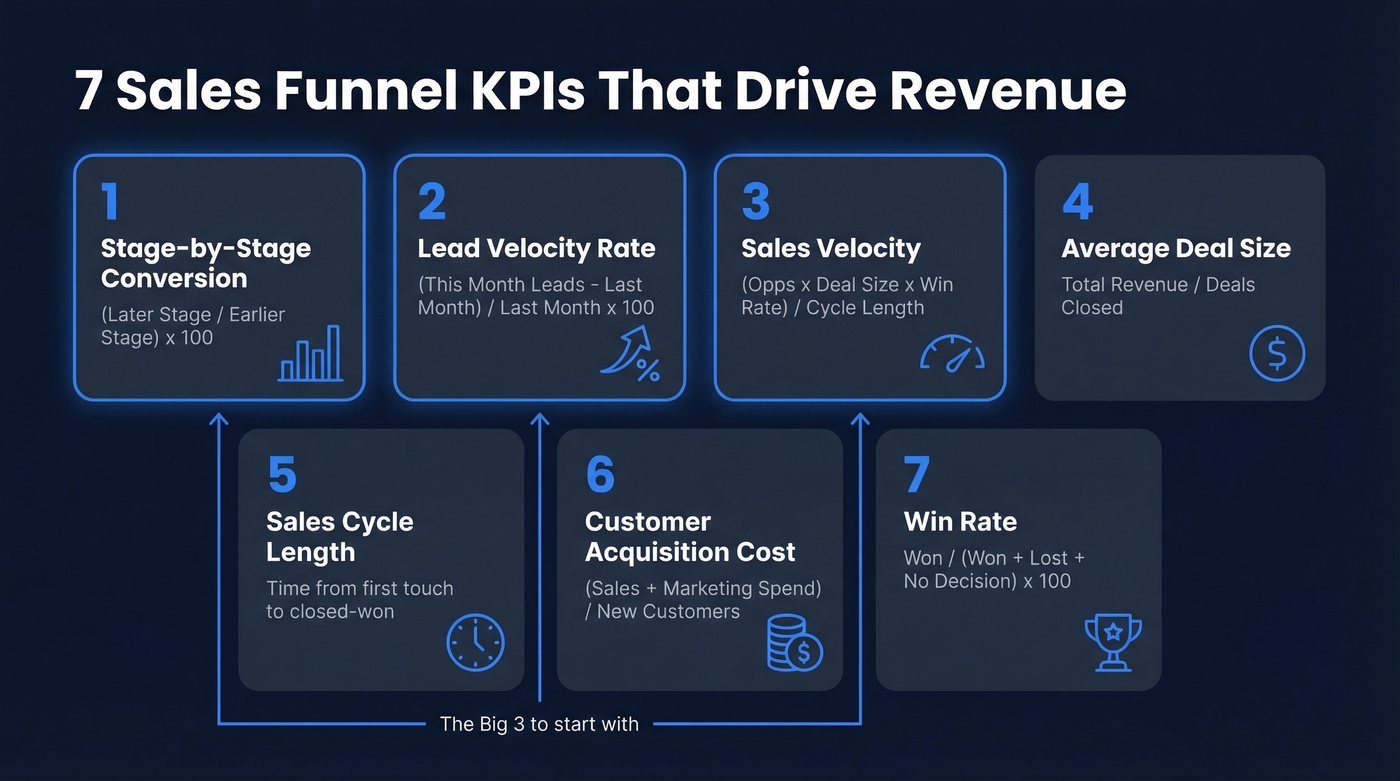
7 Funnel KPIs That Drive Revenue
1. Stage-by-Stage Conversion Rates
Formula: (Later stage / Earlier stage) x 100
This is the diagnostic metric. It tells you exactly where prospects drop off, which means it tells you where to focus. FirstPageSage's latest benchmarks put B2B SaaS at 39% Lead-to-MQL and 38% MQL-to-SQL. Other compilations put MQL-to-SQL as low as 13%, which underscores why knowing your own baseline matters more than chasing any single benchmark.
The mistake most teams make is reacting to a low conversion rate by increasing volume at the top. That just pushes the problem downstream. If your MQL-to-SQL rate is 15% when the benchmark is 38%, you have a qualification problem, not a volume problem.
2. Lead Velocity Rate (LVR)
Formula: (Qualified leads this month - last month) / last month x 100
This is the most underrated metric in B2B sales. Revenue is a lagging indicator - it tells you what happened. LVR tells you what's about to happen. As SaaStr's classic breakdown argues, pipeline value is unreliable for predicting the future, but qualified lead growth is remarkably predictive.
SaaStr recommends targeting LVR at 10-20% above your desired MRR growth rate. If you want 100% year-over-year revenue growth, you need roughly 8-10% month-over-month lead growth to sustain it. If leads are growing but revenue isn't, you've got a sales execution or product competitiveness issue - not a marketing problem.
If your LVR is flat or declining while revenue targets are rising, sound the alarm immediately. That gap will show up in your pipeline within weeks.
3. Sales Velocity
Formula: (Opportunities x Avg Deal Size x Win Rate) / Sales Cycle Length
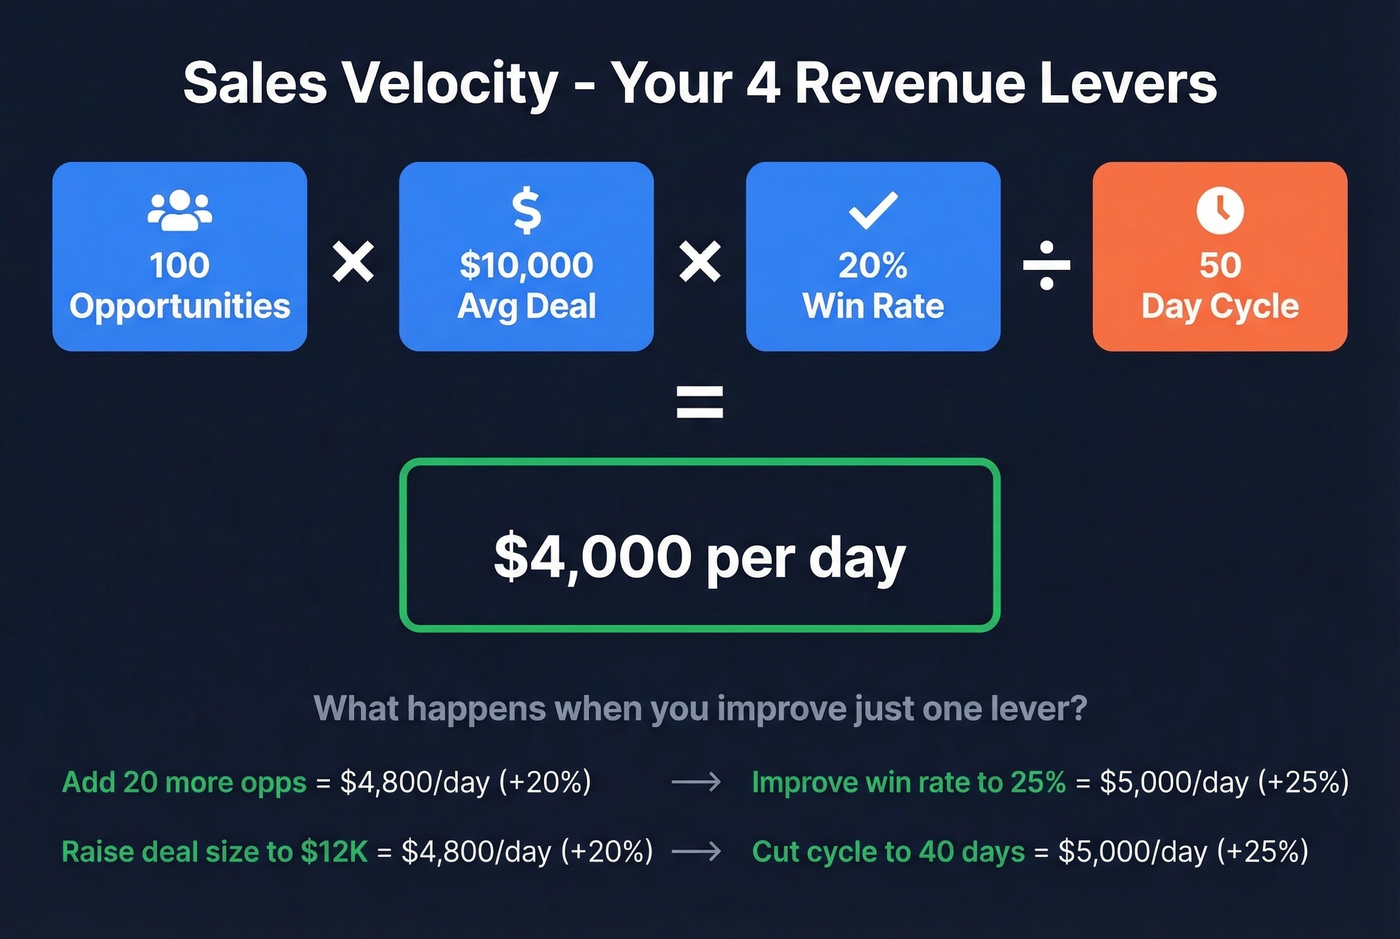
This is the metric that ties everything together. Worked example: 100 opportunities x $10,000 average deal x 20% win rate / 50-day cycle = $4,000/day in revenue generation.
The power of this formula is that it shows you four levers, not one. You can increase velocity by winning more deals, closing bigger deals, improving win rates, or shortening the cycle. Most teams fixate on one lever. The best RevOps teams model all four.
Here's the thing: a widely cited HBR finding suggests 40-60% of deals are lost to "no decision" - the prospect simply fails to decide. Your sales cycle length isn't just about speed. It's about whether deals are actually progressing or just sitting in your pipeline inflating your numbers.
4. Average Deal Size
Formula: Total revenue / Number of deals closed
Straightforward, but the critical nuance is segmentation. Don't mix $5K SMB deals and $100K enterprise deals in the same velocity calculation. They have fundamentally different cycles, win rates, and resource requirements. Blending them produces an "average" that describes no actual deal you'll ever close.
Track average deal size by segment, by channel, and by rep. If yours is shrinking quarter over quarter, check whether reps are discounting to close or whether your ICP has shifted downmarket. A rep whose average deal size is climbing is either moving upmarket or getting better at multi-threading - both worth understanding.
5. Sales Cycle Length
Benchmark: ~2 weeks for $1-2K deals, ~6 months for $100K+ deals
Cycle length is the denominator in your velocity equation, which means shortening it has an outsized impact. But don't just measure the overall number - break it down by stage. If your SQL-to-Opportunity conversion takes 45 days but Opportunity-to-Close takes 20, the bottleneck is in the middle of your funnel, not at the end where most teams focus.
When cycle length creeps up, look at your SQL-to-Opportunity stage first. That's usually where deals stall because the prospect hasn't been properly qualified or the champion hasn't been identified.
6. Customer Acquisition Cost (CAC)
Formula: Total sales + marketing spend / New customers acquired
The average B2B SaaS CAC sits around $1,200, though this varies enormously by deal size and motion. The median SaaS company spends $2.00 to acquire $1.00 of new ARR. The average CAC payback period is 23 months.
The number that matters more than CAC alone is the LTV:CAC ratio. 3:1 is healthy, 4:1 is strong, anything below 3:1 means you're spending too much relative to what customers are worth. Pair this with payback period - under 12 months is great, over 24 months means you'd better have very strong retention.
7. Win Rate
Formula: Won deals / (Won + Lost + No Decision) x 100
Here's the contrarian take: win rate without "no decision" tracking is a vanity metric. If you only count won vs. lost, you're ignoring the 40-60% of deals that simply evaporate. Those aren't wins or losses - they're a separate category that reveals whether your pipeline is real or aspirational.
FirstPageSage data shows B2B SaaS opportunity-to-close rates ranging from 32-40% depending on channel. But that number is meaningless if you aren't categorizing your losses. A team with a 35% win rate and 10% no-decision rate is in a fundamentally different position than a team with a 35% win rate and 40% no-decision rate. The first team loses to competitors. The second team loses to inertia.
Every funnel metric in this article breaks down when your contact data is bad. A 35% bounce rate inflates your MQL count and destroys your stage-to-stage conversion accuracy. Prospeo delivers 98% email accuracy with a 7-day refresh cycle - so your Lead Velocity Rate and sales velocity calculations reflect reality, not stale records.
Clean data in, reliable funnel metrics out. Start with 75 free emails.
Conversion Benchmarks by Stage and Industry
Benchmarks are useful as a sanity check, not a target. Your funnel is unique. But if your numbers are wildly off from these, it's worth investigating why.
Stage-to-stage conversion by industry:
| Industry | Lead-to-MQL | MQL-to-SQL | SQL-to-Opp | SQL-to-Closed |
|---|---|---|---|---|
| B2B SaaS | 39% | 38% | 42% | 37% |
| eCommerce | 23% | 58% | 66% | 60% |
| Cybersecurity | 24% | 40% | 43% | 46% |
| Higher Education | 45% | 46% | 61% | 66% |
| CRM | 36% | 42% | 48% | 38% |
| Edtech | 46% | 35% | 39% | 40% |
SQL-to-Closed is a full-funnel conversion from qualification to closed-won, not a single stage transition.
Data from FirstPageSage's benchmarks report, based on anonymized client data gathered 2017-2025 across 65% B2B, 20% B2C, and 15% mixed companies.
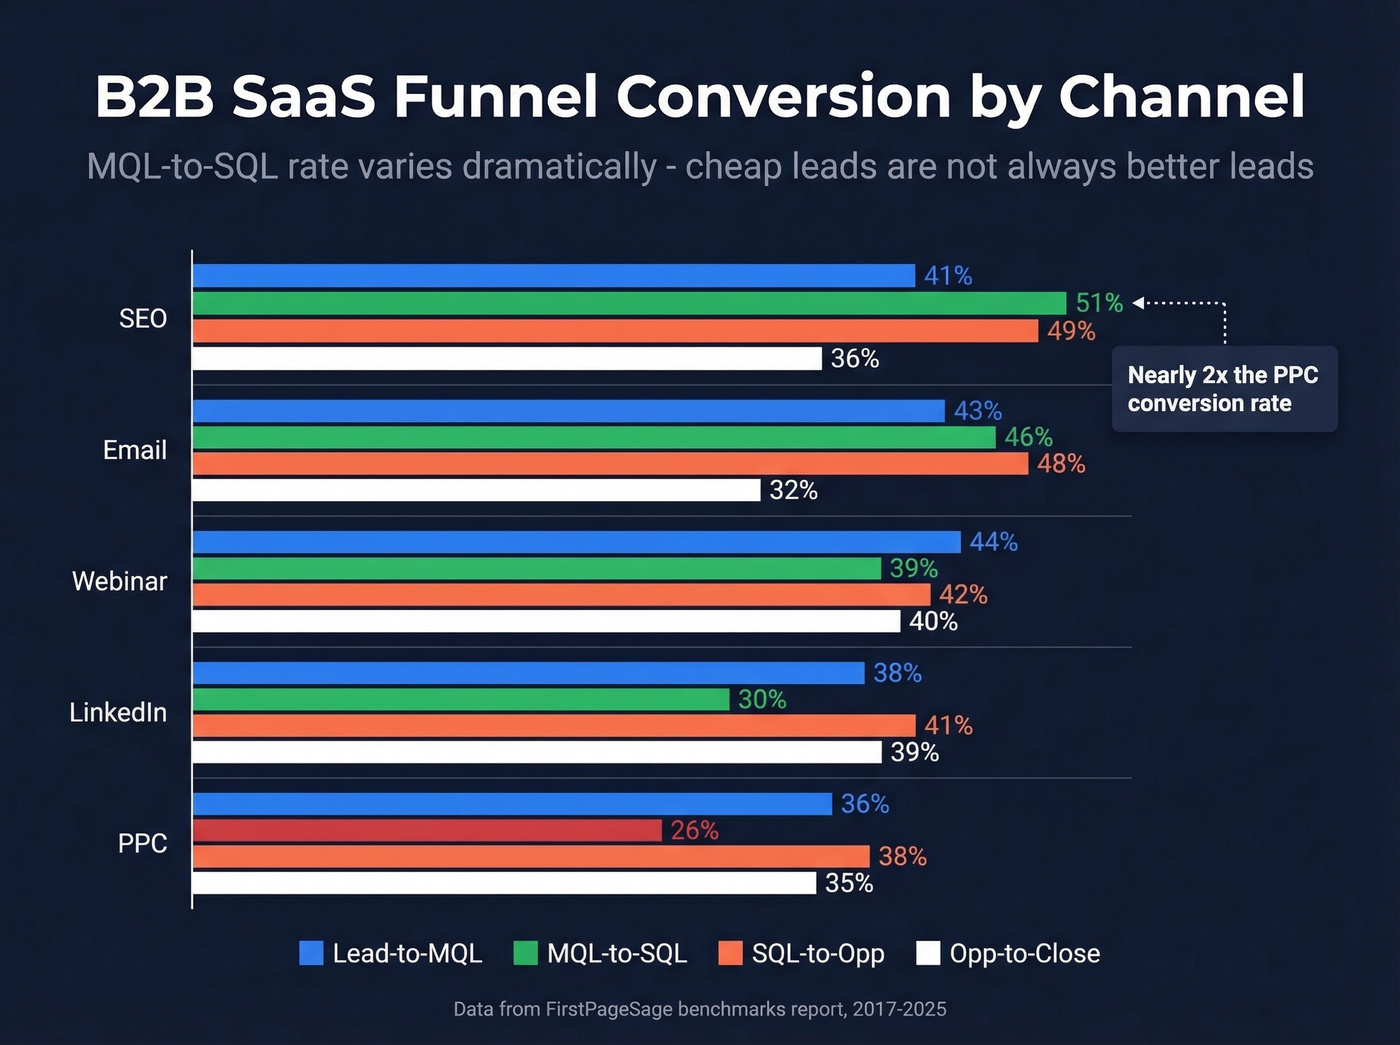
Funnel conversion by channel (B2B SaaS):
| Channel | Lead-to-MQL | MQL-to-SQL | SQL-to-Opp | Opp-to-Close |
|---|---|---|---|---|
| SEO | 41% | 51% | 49% | 36% |
| PPC | 36% | 26% | 38% | 35% |
| 38% | 30% | 41% | 39% | |
| 43% | 46% | 48% | 32% | |
| Webinar | 44% | 39% | 42% | 40% |
Notice how SEO leads convert at nearly double the rate of PPC leads in the MQL-to-SQL stage (51% vs 26%). This is why cost-per-lead comparisons without downstream conversion data are misleading. A $200 SEO lead that converts at 51% can produce cheaper SQLs than a $50 PPC lead that converts at 26%.
If your average deal is under $10K, you probably don't need seven KPIs and a BI tool. Track stage-to-stage conversion, LVR, and sales velocity in a spreadsheet. Add complexity only when those three stop answering your questions.
Reverse-Engineering from Revenue Targets
The most practical use of funnel analytics is working backward from a revenue goal. Here's a worked example using the back-calculation method from Airtree's framework.
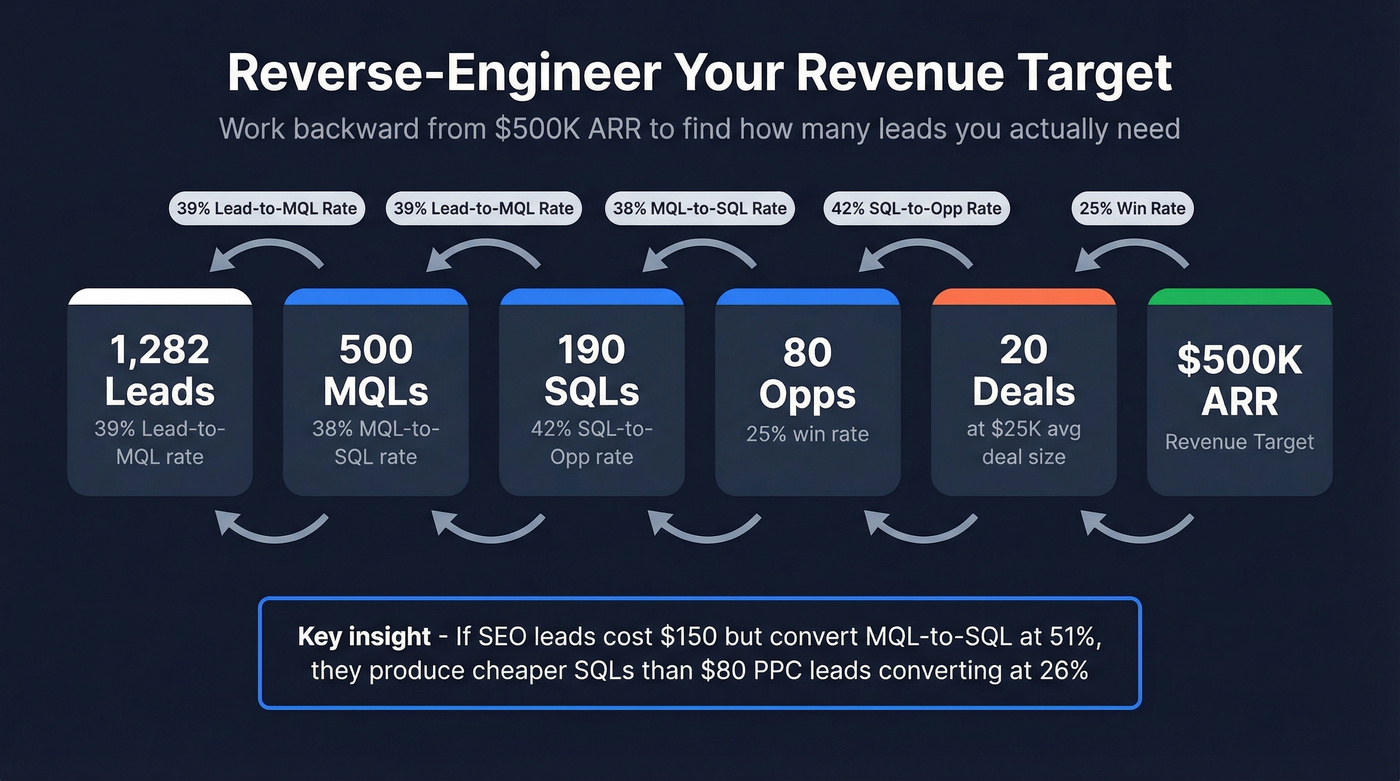
Goal: $500K in new ARR this quarter.
- Average deal size: $25K - you need 20 closed deals
- Win rate: 25% - you need 80 opportunities
- SQL-to-Opportunity: 42% - you need 190 SQLs
- MQL-to-SQL: 38% - you need 500 MQLs
- Lead-to-MQL: 39% - you need ~1,282 leads
Now layer in channel economics. If SEO delivers leads at $150 each but converts MQL-to-SQL at 51%, and PPC delivers leads at $80 each but converts at 26%, the SEO channel produces cheaper SQLs despite the higher CPL. This is how stage-level funnel data actually informs budget allocation - it reveals the true cost of a customer, not just the cost of a lead.
Once you've built this model, use it as a forecast funnel: plug in next quarter's targets and work backward to see whether your current lead volume and conversion rates can support the revenue plan. If the math doesn't work, you know before the quarter starts - not after.
Five Funnel Measurement Mistakes
1. Tracking vanity metrics. Total leads, page views, email opens - these feel good in a weekly report but tell you nothing about revenue. Track stage-to-stage conversion and velocity. Everything else is supporting context.
2. Optimizing the wrong stage. That same Reddit audit found teams "obsessing over the bottom of the funnel when the real problem was at the top." One practitioner reported that fixing messaging barriers at the top - not sales enablement at the bottom - increased conversion by 4.7% and added $28,200 in monthly revenue. If your Lead-to-MQL rate is 15% and your Opp-to-Close rate is 35%, fix the top first.
3. Confusing complexity with sophistication. The audit also found that "the most effective funnels were shockingly simple." Five stages is enough for most B2B teams. If you've got eight or ten, you're creating measurement overhead without gaining insight.
4. Ignoring "no decision" losses. A "lost" deal and a "no decision" deal require completely different responses. Lost deals need competitive intelligence. No-decision deals need better qualification and urgency creation. If you aren't tracking them separately, your win rate is fiction.
5. Garbage data at the top. 60% of consumers take 6+ actions before buying, which means attribution is already hard. Now add bad contact data, and every metric downstream becomes meaningless. If 15% of your emails bounce, your "1,000 leads" are actually 850 - and every downstream conversion rate is inflated by roughly 15%. We've seen teams running Prospeo's real-time email verification cut bounce rates from the 35-40% range to under 5%, which finally gave them accurate numbers to optimize against.
Building a Funnel Dashboard
You don't need a $50K BI tool. You need four report blocks, connected data, and a review cadence. Based on Coupler.io's dashboard structure:
Stage-to-stage conversion tracking is your core diagnostic - visualize where prospects drop off, updated weekly. Marketing channel attribution connects source to revenue outcome, not just lead creation, which requires linking your CRM with GA4 and ad platforms. Geographic performance analysis catches regional problems that aggregate numbers hide; don't let a strong US funnel mask a broken EMEA one. And revenue correlation analysis tracks how conversion improvements translate to actual closed revenue over time.
For deeper insights, try cohort analysis: group leads by the month or campaign they entered and track how each cohort progresses through stages. This reveals whether recent process changes are actually improving outcomes or whether you're just riding momentum from an older, higher-quality cohort.
Most teams run this on HubSpot or Salesforce for CRM data, GA4 for web analytics, and Looker or Power BI for cross-source reporting. Teams using mobile CRM access hit targets at nearly 3x the rate of those without (65% vs 22%).
In our experience, weekly reviews catch bottlenecks before they compound. Review pipeline and conversion metrics weekly. Review CAC, LTV, and velocity monthly. Benchmark against industry data quarterly.
Your sales velocity formula has four levers - but none of them work if reps waste hours chasing wrong numbers and bounced emails. Prospeo gives your team 125M+ verified mobiles with a 30% pickup rate and 143M+ verified emails at $0.01 each. Shorten your sales cycle and boost win rates by actually reaching decision-makers.
Stop losing deals to bad contact data. Reach real buyers on the first try.
FAQ
What's the most important sales funnel metric?
Stage-to-stage conversion rate tells you exactly where prospects drop off and where to focus improvement efforts. Pair it with Lead Velocity Rate for a forward-looking view of pipeline health. Together, they answer both "where's the problem?" and "is it getting better or worse?"
What's a good lead-to-customer conversion rate?
For B2B SaaS, 1-5% is typical across the full funnel from lead to closed-won; above 5% is strong. SEO-sourced leads convert at roughly 2x the rate of PPC leads through the mid-funnel, making channel mix a major factor in your blended number.
How often should I review funnel KPIs?
Review pipeline and conversion metrics weekly to catch bottlenecks before they compound. Evaluate CAC, LTV, and sales velocity monthly - they need a larger sample to be meaningful. Benchmark against industry data quarterly and recalibrate targets accordingly.
How does bad data affect funnel metrics?
If 15% of your emails bounce, your "1,000 leads" are actually 850, and every downstream conversion rate is inflated by ~15%. Running your list through a verification tool like Prospeo's email finder reveals your real conversion rates - almost always lower than expected, but that's the truth you need to optimize against.
What about pipeline coverage ratio?
Most RevOps teams target 3-4x coverage, meaning $3-4M in pipeline to close $1M in revenue. It's a quick health check, but it doesn't reveal where the funnel is broken the way stage-to-stage conversion does. Use it as a complement, not a replacement.