Sales KPIs: The Metrics That Actually Move Revenue in 2026
Your CRO just asked for "the dashboard." You pull up the BI tool and stare at 47 metrics - pipeline value, email open rates, average handle time, lead velocity, something called "sales efficiency ratio" that nobody remembers defining. None of them answer the only question that matters: are we going to hit the number this quarter?
That's the problem with most sales KPIs. Teams drown in data while starving for insight.
McKinsey's analysis of nearly 500 B2B companies found that top-quartile orgs generate roughly 2.5x higher gross margin per dollar invested in sales. The difference isn't more data. It's the right data, watched by the right people, at the right cadence.
The Short Version
If you remember nothing else, track these five:
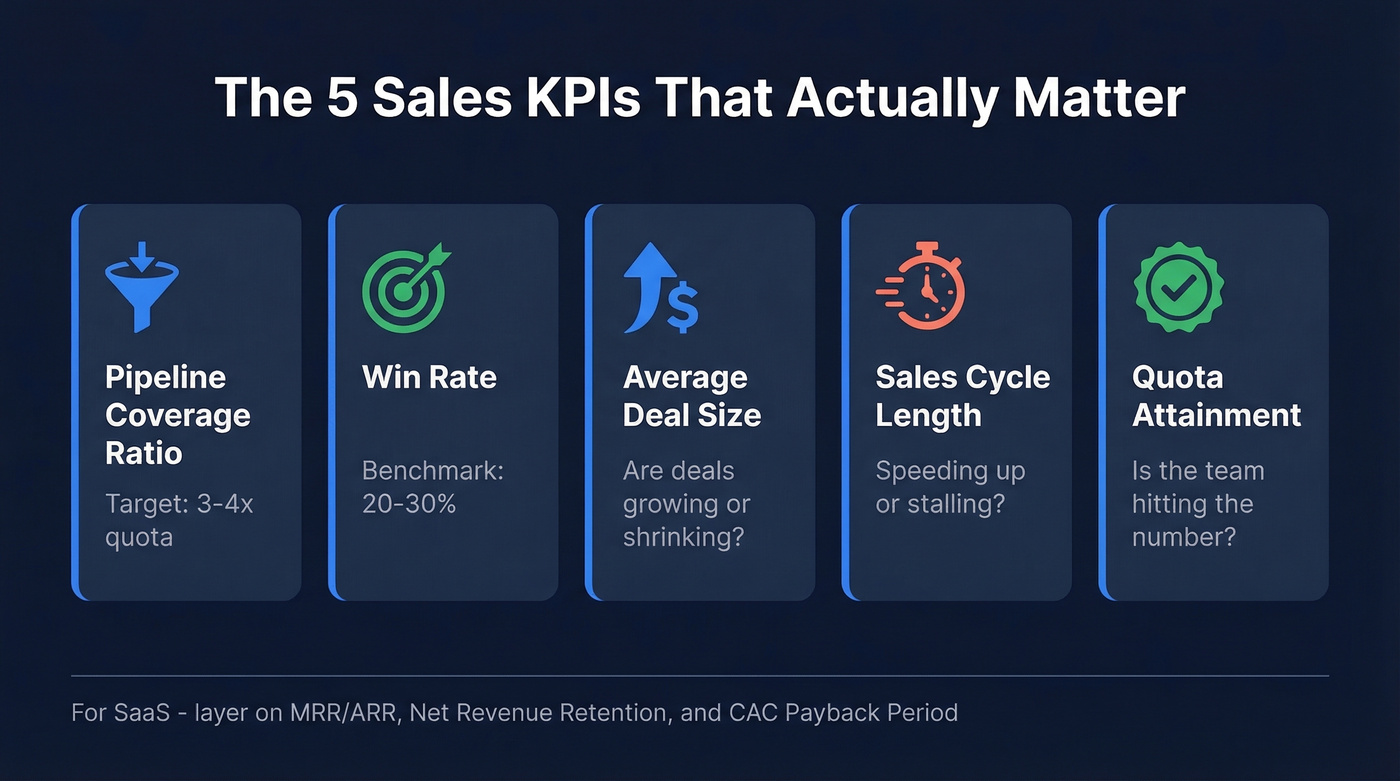
- Pipeline coverage ratio - are you feeding the machine enough?
- Win rate - are you closing what you create?
- Average deal size - are deals getting bigger or smaller?
- Sales cycle length - are deals speeding up or stalling?
- Quota attainment - is the team hitting the number?
For SaaS, layer on MRR/ARR, net revenue retention, and CAC payback period. Everything else is a refinement. Keep your dashboard to 4-10 KPIs max. More than that and you're performing data theater - tracking things to feel productive instead of actually being productive.
What Are Sales KPIs?
A sales KPI is a metric with a job. "Emails sent" is a metric - it tells you something happened. "Emails sent per qualified meeting booked" is a KPI when you attach a target ratio and review it weekly. The word "key" is doing the heavy lifting here. If everything's a KPI, nothing is.
| Metric | KPI | |
|---|---|---|
| Definition | Any measurable data point | A metric tied to a goal |
| Has a target? | No | Yes |
| Drives action? | Sometimes | Always |
| Example | 342 calls this week | 1 meeting/12 calls (target 1:10) |
Most sales orgs track a long list of metrics. Only 5-7 should be KPIs - the ones that, if they move, change what you do tomorrow.
How to Choose the Right KPIs
Start with the goal, not the metric.
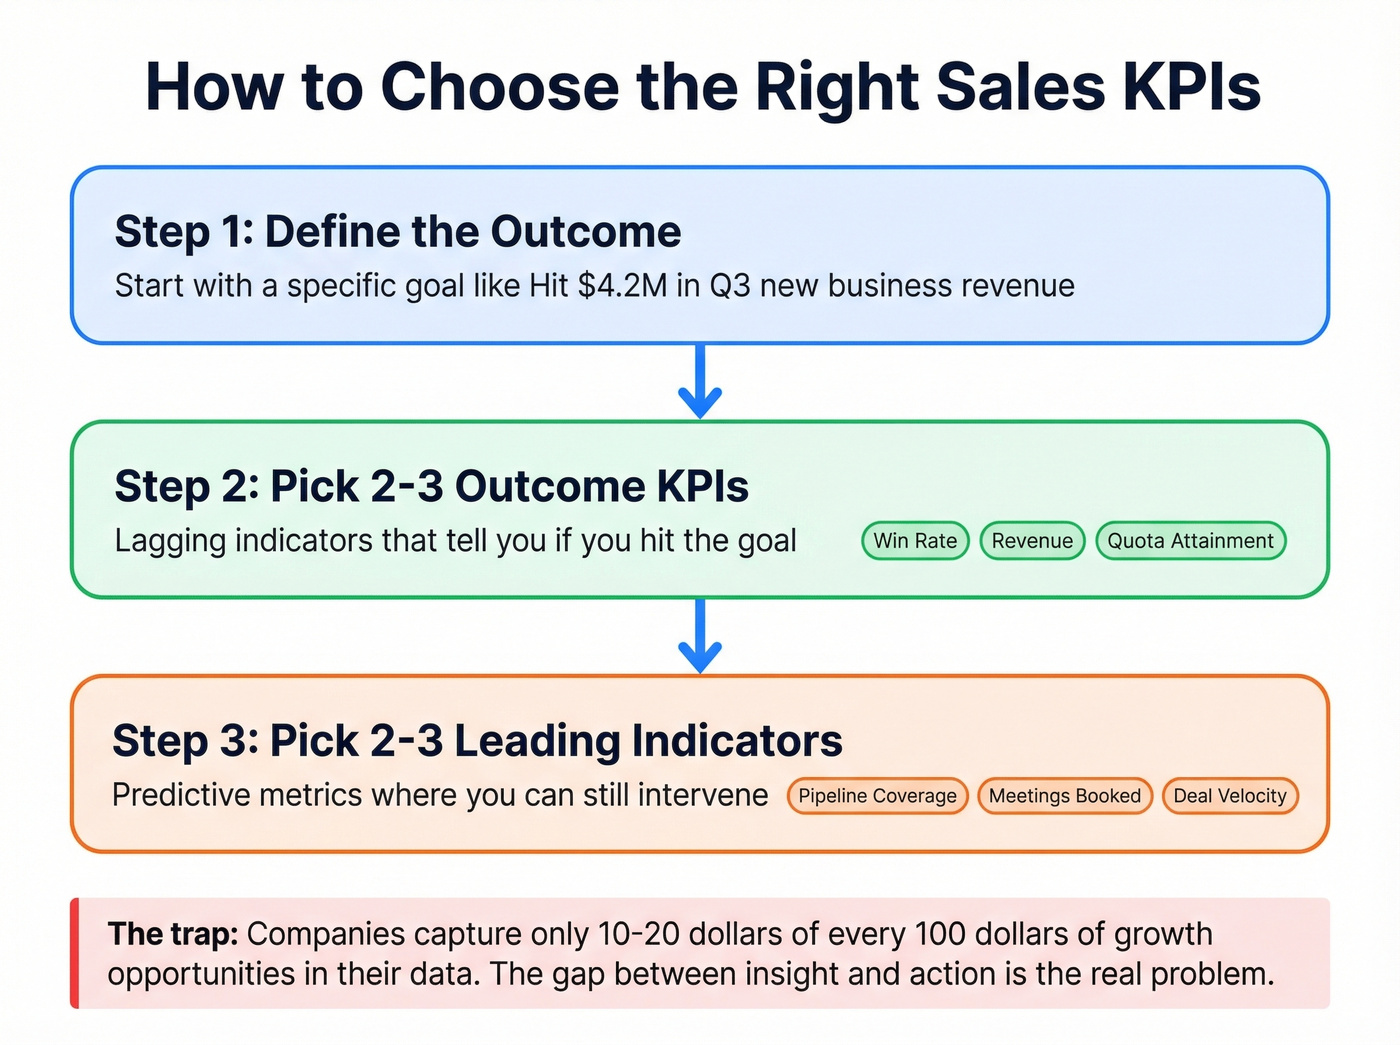
Step 1: Define the outcome. "Hit $4.2M in Q3 new business revenue" is a goal. "Track more stuff" isn't.
Step 2: Pick 2-3 outcome KPIs. These are lagging indicators - they tell you whether you hit the goal. Win rate, revenue, quota attainment.
Step 3: Pick 2-3 leading indicators. These predict whether you'll hit the outcome. Pipeline coverage, meetings booked, deal velocity. Leading indicators are where you intervene. By the time a lagging indicator moves, it's too late to do anything about it.
Outreach's KPI selection framework puts it simply: define goals, identify the actions needed, then prioritize the KPIs that tell you what to do next. A KPI that doesn't change behavior is just a number on a screen.
Here's the uncomfortable truth: non-selling activities consume roughly two-thirds of the average sales team's time. If your performance indicators don't help reps spend more time selling, you're measuring the wrong things.
The trap most teams fall into is collecting data without converting it to action. McKinsey found that companies capture only 10-20 dollars of every 100 dollars of growth opportunities they discover in their data. The KPIs aren't the problem. The gap between insight and action is.
The KPIs That Actually Matter
Each KPI below gets a definition, formula, benchmark, and review cadence.
Revenue & Growth
Monthly/Quarterly Revenue - total closed-won revenue in the period. Formula: sum of all closed deals. Review: monthly. This is the scoreboard. Everything else exists to move this number.
Sales Growth Rate - period-over-period revenue change. Formula: ((Current Period Revenue - Prior Period Revenue) / Prior Period Revenue) x 100. Benchmark: 15-25% annual growth for healthy B2B companies. Review: quarterly.
Average Deal Size - revenue per closed deal. Formula: Total Revenue / Number of Deals Closed. Shrinking deal size is an early warning sign that your team is discounting too aggressively or drifting downmarket. Review: monthly.
Revenue Per Rep - total revenue divided by headcount. This tells you whether hiring is working or just diluting. Review: quarterly.
Pipeline
Pipeline Coverage Ratio - the most underrated metric in B2B sales. Formula: Total Pipeline Value / Quota. Benchmark: 3-4x. If you're running at 2x coverage, you're already behind - you just don't know it yet. Review: weekly.
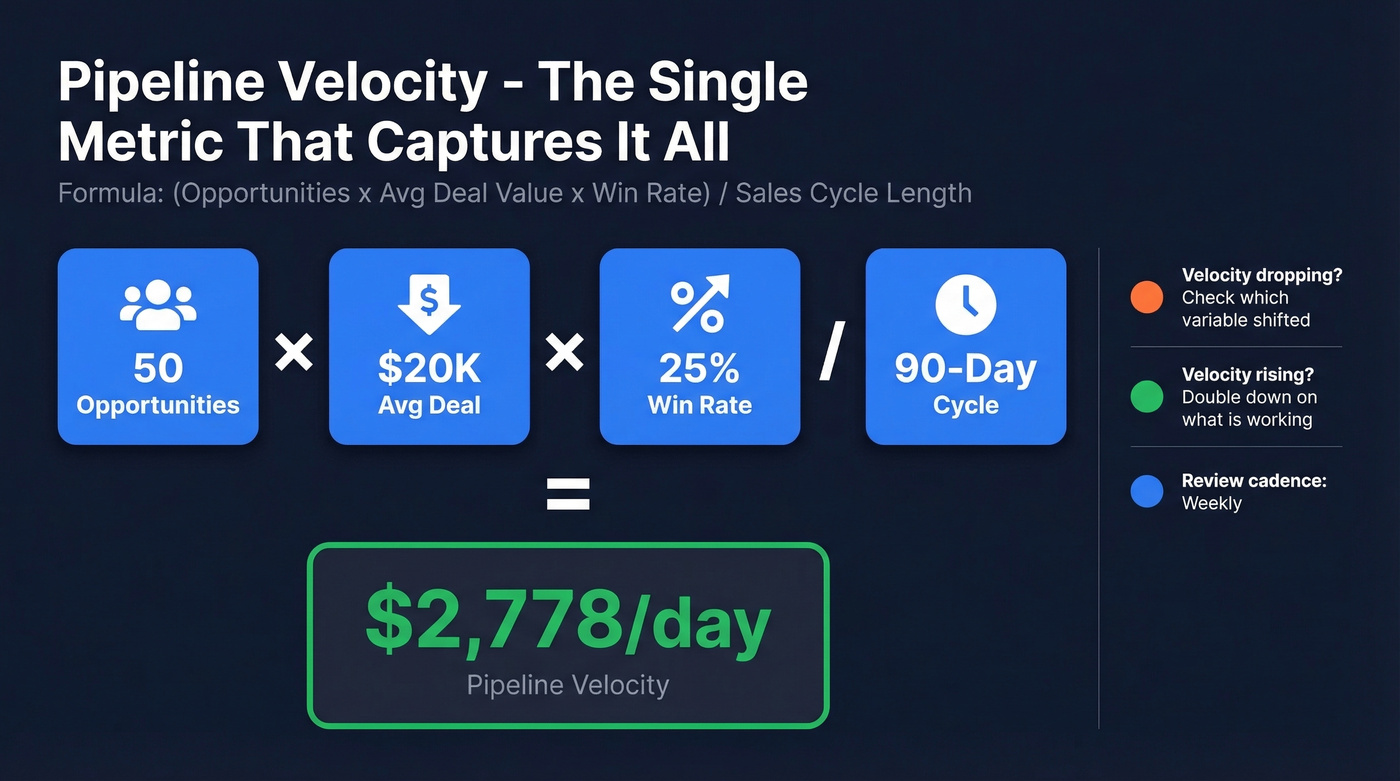
Pipeline Velocity - how fast money moves through your funnel. Formula: (Number of Opportunities x Average Deal Value x Win Rate) / Sales Cycle Length. This is the single indicator that captures four variables in one number. When velocity drops, something's broken. When it rises, something's working.
Worked example: 50 opportunities x $20K average deal x 25% win rate / 90-day cycle = $2,778/day pipeline velocity. If that number drops week-over-week, dig into which variable shifted. Review: weekly.
Deal Slippage Rate - percentage of deals that miss their projected close date. Benchmark: under 20%. Once slippage climbs past 30%, your qualification and forecasting process is breaking down and you need to intervene immediately. Review: weekly.
Opportunity Aging - average days an opportunity sits in a given stage. No universal benchmark, but if deals are sitting 2x longer than your average cycle in mid-funnel stages, they're dead. Call it. Review: weekly.
Conversions
Win Rate - closed-won deals divided by total opportunities. Benchmark: 20-30% for most B2B sales teams. Below 15%, you've got a qualification problem. Above 40%, you might not be creating enough pipeline - sounds counterintuitive, but it usually means reps are cherry-picking easy deals and leaving money on the table. Review: monthly.
Lead-to-Opportunity Conversion - the handoff metric between marketing and sales. Varies wildly by source, but if your inbound leads convert below 10%, the lead definition needs work. Review: monthly.
Quote-to-Close Rate - proposals sent vs. deals won. Benchmark: 15-25%. If you're quoting everyone who asks, this number will be low. Review: monthly.
Calls-to-Meeting Ratio - cold calls per meeting booked. Benchmark: 1:8 to 1:15 depending on industry and persona. Review: daily for reps, weekly for managers.
Activity KPIs (With the AI Caveat)
Look - activity KPIs are dying. When AI sends 500 personalized emails in the time it took a rep to write 10, "emails sent" stops measuring effort and starts measuring your software. Track these as leading indicators, not as performance measures.
Three activity KPIs still worth watching:
Cold Email Open Rate - benchmark: 20-30%. Below 20%, your subject lines or deliverability need work (and your email deliverability probably does too).
Response Rate - benchmark: 8-10% for cold B2B outreach.
Meetings Booked - the activity KPI that still matters because it represents a human commitment. Review: daily.
Retention & Expansion
Retaining a customer costs less than a third of acquiring one, and existing customers generate roughly 10% more revenue than new ones. These KPIs deserve more attention than most teams give them.
Churn Rate - customers lost / total customers. Benchmark: under 7% annually for B2B SaaS. Customer Retention Rate - the inverse, targeting 92-95%. Review both monthly. (If you want to go deeper, do a proper churn analysis.)
Customer Lifetime Value (CLV) - average revenue per customer x average lifespan. Review: quarterly. LTV:CAC Ratio - lifetime value divided by customer acquisition cost. Benchmark: 3:1 or higher. Below 1:1, you're losing money on every customer you acquire (here’s a full breakdown of cost to acquire customer).
Cross-sell/Upsell Contribution - cross-selling increases sales by roughly 20% and profits by 30%, while upselling contributes about 21% of revenue on average. If your team isn't tracking expansion revenue separately, you're hiding your best growth lever. Review: quarterly. (Related: Cross Selling vs Upselling.)
SaaS-Specific KPIs
MRR/ARR - total accounts x rate per account (ARR = MRR x 12). The heartbeat of any SaaS business. Review: monthly.
Net Revenue Retention (NRR) - starting MRR + expansion - contraction - churn, divided by starting MRR. Above 100% means you're growing without adding a single new customer. Best-in-class SaaS runs 110-130%. Review: quarterly.
CAC Payback Period - months to recoup acquisition cost. Formula: CAC / (Monthly Gross Profit), where Monthly Gross Profit = MRR x Gross Margin. Under 12 months is healthy. Over 18 months and you need to rethink either pricing or acquisition spend. NetSuite's SaaS KPI framework covers additional formulas worth bookmarking. Review: quarterly.
Pipeline velocity depends on four variables - but all four collapse when reps waste hours chasing bad contact data. Prospeo's 98% email accuracy and 30% mobile pickup rate mean your team connects with real buyers, not dead ends. That's how Snyk's 50 AEs grew AE-sourced pipeline 180%.
Stop measuring activity on broken data. Start with contacts that connect.
Benchmarks by Sales Motion
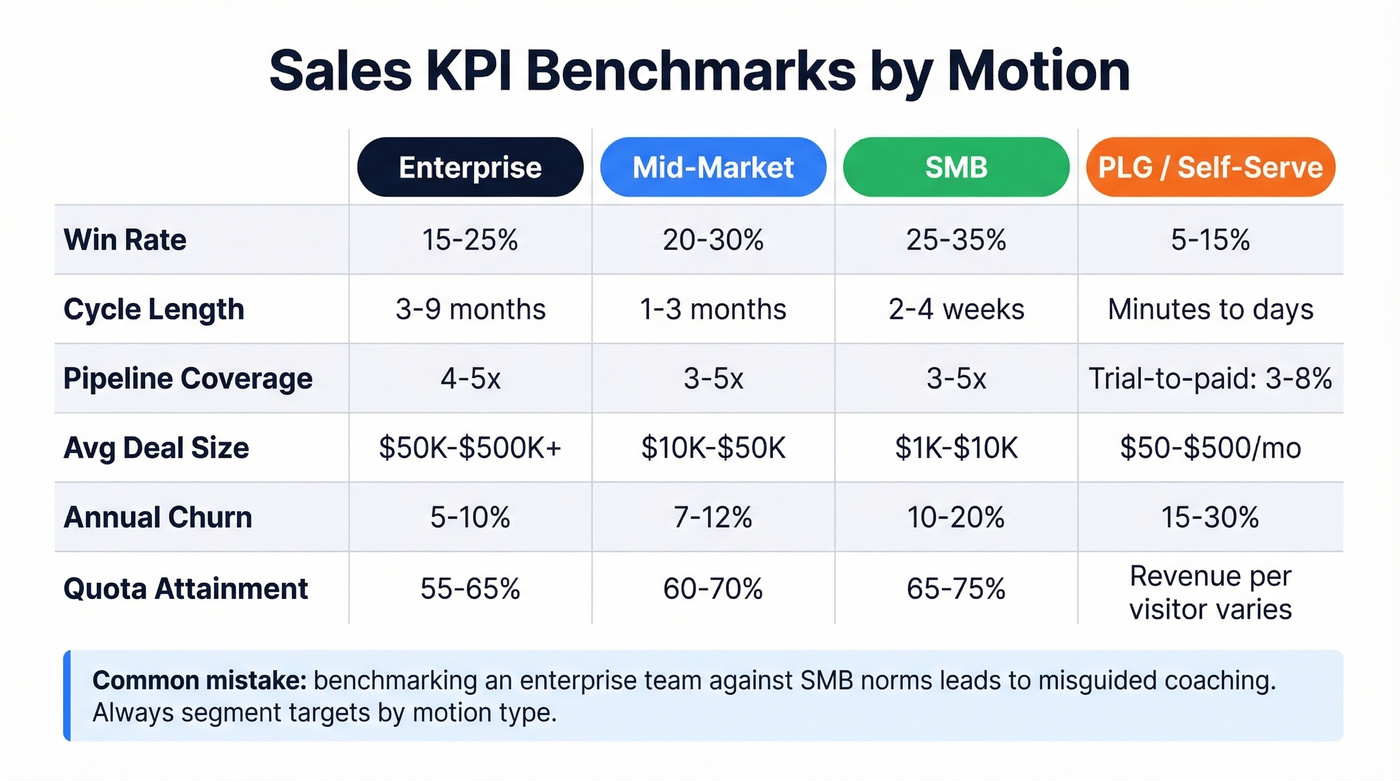
These ranges reflect typical targets across B2B teams. Your numbers will vary by vertical and product maturity, but they give you a baseline for spotting anomalies. One common mistake we see: benchmarking an enterprise team against SMB norms, which leads to misguided coaching. Segment your targets by motion type.
| KPI | Enterprise | Mid-Market | SMB | PLG/Self-Serve |
|---|---|---|---|---|
| Win rate | 15-25% | 20-30% | 25-35% | 5-15% |
| Cycle length | 3-9 months | 1-3 months | 2-4 weeks | Minutes-days |
| Pipeline coverage | 4-5x | 3-5x | 3-5x | Trial-to-paid: 3-8% |
| Avg deal size | $50K-$500K+ | $10K-$50K | $1K-$10K | $50-$500/mo |
| Annual churn | 5-10% | 7-12% | 10-20% | 15-30% |
| Quota attainment | 55-65% | 60-70% | 65-75% | Revenue/visitor: varies |
If your average contract value sits below five figures, skip the 30-KPI dashboard. You need three - pipeline coverage, win rate, and cycle length - and the discipline to review them weekly. Complexity is a luxury that only high-ACV teams can afford, and even they usually can't.
Common Mistakes That Wreck Your Numbers
Tracking too many KPIs. Over 70% of small businesses still rely on spreadsheets or notebooks to track sales. When you're running 30 metrics in a Google Sheet, nothing gets attention. We've talked to dozens of sales managers who track 30+ metrics and can't name the three that matter most. Pick 5-7. Kill the rest.
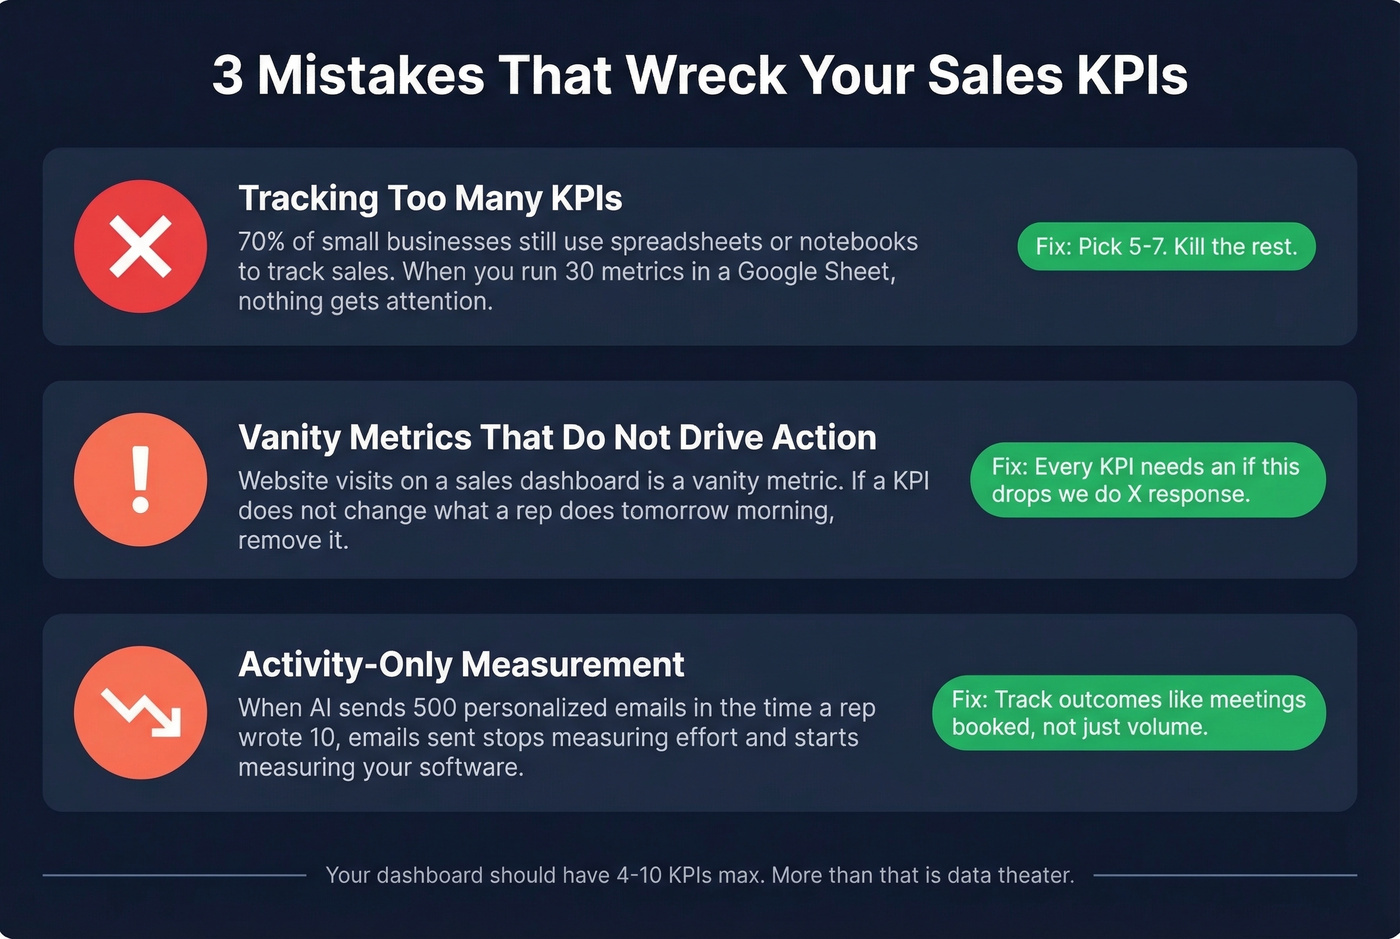
Vanity metrics that don't drive action. "Website visits" on a sales dashboard is a vanity metric. Every KPI should have a clear "if this drops, we do X" response. If it doesn't change what a rep does tomorrow morning, it doesn't belong on the dashboard.
Activity-only measurement in the AI era. If your reps are judged on emails sent and calls made, you're measuring their tools, not their skill. We've seen teams where the top performer by activity metrics was the worst closer. Outcome KPIs reveal what activity KPIs hide.
No review cadence. A KPI reviewed once a quarter is a history lesson, not a management tool. Activity KPIs need daily visibility. Pipeline KPIs need weekly reviews. Revenue KPIs need monthly check-ins. Without cadence, dashboards become wallpaper.
Bad data corrupts every downstream KPI. This is the mistake nobody talks about. Imagine you send 15,000 emails this month. 4,200 bounce. Your "email conversion rate" is now calculated on a denominator that's 28% fiction. Your pipeline velocity is inflated because you're counting phantom opportunities. Your cost-per-meeting is understated because you're dividing by meetings that never should have been counted.

If a third of your emails bounce, every downstream KPI - conversion rate, pipeline velocity, cost per opportunity - is fiction. Prospeo verifies emails at 98% accuracy and refreshes data every 7 days, so the numbers on your dashboard reflect reality instead of stale records. One example: Meritt went from a 35% bounce rate to under 4% after switching, and their pipeline tripled from $100K to $300K per week. That's not a KPI improvement - that's a KPI correction. (If you’re diagnosing this, start with email bounce rate.)
Two-thirds of sales time goes to non-selling activities - and bad data is the biggest culprit. Prospeo gives your reps 300M+ verified profiles with 30+ filters so they spend time closing, not cleaning spreadsheets. At $0.01 per email, your CAC payback KPI will thank you.
Give your reps the data that actually moves every KPI on this list.
How to Build a Sales Dashboard
Data-driven organizations are 6% more profitable, and McKinsey found that companies with data-driven sales-growth engines report EBITDA increases of 15-25%. High-growth companies invest in sales operations at 1.4x the rate of low-growth companies - the dashboard isn't overhead, it's infrastructure.
Apply the 5-second rule: if someone can't grasp the key insight within five seconds of looking at a dashboard view, it's too cluttered. Stick to 5-7 KPIs per view and build role-specific layouts.
Rep Dashboards
Calls made, meetings booked, deals in pipeline, closed-won this period, and an on-pace-to-quota indicator. That's it. Reps need daily visibility into whether they're tracking toward their number, and anything beyond four or five widgets creates noise that kills focus.
Manager Dashboards
Quota attainment by rep, activity trends week-over-week, pipeline coverage by rep, and stage-by-stage conversion rates. The goal is spotting who's struggling before the quarter ends, not after. The best manager dashboards surface outliers automatically so you're coaching the right people at the right time (and fixing pipeline health before it’s too late).
Executive Dashboards
Total revenue vs. forecast, forecast accuracy trending, win rates by segment, CAC, and churn. Executives don't need activity data. They need outcome data and trend lines that tell them whether the business is healthy. (If forecasting is the pain point, look at sales forecasting solutions.)
Pipeline Dashboards
Opportunities by stage, deal size distribution, weighted probability, expected close dates, and slippage risk flags. This is the dashboard that catches deals going dark before they officially die - and in our experience, it's the one most teams build last when it should be built first. If your team keeps missing, you’re probably dealing with sales pipeline challenges.
How AI Is Changing Sales KPIs in 2026
Traditional activity KPIs - calls made, emails sent, meetings booked - were designed for a world where humans did all the work. That world is disappearing fast. Gartner projects that by 2028, AI will close 70% of sales cycles by automating prospecting, qualification, and negotiations. By 2031, 35% of sales orgs will introduce EQ-related productivity metrics because the mechanical work will be handled by machines.
Organizations using AI forecasting report 15-20% higher forecast accuracy, 25% shorter sales cycles, and up to 30% improvement in quota attainment. Legacy forecasting rarely exceeded 60-70% accuracy. Leading orgs now hit 90%+ for 30-90 day forecasts.
So what replaces activity KPIs? New categories are emerging: deal acceleration impact (how much did AI shorten this cycle?), buyer engagement quality (are stakeholders actually engaging, not just opening emails?), objection resolution effectiveness, and stakeholder alignment success. These measure the human judgment that AI can't replicate - yet.
Let's be honest about what this means for sales teams right now. Activity KPIs in 2026 measure your software stack, not your reps. The teams that figure this out first will build dashboards around outcomes and judgment quality while their competitors are still celebrating email volume.
FAQ
How many sales KPIs should I track?
Five to seven per dashboard view. Start with pipeline coverage, win rate, average deal size, sales cycle length, and quota attainment. Add SaaS-specific metrics like NRR and CAC payback if they're relevant to your model. Cut everything that doesn't change what you do next.
What's the difference between KPIs and metrics?
A KPI is a metric tied to a specific goal with a target attached. "Emails sent" is a metric. "Emails sent per qualified meeting booked" becomes a KPI when you set a target ratio and review it weekly. Metrics inform. KPIs drive action.
How often should I review them?
Activity KPIs daily, pipeline KPIs weekly, revenue and retention KPIs monthly, strategic KPIs like CAC and LTV:CAC quarterly. Match review frequency to how quickly you can intervene - daily reviews for daily-actionable numbers, quarterly reviews for numbers that shift slowly.
What are the most important KPIs for SaaS sales?
MRR/ARR, net revenue retention, CAC payback period, and churn rate - layered on top of pipeline coverage and win rate. NRR above 100% is the single best indicator of long-term SaaS health because it proves you grow even without new logos.
How does bad contact data affect sales KPIs?
Every downstream KPI - conversion rate, pipeline velocity, cost per opportunity - is only as accurate as the emails and phone numbers feeding your pipeline. If your bounce rate is above 5%, your dashboard is lying to you. Fixing the data source fixes the metrics.