Sales Pipeline Conversion Rate: 2026 Benchmarks & Guide
Only 16% of reps hit quota. Average sales cycles have ballooned to 6.5 months, and buying committees now average 25 stakeholders per deal - up from 16 in 2017. If you can't diagnose where your sales pipeline conversion rate breaks down stage by stage, you can't fix your forecast.
Your overall conversion rate is the least useful pipeline number you track. Stage-by-stage is what's actually diagnostic. Most teams overestimate conversion because they use snapshot-period math instead of cohorts, and the benchmarks below break down by industry, segment, and channel so you can contextualize your own numbers against something real.
What Is Pipeline Conversion Rate?
Pipeline conversion rate measures the percentage of opportunities that advance from one stage to the next - or from entry to closed-won:
Conversion Rate = (Conversions / Total Opportunities) x 100
If 200 SQLs enter your pipeline in Q1 and 50 close, that's a 25% SQL-to-closed-won rate. Simple enough. But the overall lead-to-customer number is a lagging indicator. It tells you something happened, not where. Stage-by-stage conversion pinpoints the exact joint in your pipeline that's leaking revenue, which is why we always push teams to stop obsessing over the top-line number and start reading the stage transitions.
2026 Benchmarks by Industry and Segment
By Industry
These sales pipeline benchmarks from First Page Sage draw from data gathered across 2017-2025, skewing roughly 65% B2B:
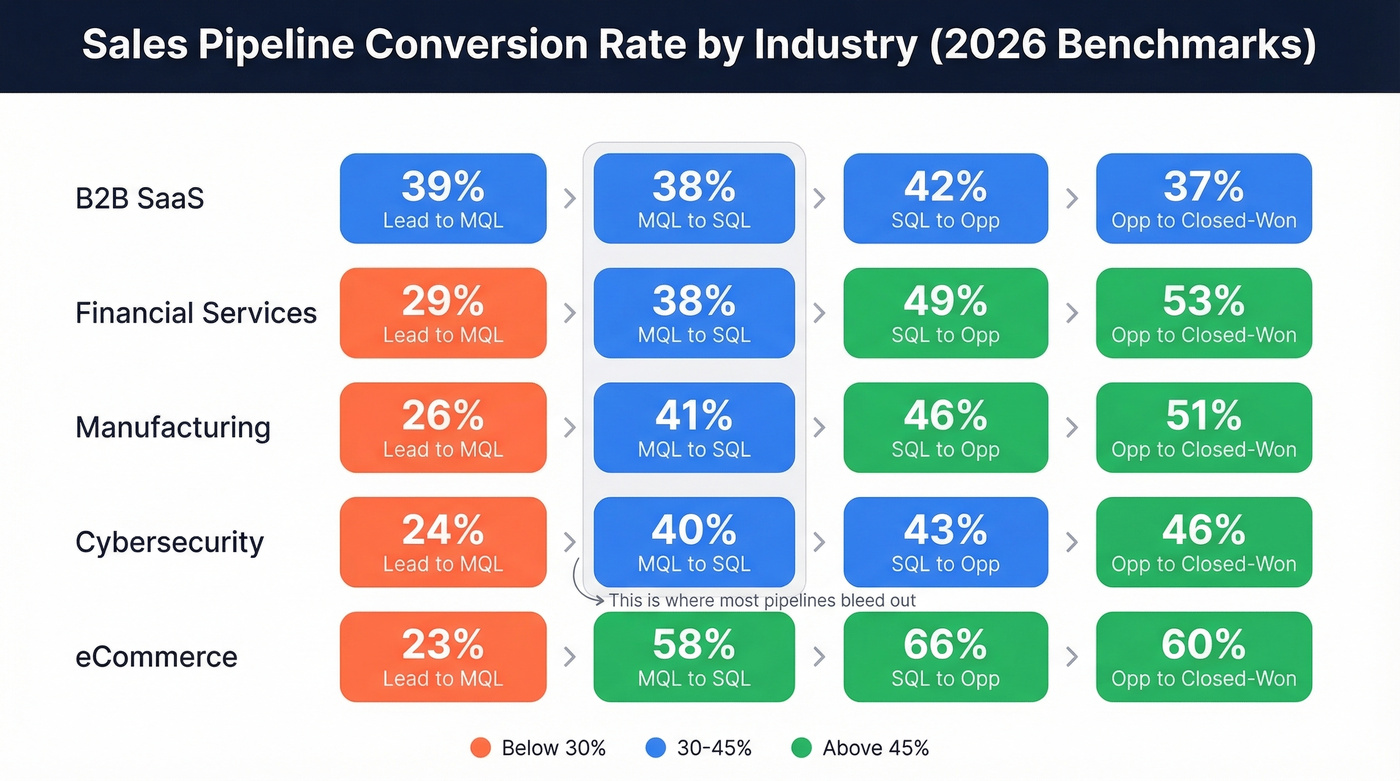
| Industry | Lead to MQL | MQL to SQL | SQL to Opp | Opp to Closed-Won |
|---|---|---|---|---|
| B2B SaaS | 39% | 38% | 42% | 37% |
| Financial Services | 29% | 38% | 49% | 53% |
| Manufacturing | 26% | 41% | 46% | 51% |
| Cybersecurity | 24% | 40% | 43% | 46% |
| eCommerce | 23% | 58% | 66% | 60% |
MQL to SQL is typically where pipelines bleed out. The handoff from marketing to sales qualification is where alignment breaks down, and it's the stage we've seen cause the most finger-pointing in pipeline reviews. eCommerce is an outlier here, with much higher mid-to-late-stage conversion rates because purchase decisions involve fewer stakeholders and shorter cycles.
For outbound-specific funnels, the numbers look different. Belkins reports discovery-to-ICP/trial at 36% and ICP/trial-to-closed-won at just 16% - significantly lower than inbound benchmarks because outbound starts with colder prospects.
SMB vs. Enterprise
Data from Digital Bloom's pipeline benchmarks shows a consistent gap:
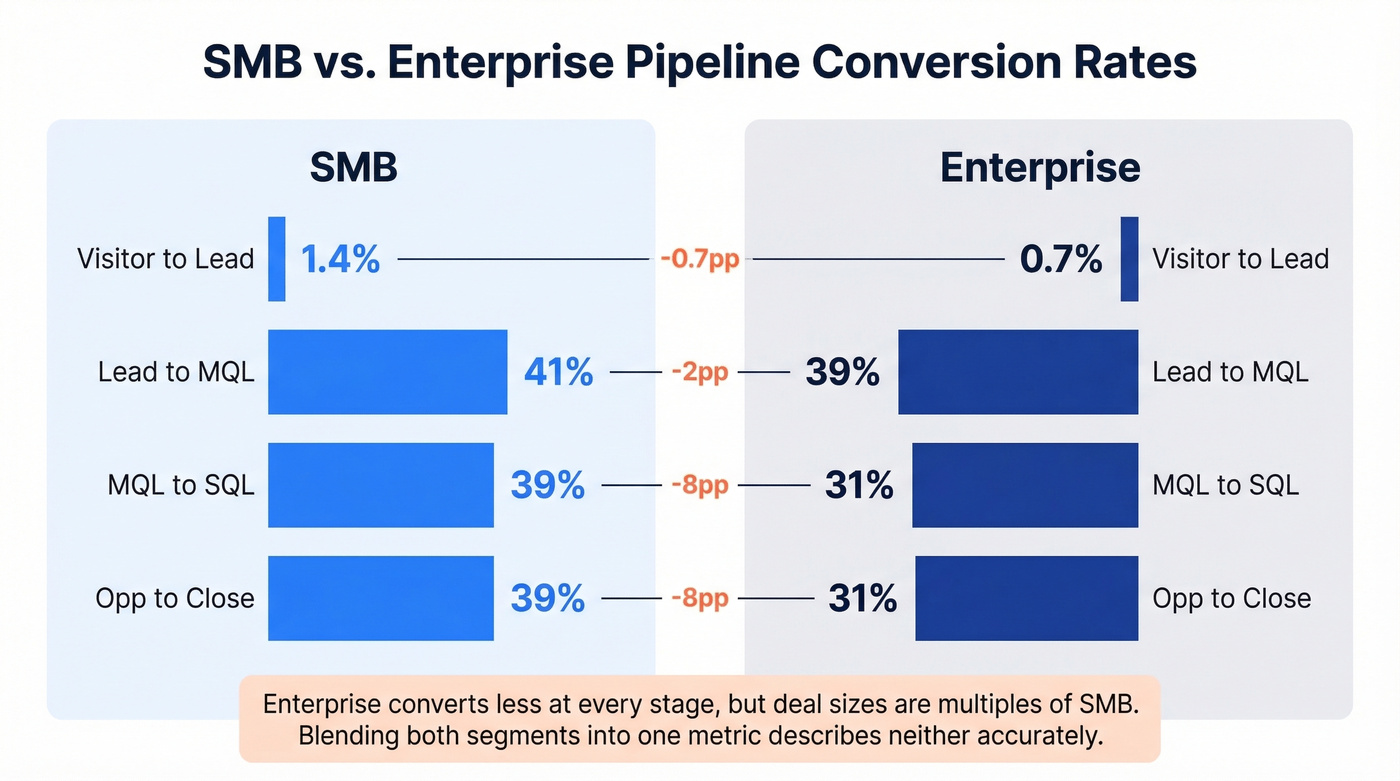
| Segment | Visitor to Lead | Lead to MQL | MQL to SQL | Opp to Close |
|---|---|---|---|---|
| SMB | 1.4% | 41% | 39% | 39% |
| Enterprise | 0.7% | 39% | 31% | 31% |
Enterprise converts less at every stage. That's not a problem - it's the nature of larger deals with more stakeholders and longer cycles. The math works because enterprise deal sizes are multiples of SMB. But if you're blending both segments into one conversion metric, you're getting a number that describes neither accurately.
By Channel
| Channel | Visitor to Lead | MQL to SQL | Opp to Close |
|---|---|---|---|
| SEO | 2.1% | 51% | 38% |
| Webinars | 2.2% | 30% | 33% |
| PPC | 0.7% | 26% | 35% |
| 1.8% | 46% | 32% | |
| Events | 1.0% | 24% | 40% |
SEO and email generate the highest-quality pipeline by MQL-to-SQL conversion. Events close best because in-person interactions build trust faster. PPC brings volume but the weakest qualification rates.
If you're not segmenting by channel, your blended rate is meaningless.
Bad data inflates your denominator without converting. When 35% of emails bounce, every stage-by-stage metric is lying to you. Prospeo's 98% email accuracy and 7-day refresh cycle mean the leads in your pipeline are real people you can actually reach.
Stop measuring conversion rates polluted by stale, undeliverable contacts.
How to Measure Conversion Correctly
Getting the formula right matters less than getting the methodology right. Let's break down the four practices that separate useful pipeline data from noise.
Use Cohort-Based Reporting
Group opportunities by the period they were created, then track outcomes over time. A 90-day cohort window is a common standard for a realistic report.
This is also where funnel metrics and stage definitions matter: if your stage entry criteria are fuzzy, your cohort report will be too.
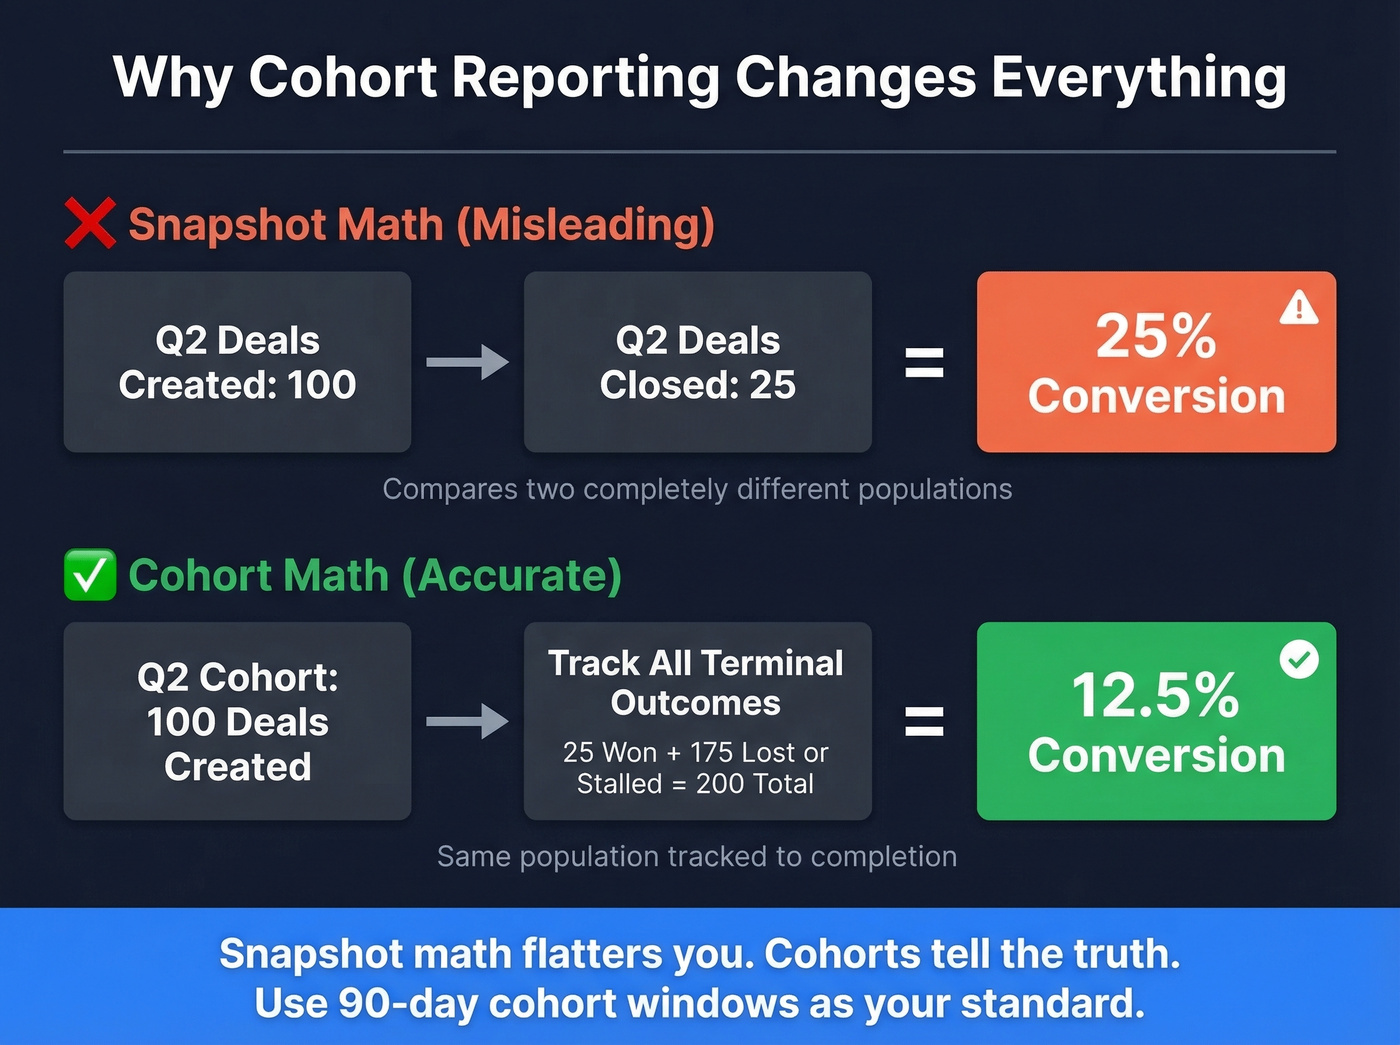
Without cohorts, you're comparing deals created in Q2 against deals that closed in Q2 - two completely different populations. In one real-world example, 100 deals created in Q2 with 25 closed looks like 25% conversion. But when you count all deals that reached a terminal outcome in Q2, the denominator jumps to 200, cutting the "real" rate to 12.5%.
Take a Day-3 Quarterly Snapshot
Battery Ventures recommends snapping your pipeline on day three of each new quarter, after end-of-quarter cleanup has settled. This gives you a clean starting number for board-level reporting and avoids the distortion of last-minute deal shuffling.
If you're trying to tie this back to forecasting, align it with your sales operations metrics so the board view and the rep view reconcile.
Track IQCC Separately
In-Quarter Create and Close captures deals with sub-90-day cycles that won't appear in your starting pipeline snapshot. If a meaningful chunk of your revenue comes from fast-closing deals created and closed inside the quarter, IQCC keeps your conversion math honest. Skip this if your average sales cycle is 4+ months - it won't move the needle for you.
Pick the Right Denominator
Use won / (won + lost) as your denominator. Both won and lost deals were qualified by default because they progressed far enough to reach a terminal outcome, which sidesteps the endless debate about what "qualified" means. Pair stage conversion with time-in-stage - a deal sitting in "proposal sent" for 45 days isn't converting, it's stuck.
This is the same logic behind a clean sales conversion rate definition: observable outcomes beat subjective labels.
Measurement Mistakes That Distort Your Numbers
Snapshot vs. cohort bias. A practitioner on r/SalesOperations laid this out perfectly: 100 deals created in Q2 with 25 closed looks like 25% conversion, but count all deals that reached a terminal outcome in Q2 and the denominator jumps to 200. Your real rate is 12.5%. Snapshot math flatters you. Cohorts tell the truth.
Undefined denominators. "Qualified leads" means something different to marketing, sales, and finance. In our experience, the denominator debate wastes more pipeline review time than any other topic. Pick a concrete, observable denominator - like pipeline stage entry - and stick with it across teams.
Not segmenting. A blended conversion rate across SMB inbound, enterprise outbound, and partner referrals tells you nothing actionable. Segment by channel, deal size, rep, and customer segment. Every time.
Optimizing one stage in isolation. Geckoboard's analysis nails this: you can boost MQL-to-SQL conversion by loosening qualification criteria, but all you've done is push unqualified deals deeper into the funnel. Always check what happens downstream when you "improve" one stage.
How to Improve Pipeline Conversion
Here's the thing: you can't improve what you're measuring wrong. Implement cohorts, define your denominators, and segment your data first. This alone often reveals that your "conversion problem" is actually a measurement problem.
If you want a structured way to pressure-test each stage, map it to a lead generation workflow so you can see where handoffs break.
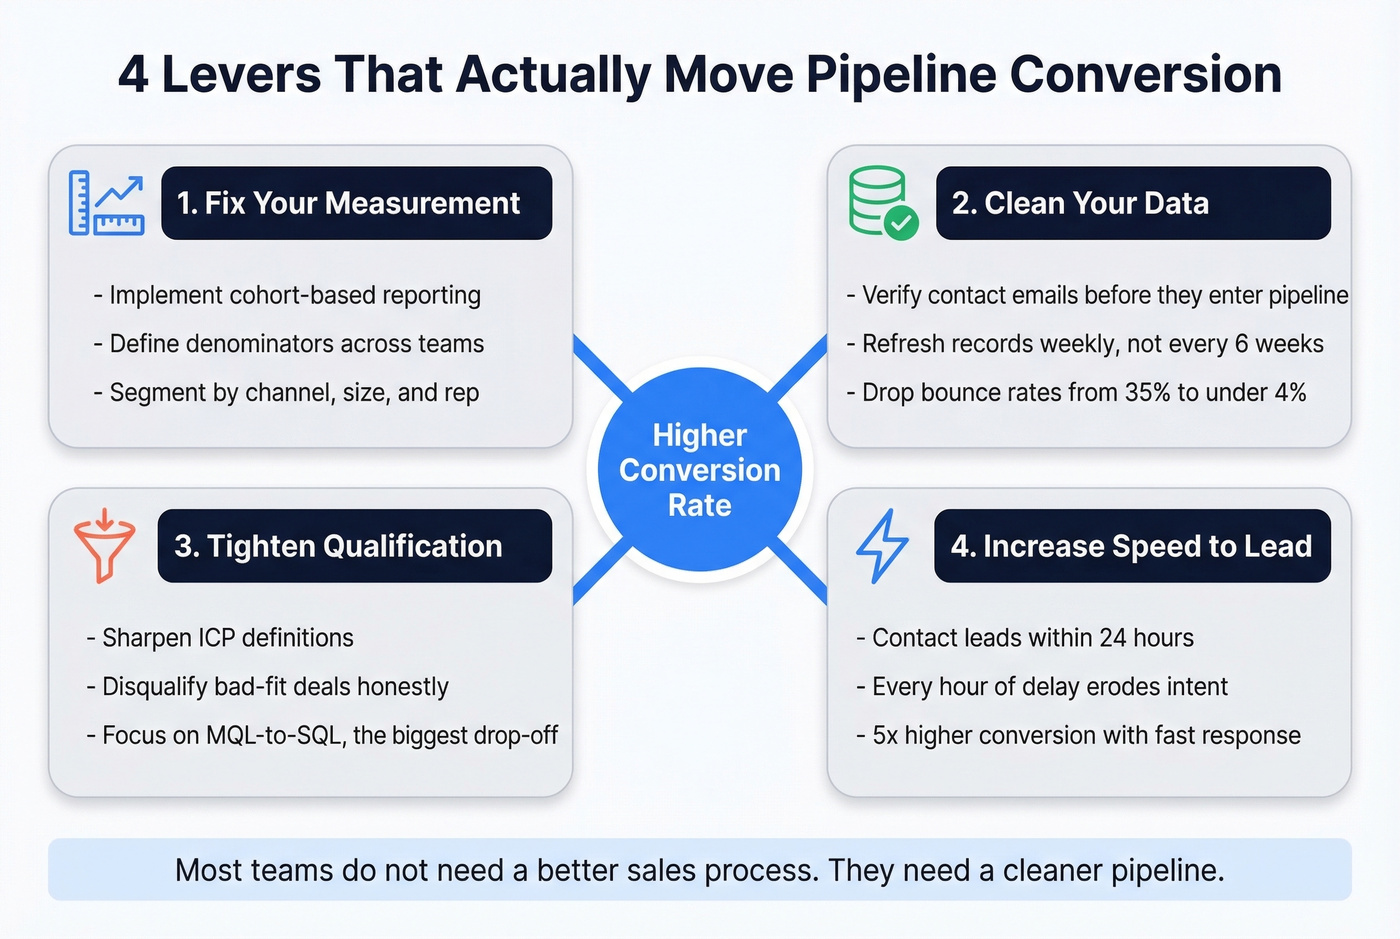
Most teams don't need a better sales process - they need a cleaner pipeline. If your contact database is full of stale emails and disconnected numbers, those leads inflate your denominator without ever converting. One team we spoke with, Meritt, saw bounce rates drop from 35% to under 4% after switching to Prospeo for verified contact data, and their pipeline finally reflected reachable prospects instead of dead-end contacts dragging down every metric.
Tighten discovery and qualification rigor. The biggest conversion drop typically happens at MQL-to-SQL - that's a qualification problem, not a closing problem. Better ICP definitions and honest disqualification of bad-fit deals will compress your pipeline but improve every downstream rate. For teams running outbound, starting with accurate data means your reps spend time on real conversations instead of chasing bounced emails and voicemails.
If you need a concrete framework for qualification, start with a simple lead scoring model tied to stage entry/exit criteria.
MarketJoy's data shows contacting leads within 24 hours increases conversion by 5x. Every hour of delay erodes intent. Speed is the cheapest lever you have, and it costs nothing to implement.
Finally, run weekly stage-by-stage pipeline reviews. Not pipeline inspection theater - actual analysis of where deals are stuck and why. Only 7% of sales teams achieve greater than 90% forecast accuracy, but companies with accurate forecasts are 10% more likely to grow revenue year-over-year and 7.3% more likely to hit quota. The discipline compounds fast.
To make those reviews actionable, track pipeline health alongside conversion so you can separate "stuck" from "lost."
Enterprise pipelines bleed at MQL-to-SQL because reps waste hours chasing outdated contacts. Prospeo gives you 300M+ verified profiles with 30+ filters - buyer intent, job changes, headcount growth - so every opportunity that enters your pipeline has a real path to closed-won.
Fill your pipeline with contacts that actually convert, starting at $0.01 per email.
FAQ
What's a good sales pipeline conversion rate?
B2B SaaS averages roughly 37% SQL-to-closed-won; financial services hits around 53%. Overall lead-to-customer typically falls between 2-5%. Always use stage-by-stage rates - the blended figure hides exactly where your pipeline breaks down.
How often should you measure pipeline conversion?
Monthly using 90-day cohorts gives the most actionable view. Take a clean pipeline snapshot on day three of each quarter for board reporting, and track IQCC separately for deals with sub-90-day cycles.
What's the difference between pipeline conversion rate and win rate?
Win rate measures closed-won / (closed-won + closed-lost) - only terminal outcomes count. Pipeline conversion rate covers any stage-to-stage progression, including earlier funnel stages like lead-to-MQL. Win rate is a subset focused exclusively on the finish line.
How does data quality affect conversion rates?
Bad contact data inflates your pipeline denominator with unreachable prospects, artificially suppressing conversion rates at every stage. Teams using verified data sources that refresh records weekly - rather than the industry-standard six-week cycle - routinely see bounce rates drop below 4%, giving them a pipeline that reflects actual selling opportunities instead of phantom leads.