Sales Pipeline Reporting: Benchmarks, Formulas, and the Mistakes Killing Your Forecast
It's Thursday afternoon. The board deck is due Monday. Your VP pulls up the pipeline report, and the number looks fine - until someone asks which deals are actually closing this quarter. Silence. That's not a surprise: 79% of sales organizations miss their forecast by more than 10%, per Forrester. The pipeline reporting said everything was on track. The reporting was wrong.
Here's what's frustrating: implementing a CRM leads to an average 29% increase in sales, but only when the data inside it is accurate and the reports built on top of it drive real decisions. Most teams have the CRM. They just aren't using it right.
This is the practitioner's guide to fixing what goes into your pipeline report, how it's read, and what happens after the meeting ends.
What Is a Pipeline Report?
A pipeline report tracks, visualizes, and analyzes every open deal across your revenue funnel - by stage, value, velocity, and health. It's a real-time snapshot of where your money is sitting and whether it's moving.
The distinction that trips people up: reporting isn't forecasting. Reporting tells you what's in the pipe right now. Forecasting predicts what will close. One is a photograph; the other is a weather prediction. You need the photograph to be accurate before the prediction has any chance.
Pipeline reporting also isn't a CRM dashboard you glance at once a week. It's an operational discipline - a set of metrics, reviewed at a consistent cadence, that drives decisions about where to coach, where to invest, and where to cut losses.
What You Need (Quick Version)
- Track 5 metrics, not 15. More dashboards don't mean better visibility. They mean more noise.
- Your coverage ratio depends on your win rate - not some universal "3x rule." Do the math for your business.
- Benchmarks exist. Median B2B sales cycle is 84 days. Typical win rate is 20-30%. Use these as baselines, not gospel.
- Pipeline reviews are coaching sessions, not status updates. If your manager is just reading CRM fields aloud, you're wasting everyone's time.
- Fix your data before you fix your dashboards. A beautiful report built on decayed contacts is just a beautiful lie.
Metrics That Actually Matter
Most teams track too many things and act on too few. Salesforce's own guidance recommends 3-4 metrics per goal. Here are the eight that cover the full picture - pick the subset that matches your operating rhythm.
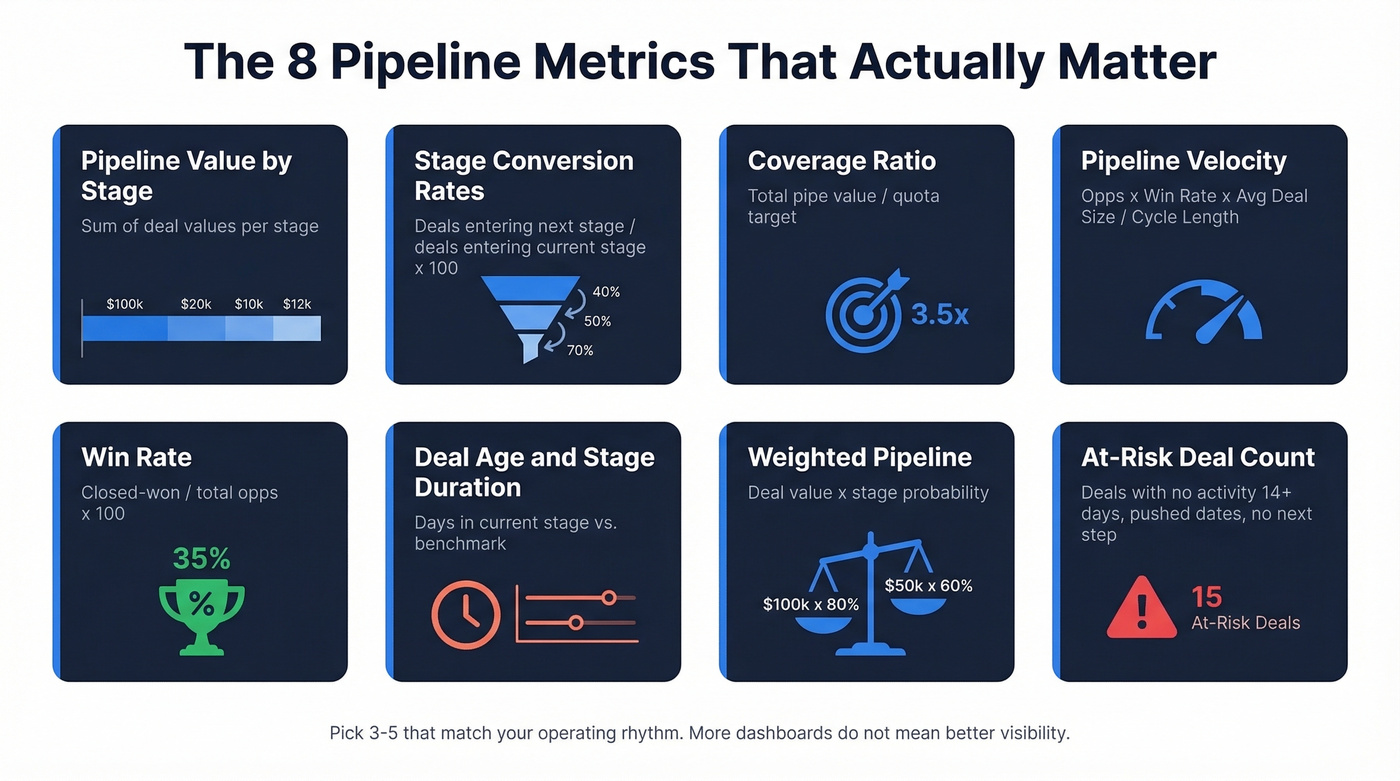
Pipeline Value by Stage
Total dollar value of open deals, broken out by stage. This is the foundation. Sum deal values per stage. If you've got $2M in Discovery and $400K in Negotiation, you know where the weight sits - and where it needs to move.
Stage Conversion Rates
Percentage of deals advancing from one stage to the next. Divide deals entering the next stage by deals entering the current stage, multiply by 100. If 50 deals enter Demo and 20 make it to Proposal, that's a 40% conversion rate. Track this monthly - it's the earliest signal that something in your process is breaking.
Pipeline Coverage Ratio
Total pipeline value divided by quota target. A $500K pipe against a $200K target gives you 2.5x coverage. We'll dig into why the "3x rule" is misleading shortly.
Pipeline Velocity
The metric most teams skip and shouldn't. Multiply the number of opportunities by your win rate and average deal size, then divide by average sales cycle length. With 100 opps, a 25% win rate, $10K average deal, and a 60-day cycle, your velocity is $4,167/day.
Typical B2B velocity runs $743-$2,456/day depending on segment.
Win Rate
Closed-won deals divided by total opportunities created, times 100. Simple, but watch the denominator. Are you counting every deal that touched your CRM, or only qualified opportunities? Define it once and don't change it.
Deal Age and Stage Duration
How long deals sit in each stage. Set benchmarks per stage - if your average Proposal-to-Negotiation time is 12 days and a deal has been sitting for 30, it's stalled. Flag it or kill it.
Weighted Pipeline Value
Each deal's value multiplied by its stage probability. A $100K deal at 30% probability contributes $30K weighted. More useful than raw pipeline value, but only if your stage probabilities reflect reality - not wishful thinking.
At-Risk Deal Count
Deals matching risk patterns: no activity in 14+ days, pushed close dates, missing decision-maker engagement, or no clear next step. Track the count weekly. If it's growing, your forecast is in trouble.
| Metric | Formula | Good Looks Like |
|---|---|---|
| Coverage Ratio | Pipe value / quota | 2-5x (segment-dependent) |
| Win Rate | Won / total opps | 20-30% |
| Velocity | Opps x WR x ADS / cycle | $743-$2,456/day |
| Stage Conversion | Next stage / current | 30-45% per stage |
| Median Cycle | Days from opp to close | 46-84 days |
2026 Benchmarks Worth Knowing
Benchmarks are the single biggest gap in most pipeline guides. Everyone tells you to "track conversion rates" but nobody tells you what the numbers should be.
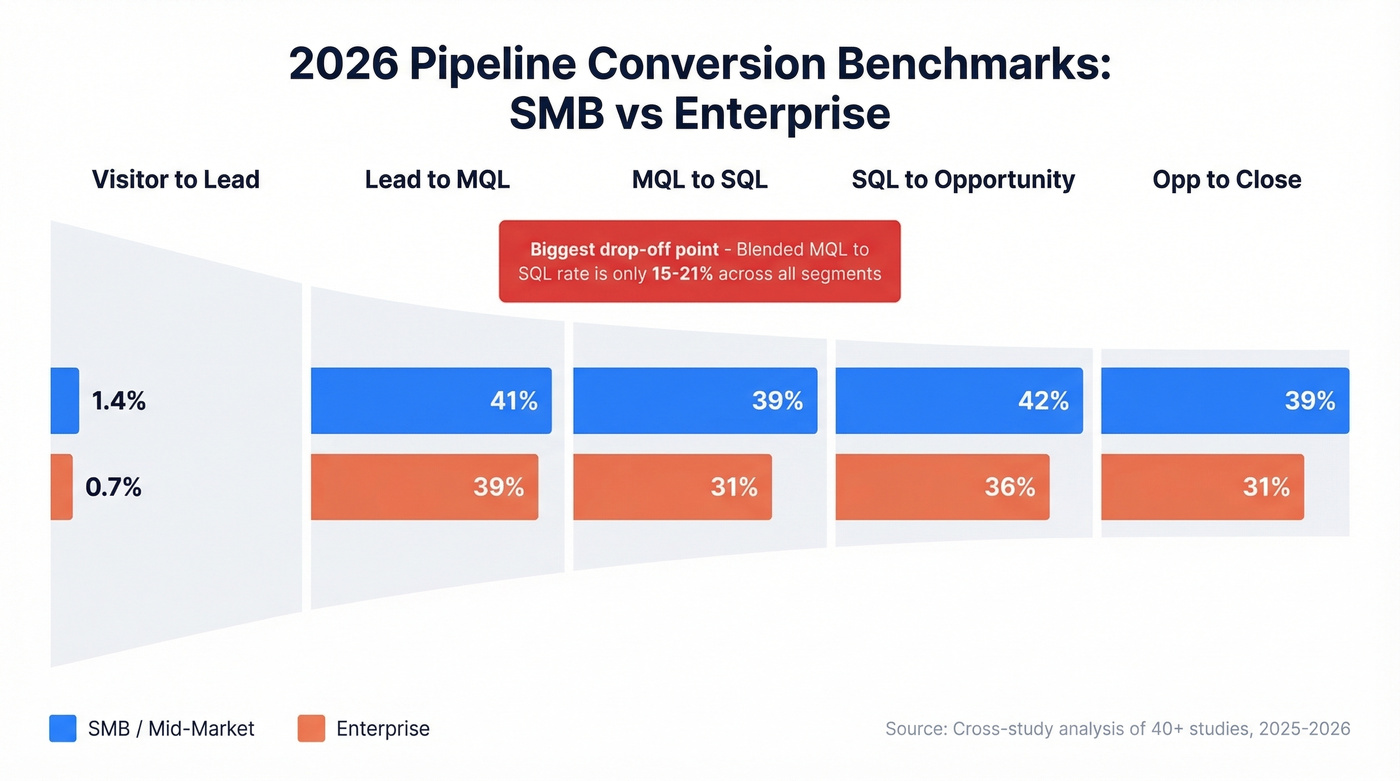
Stage-by-stage conversion rates vary dramatically by segment. The most recent cross-study analysis, covering 40+ studies, found these rates:
| Stage | SMB / Mid-Market | Enterprise |
|---|---|---|
| Visitor to Lead | 1.4% | 0.7% |
| Lead to MQL | 41% | 39% |
| MQL to SQL | 39% | 31% |
| SQL to Opportunity | 42% | 36% |
| Opp to Close | 39% | 31% |
The MQL-to-SQL handoff is consistently the steepest drop-off across segments. Those segment-specific rates above look healthy, but blended across all company sizes and industries, the overall MQL-to-SQL rate falls to just 15-21%. If you're going to obsess over one conversion point, make it that one.
Channel performance matters too. Not all pipeline sources convert equally:
| Channel | Visitor to Lead | MQL to SQL | Opp to Close |
|---|---|---|---|
| SEO | 2.1% | 51% | 38% |
| PPC | 0.7% | 26% | 35% |
| Events | 1.0% | 24% | 40% |
SEO leads convert to SQL at nearly double the rate of PPC leads. Events produce fewer leads but close at the highest rate. If your pipeline report doesn't segment by source, you're averaging away the signal.
Broader benchmarks worth pinning up: median sales cycle of 84 days with an optimal range of 46-75, typical win rate of 20-30%, and lead-to-customer conversion of 2-5%. Sales cycles have lengthened roughly 32% since 2021, so if yours feels slower, that's the market - not just your team.
Let's be honest: if your average deal is under $15K ACV, you probably don't need enterprise-grade pipeline analytics. A clean CRM with honest stage definitions will outperform a $50K/year revenue intelligence platform running on dirty data every single time.
You just read it: a beautiful report built on decayed contacts is a beautiful lie. Prospeo refreshes 300M+ profiles every 7 days - not the 6-week industry average - so your pipeline stages reflect real, reachable buyers. 98% email accuracy means your coverage ratio counts deals attached to valid contacts, not dead ends.
Stop forecasting on data that expired three weeks ago.
Coverage Ratio: Why "3x" Is Wrong
Every sales leader has a coverage ratio target, and half of them are using the wrong number.
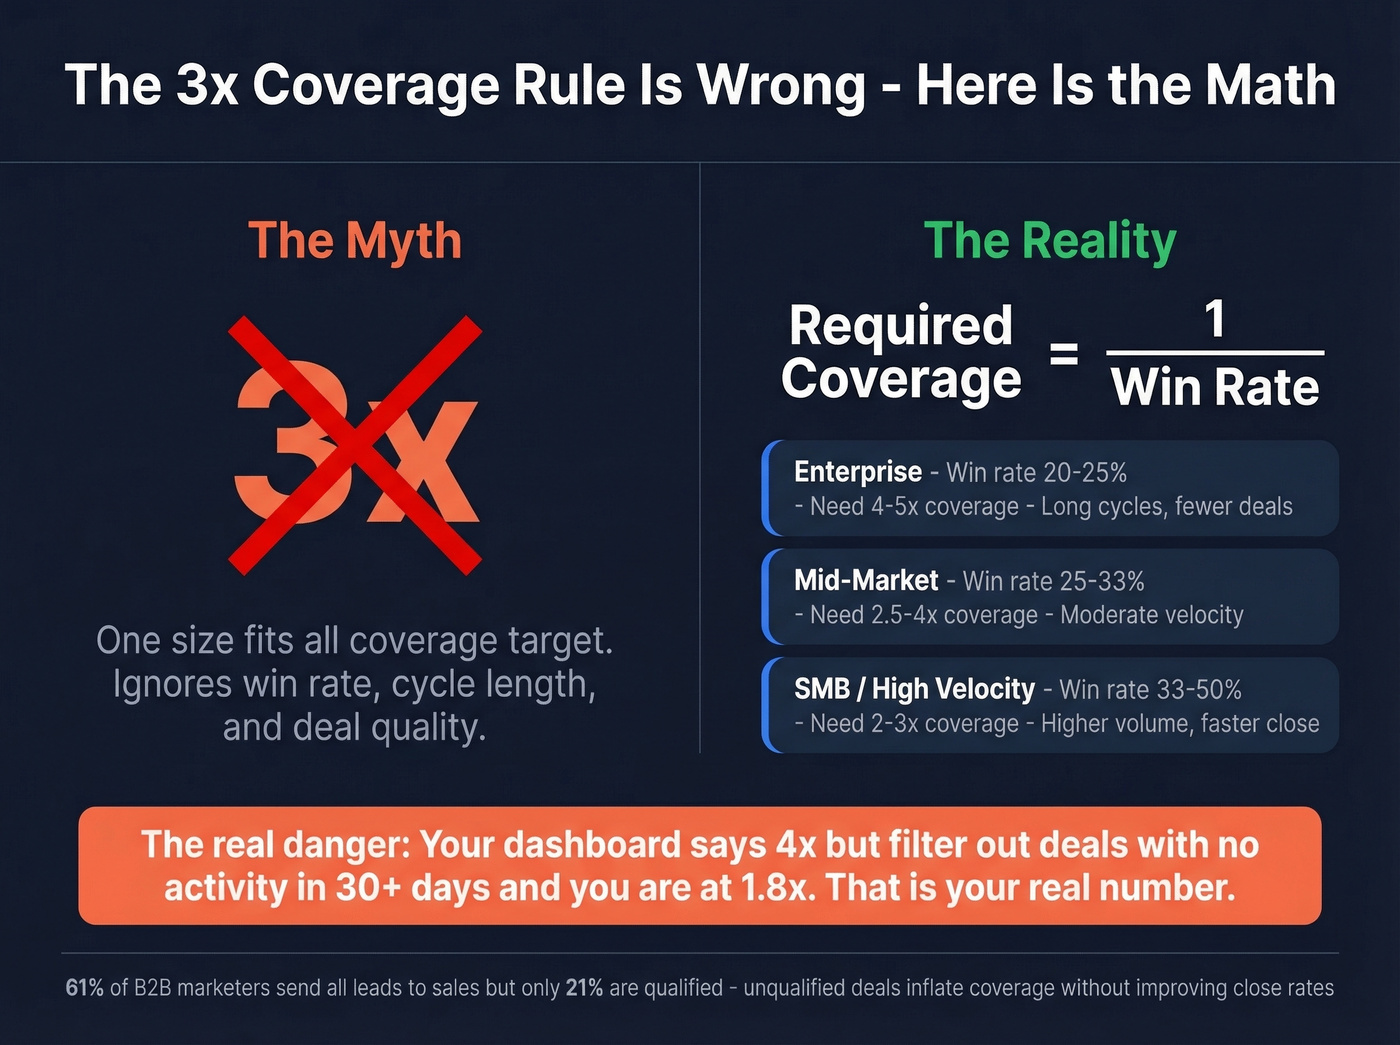
The "3x pipeline coverage" rule gets thrown around like it's physics. It's not. Your ideal ratio depends on several factors: win rate, sales cycle length, deal size concentration risk, and lead source quality. If you close 25% of opportunities, you need 4x coverage just to break even. Close 40%? Then 2.5x is plenty.
| Segment | Typical Coverage | Why |
|---|---|---|
| Enterprise | 3-5x | Long cycles, fewer deals |
| Mid-Market | 2.5-4x | Moderate velocity |
| SMB / High-Velocity | 2-3x | Higher volume, faster close |
The real danger isn't a low ratio - it's a fake high one. Your dashboard says 4x, but filter out deals with no activity in 30+ days and you're at 1.8x. That's your real number. 61% of B2B marketers send all leads to sales, but only 21% are qualified. Unqualified deals inflate coverage without improving close rates.
Pipeline shape matters as much as size. A top-heavy pipeline - lots of early-stage deals, little late-stage - means you have a progression problem. A bottom-heavy pipeline means you have a prospecting problem. Shape tells you where to focus before the numbers do. We've seen teams obsess over total coverage while ignoring that 80% of their pipe was stuck in Discovery. That wasn't a coverage problem; it was a qualification problem.
One more data point: when Gradient Works studied account coverage, they found that reducing rep books to 300-400 accounts and focusing coverage pushed win rates from 13% to over 20%. More pipe isn't always the answer. Better-covered pipe is.
Belkins publicly operates at a 10x coverage ratio. That's one company's practice, not an industry benchmark. If someone tells you to target 10x, ask them what their win rate is.
Role-Based Report Views
Not everyone needs the same view. A rep staring at an executive dashboard is wasting time. An exec drilling into individual deal notes is micromanaging. Build three views.
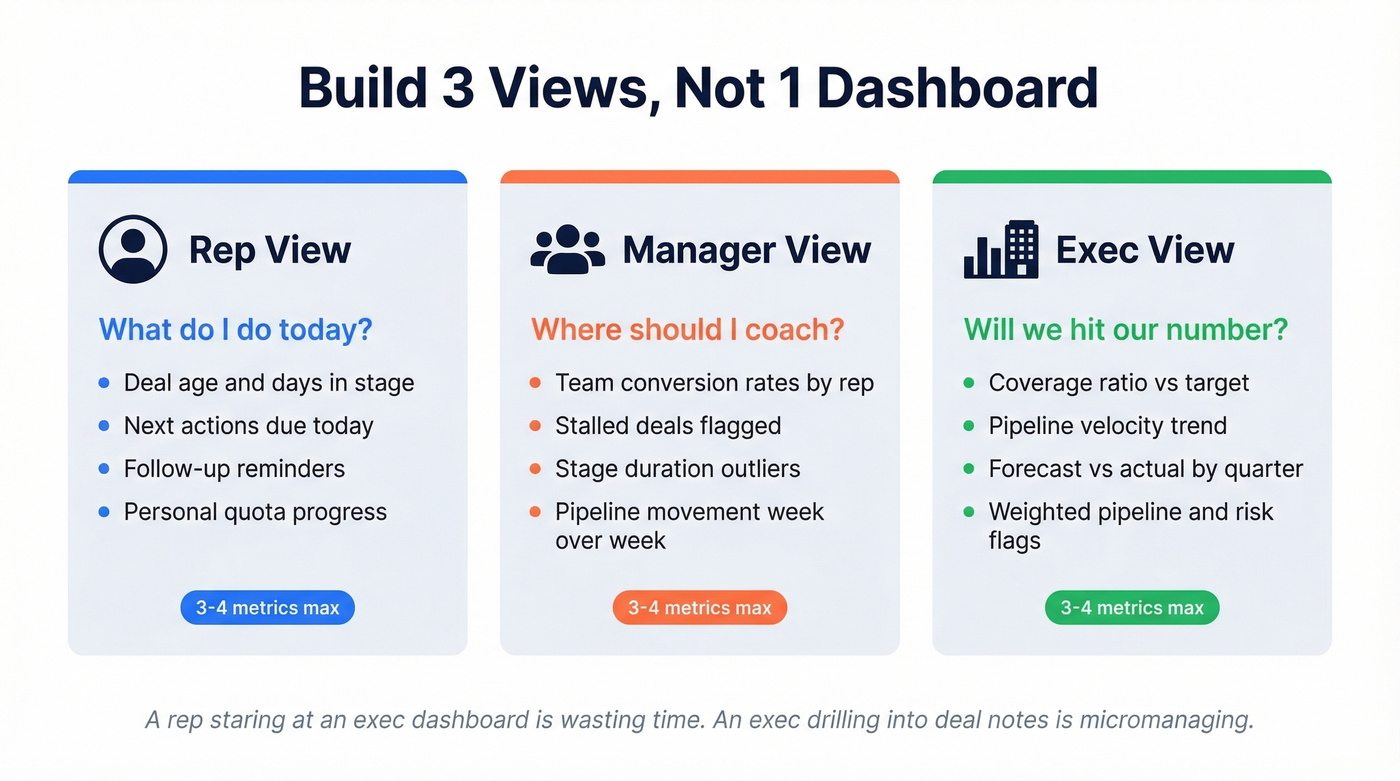
Rep view - "What do I do today?" Show deal age, next actions due, follow-up reminders, and quota progress. Skip the trend charts. Reps need a task list, not a strategy deck.
Manager view - "Where should I coach?" Show team-level conversion rates, rep comparisons, stalled deals, and stage duration outliers. The manager's job is pattern recognition - which reps are stuck, which stages are leaking, where coaching will move the number. A pipeline movement report tracking how deals advance, stall, or regress between stages each week gives managers the clearest view of where coaching is needed most.
Exec view - "Will we hit our number?" Show coverage ratio, pipeline velocity, forecast vs. actual trend, and weighted pipeline by quarter. Execs don't need deal-level detail. They need confidence intervals and risk flags. A pipeline created report showing new opportunities added per week or month helps execs gauge whether the top of the funnel is keeping pace with targets.
Keep each view to 3-4 metrics. More than that and nobody looks at any of them.
10 Pipeline Reporting Mistakes (And Fixes)
- Vague next steps. "Follow up" isn't a next step - it's a prayer. Every deal needs a mutual, calendarized action with a named buyer owner. (If you need a starting point, use proven follow-up templates instead of improvising.)
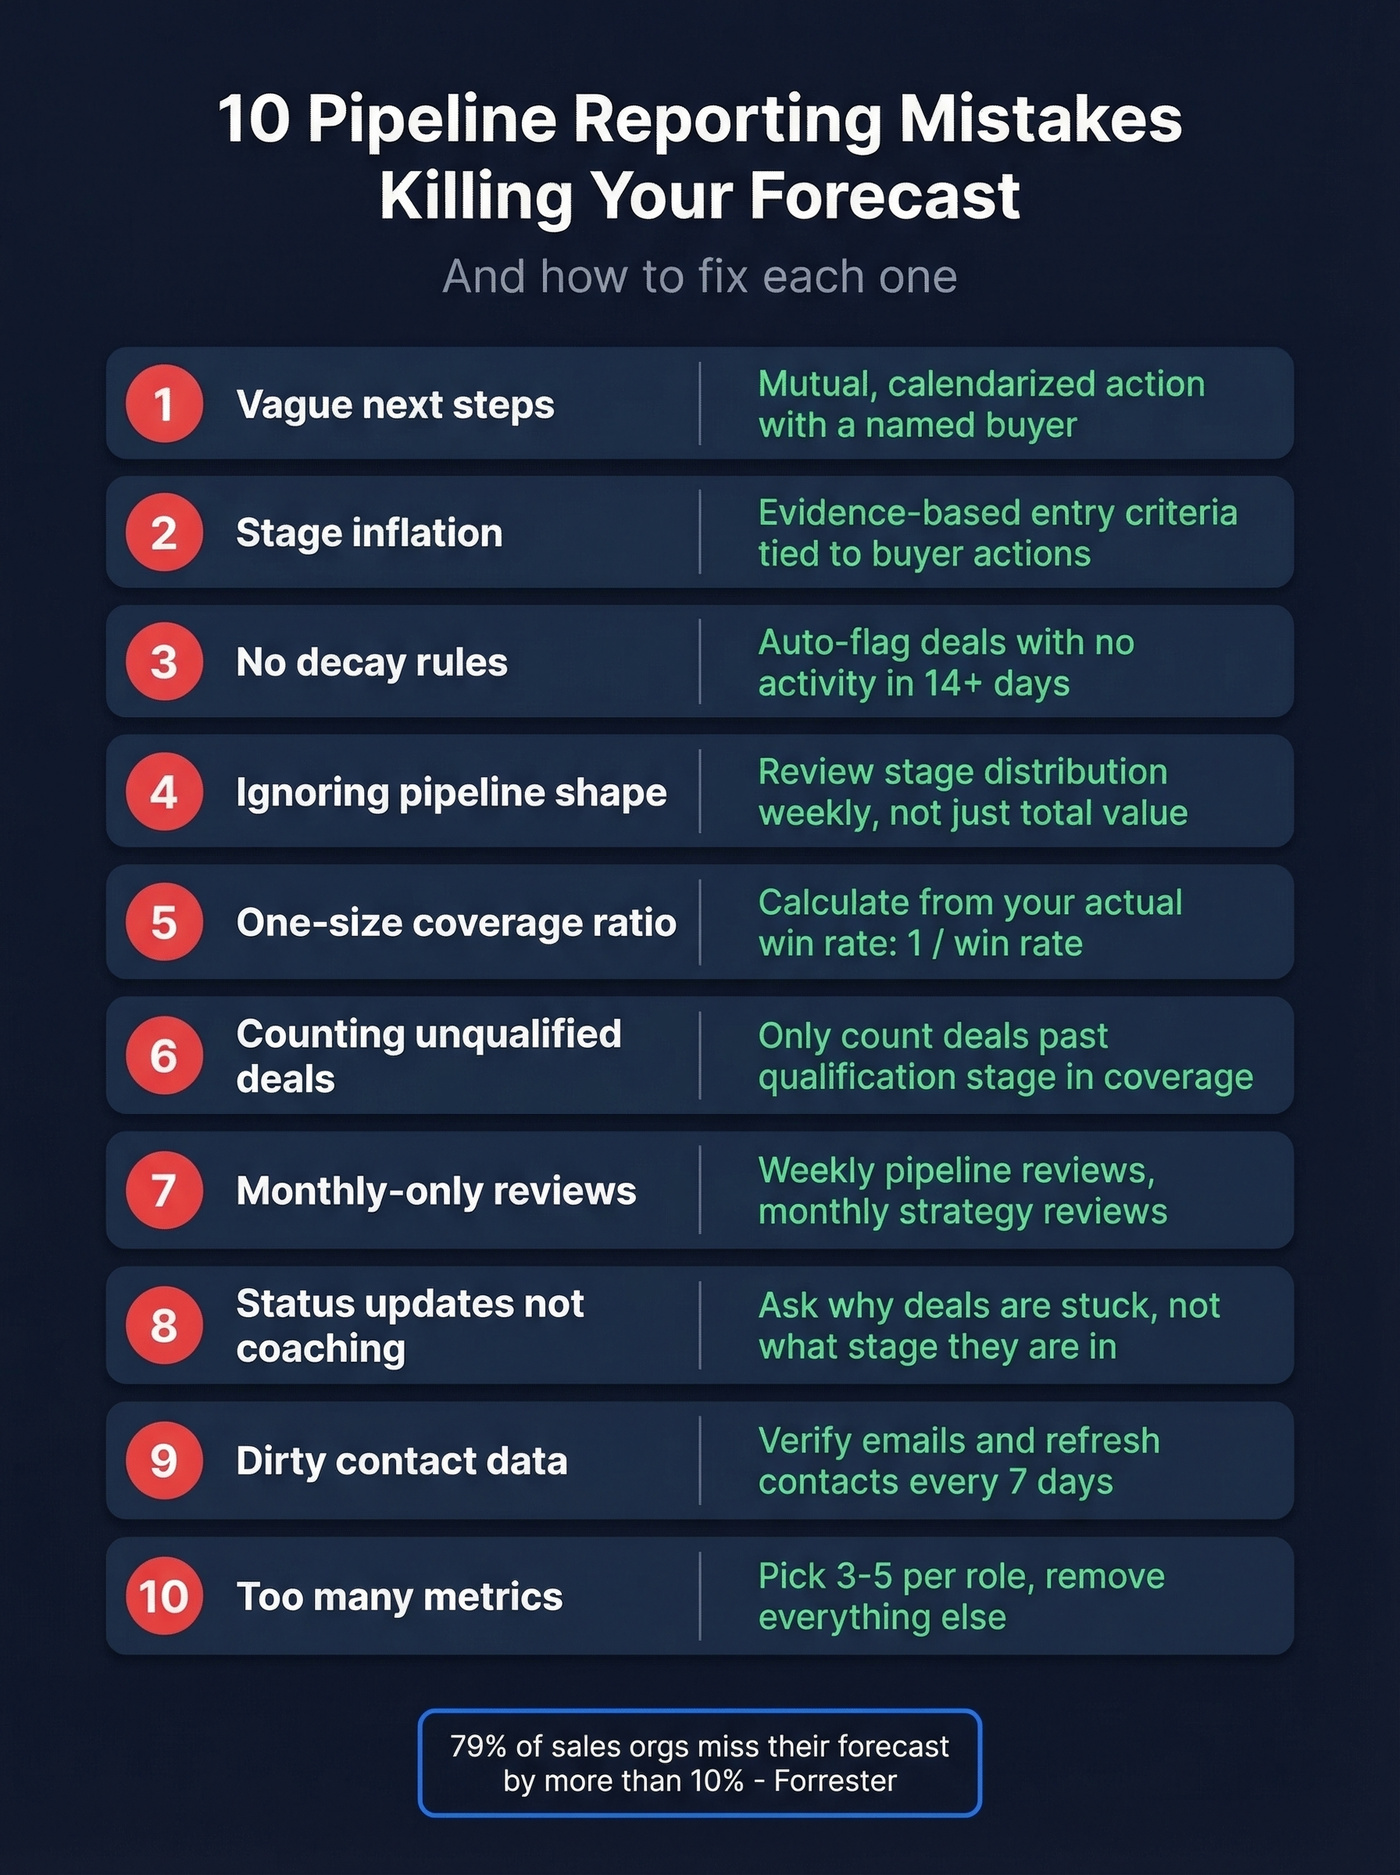
Stage inflation. Reps push deals forward to make dashboards look green. Fix it with evidence-based entry criteria - max five per stage, tied to buyer actions, not rep activities.
Hope-based close dates. If the close date isn't tied to a compelling event or buyer commitment, it's fiction. Require justification for every date.
Keeping stale deals open. No activity for 14-30 days and no mutual next step? Park it or close it. Your coverage ratio will drop, and that's the point - now you're seeing reality. We've seen teams cut stale-deal count dramatically just by enforcing a 14-day activity rule. The forecast got worse on paper and dramatically better in accuracy.
Measuring activity instead of progression. Calls made and emails sent don't tell you if deals are moving. Track days in stage, stage-to-stage conversion, and slip rate instead. (More examples: sales activities that actually correlate with progression.)
Treating CRM as admin. Late updates, thin notes, inconsistent fields. If reps see the CRM as paperwork rather than a selling tool, your reports are built on stale data. And 97% of revenue leaders say better data would improve their forecast accuracy - so this isn't a minor annoyance, it's the root cause. (If your stack is messy, start with solid contact management software.)
Pipeline reviews that inspect but don't coach. Reading deal fields aloud isn't a review. Ask "What do we know vs. assume?" and "What's the next buyer commitment?" Those two questions change everything. A common complaint on r/sales is that pipeline meetings feel like busywork - it happens when the CRM isn't trusted and the meeting turns into a live data-entry audit.
Ignoring time-lag in close-rate measurement. A deal created in January and closed in April shouldn't inflate January's close rate. Measure by cohort, not by close date.
Bad coverage math. Using unweighted pipeline with no stale-deal filter gives you a number that feels good and means nothing. Weight it, filter it, then decide if you're short.
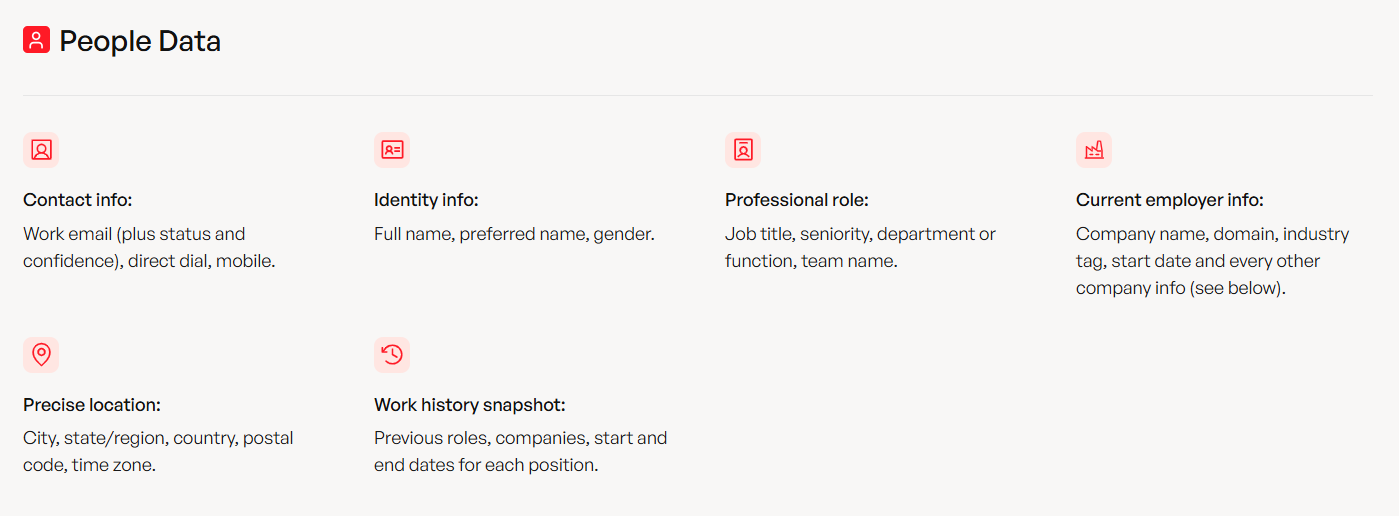
Dirty contact data. Your pipeline report is only as accurate as your CRM data. Contact data decays fast - people change jobs, get promoted, switch emails. Prospeo's CRM enrichment runs on a 7-day refresh cycle, returning 50+ data points per contact with 98% email accuracy and an 83% match rate. (If you're comparing vendors, start with the best data enrichment services.) At roughly $0.01 per verified email, it costs less than one missed forecast.
How to Run a Pipeline Review
Pipeline reviews should be execution meetings, not status updates. If your CRM already contains the truth, the meeting's job is to pressure-test it and decide what to do next. Start from the data. Spend the time on what to do about it.
Use a five-pillar framework:
Qualification. Are these deals real? Challenge assumptions. If a rep can't name the economic buyer or articulate the compelling event, the deal isn't qualified - it's a hope. (If you need a consistent standard, use a formal sales qualification framework.)
Coverage. Do we have enough pipeline to hit the number? Use your segment-appropriate ratio, filtered for stale deals. When you're short, that's a prospecting problem to solve this week, not next month. (More on common blockers: sales pipeline challenges.)
Next steps. Every deal discussed should leave with a specific, dated buyer action. "I'll send the proposal" doesn't count. "The CFO reviews the proposal Tuesday and we have a call Thursday at 2pm" counts.
Forecast accuracy. Compare this week's commit to last week's. What slipped? Why? Patterns in slippage reveal systemic problems - pricing objections, missing stakeholders, slow legal reviews. This is where reporting and analysis overlap: you're not just reading numbers, you're diagnosing why the numbers changed. (If you want to separate concepts cleanly, see sales forecast vs sales goal.)
Execution. Are reps driving the right conversations with the right people? Map which titles and roles you've engaged at each account. If every meeting is with a champion and nobody's talked to the economic buyer, the deal is at risk regardless of what the stage says. (Related: technical buyer vs economic buyer.)
Cadence: Reps check their own pipeline daily. Managers run team reviews weekly. Execs review monthly or at QBRs. Focus each session on late-stage deals closing soon, stalled deals, and anything with no advancement in 30 days. (If you're formalizing the monthly rhythm, use these QBR questions to ask.)
Reporting Tools Compared
Pipeline reporting tools fall into three layers. CRM-native tools handle reporting structure and visualization. Revenue intelligence platforms add AI-driven forecasting and conversation analysis. Data quality tools fix the inputs that everything else depends on.
Most teams start with CRM-native reporting; add revenue intelligence and data quality as complexity grows.
| Tool | Category | Best For | Starting Price |
|---|---|---|---|
| Prospeo | Data Quality | CRM enrichment, verified contacts | Free; ~$0.01/email |
| HubSpot | CRM-Native | SMB teams, free start | Free; paid from ~$20/seat/mo |
| Salesforce | CRM-Native | Enterprise, custom reports | ~$25-$500+/user/mo |
| Pipedrive | CRM-Native | Simple pipeline viz | $39/user/mo |
| monday CRM | CRM-Native | Visual boards, SMBs | ~$12-$30/seat/mo |
| Gong | Revenue Intel | Call analysis, deal risk | ~$250/user/mo |
| Clari | Revenue Intel | Forecast accuracy, rollups | ~$200-$400/user/mo |
Conversation intelligence tools like Avoma and Chorus are worth watching if your team runs heavy on calls - they surface deal risk signals from actual conversations rather than CRM fields. (If you're building the full stack, start with a shortlist of SDR tools.)
For teams starting from scratch, Close publishes 12 free pipeline templates for Excel and Google Sheets that give you a solid foundation before investing in tooling.
Look - don't buy Gong or Clari until your CRM data is clean enough to feed them something useful. The best forecasting model in the world can't fix garbage inputs.
Your MQL-to-SQL conversion is the steepest drop in the funnel. Most of that leak is bad contact data - reps can't qualify leads they can't reach. Prospeo's 143M+ verified emails and 125M+ direct dials (30% pickup rate) mean your pipeline velocity formula finally has real numbers behind it.
Fix the data layer and watch every stage conversion rate climb.
FAQ
What's a pipeline report vs. a sales forecast?
A pipeline report shows every open deal's current stage, value, velocity, and health. A sales forecast predicts what will actually close by a specific date. You need accurate reporting underneath before any forecast is reliable - the report is raw data, the forecast is interpretation.
How often should I review pipeline reports?
Weekly is the minimum for managers; reps should check daily as their working task list. Execs review monthly or at QBRs. Teams that skip weekly reviews consistently miss forecast by wider margins because stalled deals go unaddressed for too long.
Why is my coverage ratio misleading?
It counts everything - including stale deals with no activity in 30+ days and unqualified leads that'll never close. Filter those out and recalculate. If your "4x coverage" drops to 1.8x after removing dead weight, that 1.8x is your real number and your prospecting plan needs adjusting immediately.
What should a pipeline movement report include?
It tracks deals flowing between stages over a set period - new deals entering, deals advancing, deals regressing, and deals lost. It answers "Is our pipeline getting healthier or sicker?" and is one of the most actionable views a sales manager can review weekly.
How can I improve pipeline data quality affordably?
Start with CRM enrichment that refreshes contacts automatically. Tools like Prospeo return 50+ data points per contact at roughly $0.01 per verified email on a 7-day refresh cycle - compared to the 6-week industry average. Clean inputs fix reporting accuracy faster than any dashboard redesign.