The Sales QBR Template Nobody Else Gives You: Slide by Slide
Your VP wants the deck by Friday. You haven't started. The last three hours disappeared into Salesforce exports, stale pipeline numbers, and a Google Slides template that's somehow worse than starting from scratch.
SalesOps practitioners on Reddit describe losing a full day each quarter just assembling QBR data - not building slides, not rehearsing, just wrangling numbers. And here's the other problem: most quarterly business review templates floating around are built for CS teams running customer-facing reviews, not internal sales leadership meetings. Different audience, different metrics, different stakes entirely.
What follows is a 10-slide internal sales QBR outline you can copy into Google Slides or PowerPoint today, the exact KPIs and benchmarks your leadership team will ask about (with formulas), and a compact framework for individual rep QBRs when your manager springs one on you. Teams running consistent QBRs maintain net retention rates 15-20 points higher than teams relying on reactive support. The meeting's worth doing well. Let's make it fast.
Internal vs. Customer QBR
Before you build anything, make sure you're building the right thing. These two meetings share a name and almost nothing else.
| Internal Sales QBR | Customer QBR | |
|---|---|---|
| Purpose | Performance vs. quota, pipeline | Value delivered, retention/expansion |
| Audience | Sales leadership, RevOps, marketing | Customer stakeholders + account team |
| Tone | Honest, sometimes uncomfortable | Consultative, relationship-building |
| Cadence | Quarterly | Quarterly or 1-2x/year (EBR) |
QBRs are tactical, quarterly meetings with operational stakeholders. EBRs (Executive Business Reviews) happen once or twice a year with senior executives and focus on strategic alignment. Don't confuse the two - your VP doesn't want an EBR.
The 10-Slide QBR Deck
Ten slides, 60 minutes. Allocate roughly 30% reviewing last quarter and 70% looking forward. The biggest mistake teams make is turning the QBR into a rearview mirror.
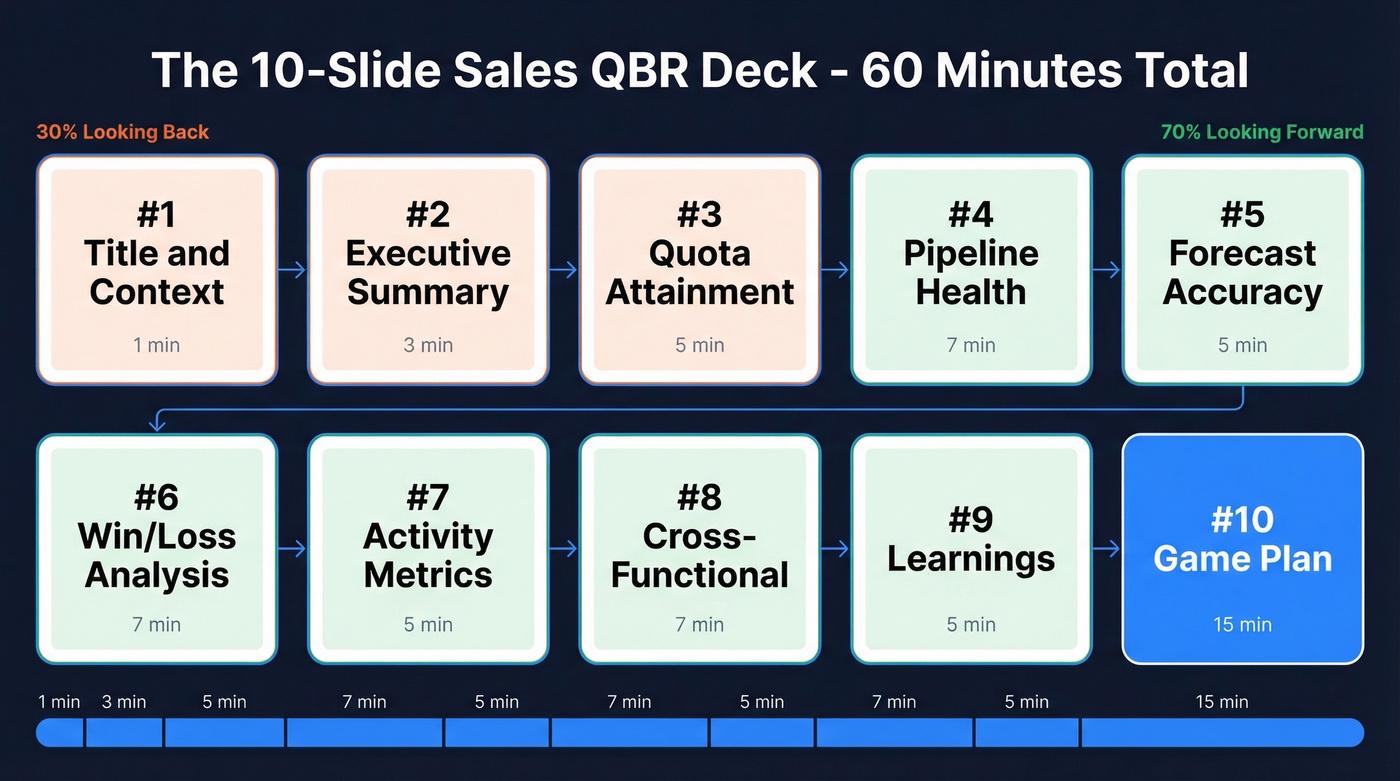
Slide 1: Title & Quarter Context (1 min) Quarter, team/region, date, presenter. One sentence framing the macro context - new product launch, market shift, reorg. That's it.
Slide 2: Executive Summary (3 min) Three sentences. Did we hit the number? Why or why not? What's the one thing that changes next quarter? This is the slide your VP reads if they skip the rest.
Slide 3: Quota Attainment vs. Target (5 min) Actual revenue vs. quota, broken down by rep or segment. Show the gap visually with a bar chart. Don't bury the miss in a table.
Slide 4: Pipeline Health (7 min) Pipeline coverage ratio (total pipeline / quota) should sit at 3-5x. Show deal slippage rate - deals that slid past their original close date. Healthy teams keep this under 20%. If yours is higher, name the three biggest slipped deals and why. (If you want a deeper set of leading indicators, use this pipeline health breakdown.)
Slide 5: Forecast Accuracy (5 min) 79% of sales orgs miss their forecast by more than 10%, and fewer than half of sales leaders have high confidence in their own numbers. World-class accuracy is 80-95%, average B2B is 50-70%, and anything below 50% is a red flag. If you're in the lagging tier, this slide becomes the most important conversation in the room. (If your team needs tooling, compare sales forecasting solutions before you buy.)
Slide 6: Win/Loss Analysis (7 min) Win rate = (Deals Won / Total Closed Deals) x 100. Most B2B teams land between 20-30%. More important than the number: why you won and why you lost. Pick three wins and three losses, name the pattern.
Slide 7: Activity Metrics (5 min) This is where reps show their work. Cold email open rates should hit 20-30%, response rates around 8-10%, and calls-to-meeting ratios typically run 1:8 to 1:15. If inputs are healthy but outputs aren't, you've got a conversion problem, not an effort problem. (Need a clean list of what to track? Start with these sales activities examples.)
Slide 8: Cross-Functional Alignment (7 min) Invite marketing and CS to this one. Clari's research highlights a common dysfunction: marketing claims lead gen was great, sales says lead quality was poor, and nobody reconciles the gap until the QBR. Address MQL-to-SQL conversion, CS handoff quality, and product feedback loops here. (This is also where marketing enablement shows up in the numbers.)
Slide 9: Learnings & What's Working (5 min)
Two columns: double down and stop doing. Be specific. "Our multi-threaded deals closed 2x faster" is useful. "We need to prospect more" is not. (If you want a tighter narrative, borrow a few frameworks from sales deck storytelling.)
Slide 10: Next-Quarter Game Plan (15 min) This is the slide that justifies the meeting. Every initiative gets an owner and a deadline. No orphan action items. If it doesn't have a name next to it, it won't happen. (For rep-level execution, a simple 30-60-90 day plan for sales reps can plug right into this slide.)
Sales QBR Metrics & Benchmarks
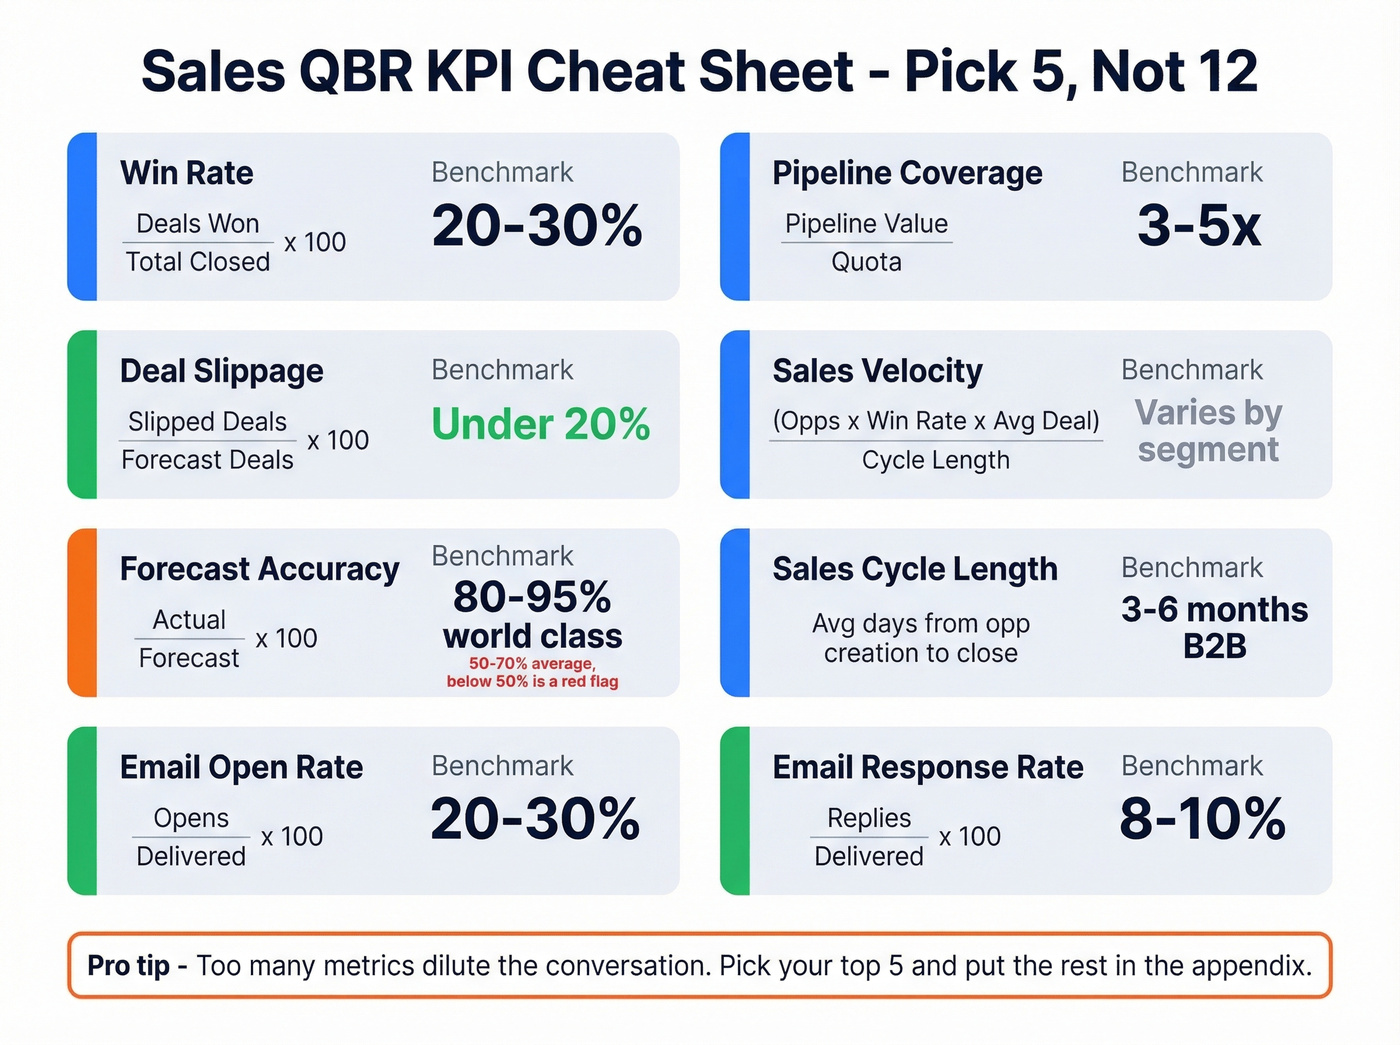
Keep this table bookmarked. These are the numbers your leadership team will ask about.
| KPI | Formula | Benchmark |
|---|---|---|
| Win Rate | Deals Won / Total Closed x 100 | 20-30% (B2B) |
| Pipeline Coverage | Pipeline Value / Quota | 3-5x |
| Deal Slippage | Slipped Deals / Forecast Deals x 100 | <20% |
| Sales Velocity | (Opps x Win Rate x Avg Deal) / Cycle Length | Varies by segment |
| Forecast Accuracy | Actual / Forecast x 100 | 80-95% (world-class) |
| Sales Cycle Length | Avg days from opp creation to close | 3-6 months (B2B) |
| Email Open Rate | Opens / Delivered x 100 | 20-30% |
| Email Response Rate | Replies / Delivered x 100 | 8-10% |
Pick five. Not eight, not twelve. We've sat through QBRs where teams tracked a dozen KPIs and lost the room by slide 8. Gong's guidance backs this up: too many metrics dilute the conversation and overwhelm everyone in the room. (If you're standardizing what RevOps reports, align on a single set of sales operations metrics.)
Half of QBR time gets wasted debating bad data. Prospeo enriches your CRM with 50+ data points per contact at a 92% match rate - refreshed every 7 days, not every 6 weeks. Walk into your next QBR with pipeline numbers that hold up under scrutiny.
Stop letting stale data derail your quarterly review.
QBR Template for Individual Reps
Your manager asked you to present a QBR in your next 1:1. You don't need ten slides. You need four sections, and a thread on r/sales nails the framework:
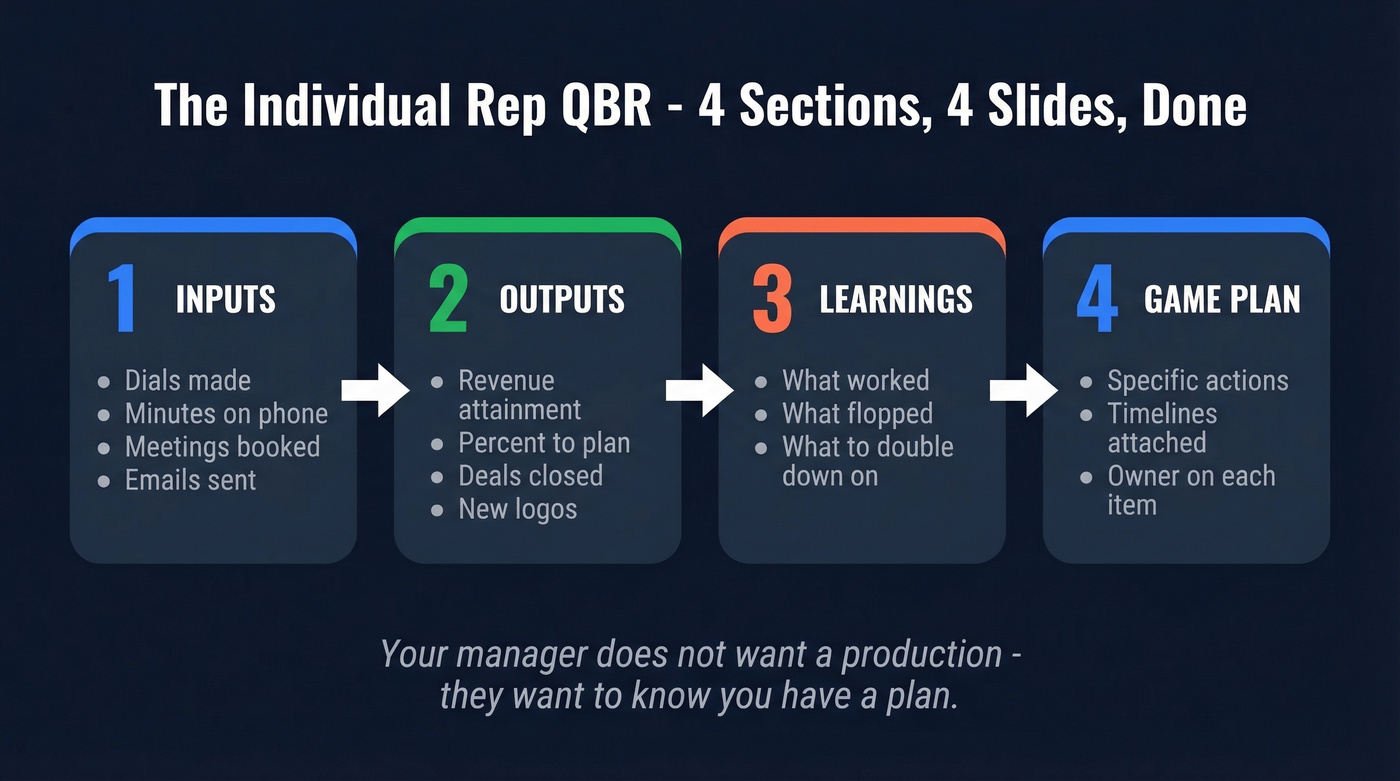
- Inputs: Dials, minutes on phone, meetings booked, emails sent
- Outputs: Revenue attainment, % to plan, deals closed
- Learnings: What worked, what didn't, what you'd double down on
- Game plan: Specific actions for next quarter, with timelines
Fit it on two pages or four slides. Your manager doesn't want a production - they want to know you've got a plan. (If you need a repeatable outbound plan, keep a few sales prospecting techniques in your back pocket.)
QBR Mistakes That Waste Everyone's Time
80% of the deck reviews last quarter. Flip it. 30% backward, 70% forward. A QBR is a planning meeting, not a history report.
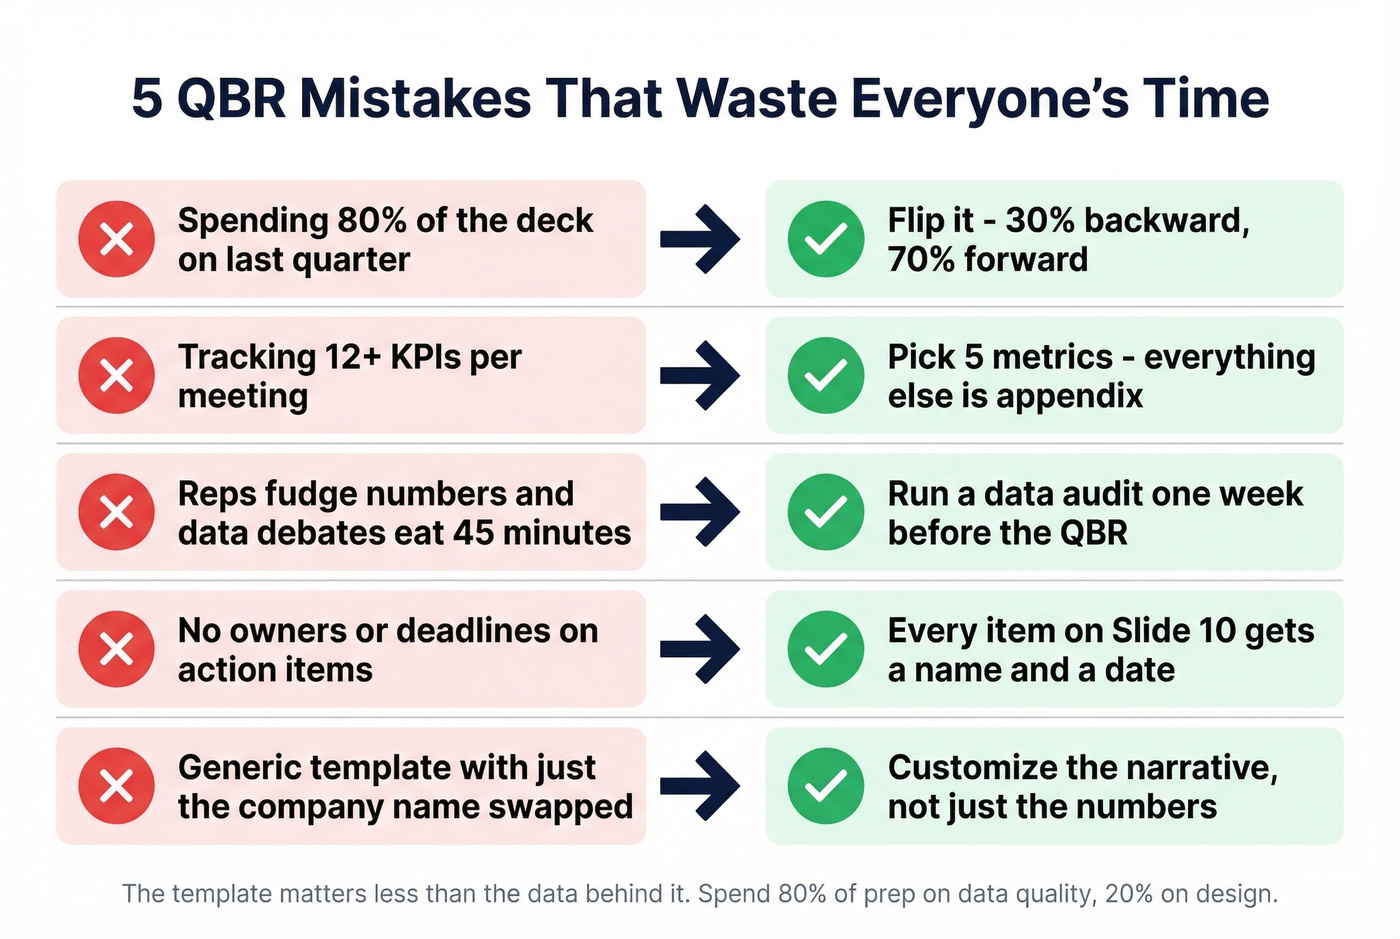
Too many KPIs. Pick five. Everything else is appendix material. The moment you show slide 14 of a 25-slide deck, you've lost the room.
Reps fudge numbers and data debates eat the meeting. Clean your CRM data before the QBR, not during it. Improving CRM data hygiene can increase forecast accuracy by up to 30%. Tools like Prospeo enrich CRM records with 50+ data points on a 7-day refresh cycle, so pipeline numbers hold up under scrutiny instead of triggering a 45-minute fact-checking session mid-meeting. (If you're evaluating vendors, start with these data enrichment services.)
No clear next steps. Every action item on Slide 10 needs a name and a date. Otherwise it's group therapy.
Generic template, zero customization. One CS team on Reddit described spending 15 hours per week building QBR decks, only to have a customer say they "just changed the company name." Customize the narrative, not just the numbers.
Free QBR Templates & Examples
| Template | Format | Slides | Best For |
|---|---|---|---|
| Smartsheet Sales QBR | PPT | Multiple | Sales + exec QBRs |
| SlidesCarnival QBR | Google Slides / PPT | 17 | Design-ready decks |
| SlideBazaar Dashboard | PPT | 6 | Dashboard-style |
| ClickUp QBR Templates | ClickUp / PPT | Varies | Process-oriented teams |
These give you the layout. The slide-by-slide outline above gives you the content. Combine the two and you'll have a deck ready in under an hour.
If you want to see real-world examples before building your own, start with the Smartsheet and ClickUp links - they include filled-in sample decks you can reverse-engineer.
Here's the thing: the template doesn't matter nearly as much as the data behind it. I've seen beautiful 20-slide decks get torn apart because the pipeline numbers were stale, and I've seen a 6-slide Google Doc earn a standing ovation because every number was airtight and the game plan was specific. Spend 80% of your prep time on data quality and 20% on design.
Your activity metrics slide only tells a real story when reps are reaching verified contacts. Prospeo delivers 98% email accuracy and 125M+ verified mobile numbers - so open rates, response rates, and call-to-meeting ratios reflect actual performance, not bad data.
Report real activity metrics backed by data you can trust.
FAQ
How long should a sales QBR be?
60 minutes max. Spend 20 minutes reviewing last quarter and 40 minutes on pipeline, forecast, and next-quarter priorities. If it runs over, you've got too many slides or too many attendees.
Who should attend an internal sales QBR?
Sales leadership, RevOps, and at least one marketing and CS representative. Keep it to 4-8 people - once you hit double digits, candor drops and the meeting turns into a performance.
What's the difference between a QBR and an EBR?
QBRs happen quarterly with operational stakeholders and focus on tactical metrics like pipeline coverage and win rate. EBRs happen 1-2 times per year with senior executives and focus on strategic alignment and long-term account planning.
What should a quarterly business review template include?
At minimum: quota attainment, pipeline health, forecast accuracy, win/loss analysis, and a next-quarter game plan with owners and deadlines on every action item. The slide-by-slide breakdown above covers all five plus cross-functional alignment.
How do I keep QBR data accurate?
Enrich your CRM before the review, not during it. A pre-QBR data audit one week before the meeting catches stale records, bounced emails, and outdated job titles before they derail the conversation. Automated enrichment tools that refresh on a weekly cycle make this much easier than manual spot-checks.