Every Sales Ratio Formula You Actually Need
Your VP just asked for "the sales ratio" in tomorrow's board deck. You nod, open a new tab, and immediately realize the problem: there's no single sales ratio formula. Ask five people what it means and you'll get five different answers - inventory formulas, price-to-sales multiples, conversion rates, operating margins. The term is genuinely ambiguous, and the right answer depends entirely on who's asking and why.
Here are 12+ formulas organized by what you're actually trying to measure, with worked examples, benchmarks, and the intuition behind each one so you don't just memorize - you understand.
Start Here: Which Ratio Do You Need?
If you only track three ratios, make them conversion rate, pipeline velocity, and sales efficiency ratio. Those three cover pipeline health, deal momentum, and spend effectiveness. Your role determines where to dig in first.
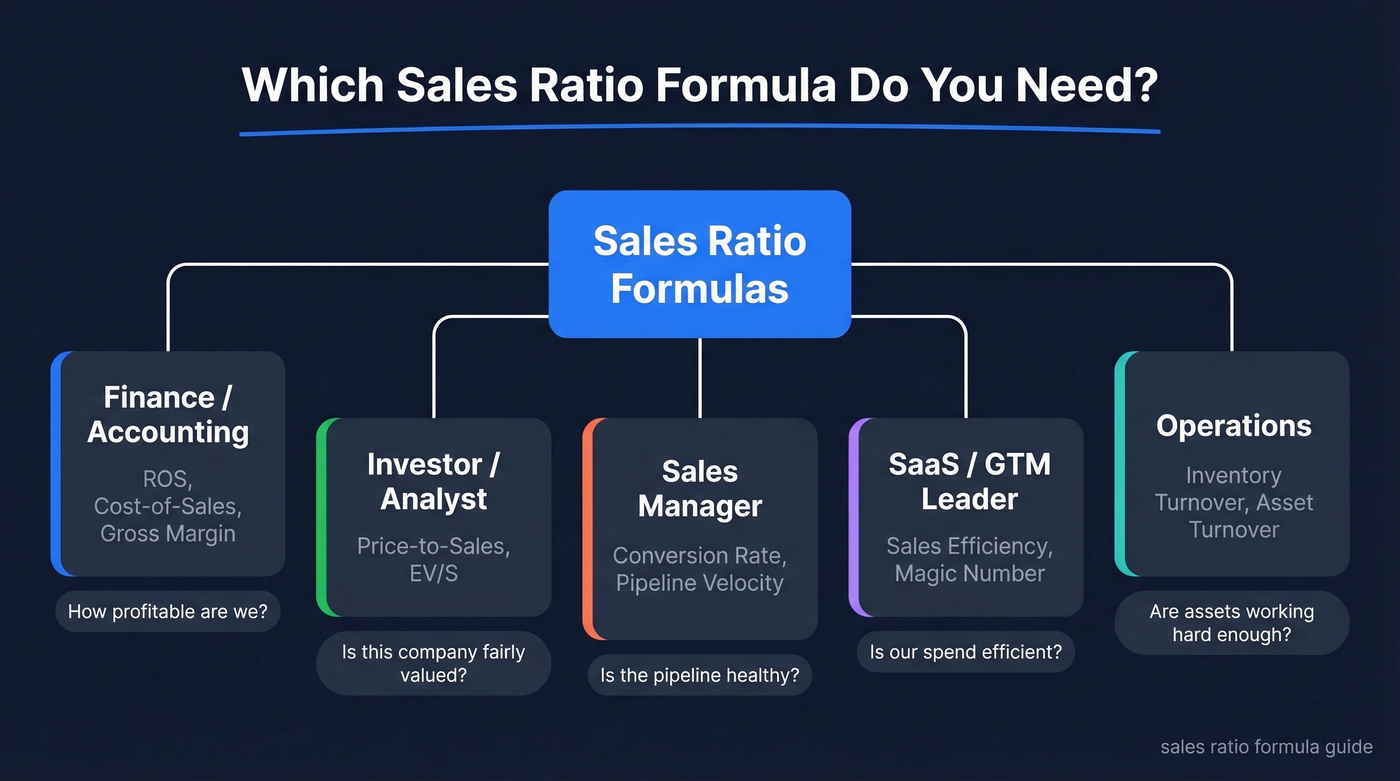
| Your Role | Start With These | Jump To |
|---|---|---|
| Finance / Accounting | ROS, Cost-of-Sales, Gross Margin | Profitability Ratios |
| Investor / Analyst | P/S, EV/S | Valuation Ratios |
| Sales Manager | Conversion Rate, Pipeline Velocity | Sales Activity Ratios |
| SaaS / GTM Leader | Sales Efficiency, Magic Number | [SaaS & GTM Ratios](#saas - gtm-ratios) |
| Operations | Inventory Turnover, Asset Turnover | [Operational Ratios](#operational - efficiency-ratios) |
Profitability Ratios
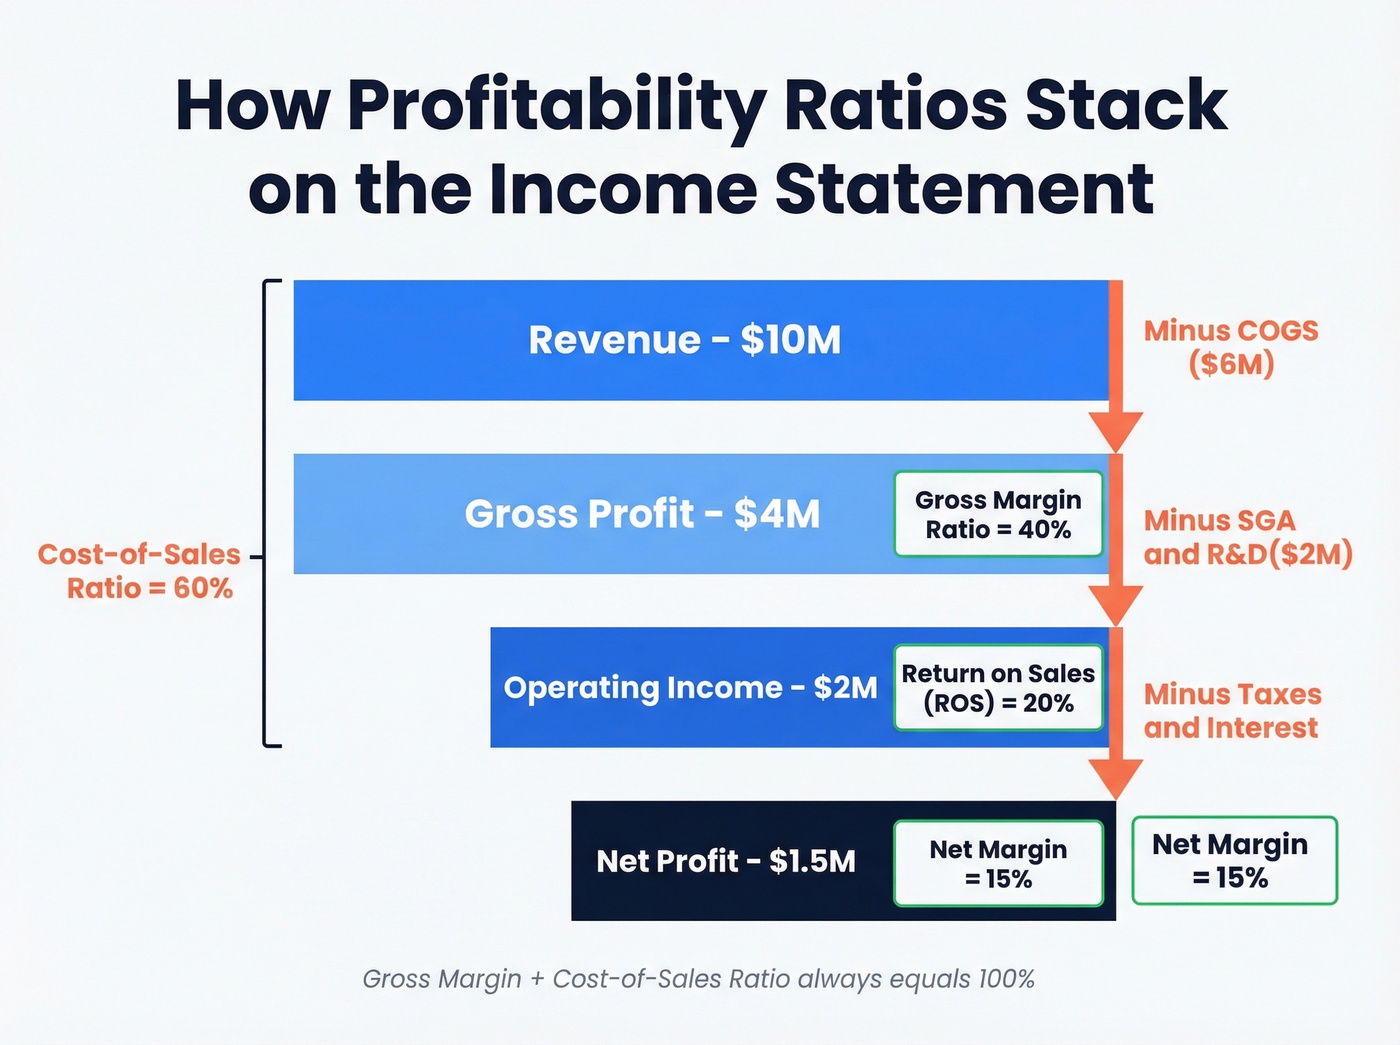
It helps to understand the margin layers on an income statement before jumping into individual formulas. Revenue sits at the top. Subtract cost of goods sold and you get gross profit. Subtract operating expenses (SG&A, R&D) and you land on operating profit. Subtract taxes and interest and you're at net profit. Each layer peels back a different cost, and each has its own ratio.
One thing we see teams get wrong constantly: comparing these ratios across industries. Don't. Operating margins vary massively by business model, so always benchmark within your sector.
Return on Sales (ROS)
Formula: Operating Income / Net Sales x 100
Worked example: $2M operating income on $10M revenue = 20% ROS.
ROS tells you how much profit each dollar of revenue generates before interest and taxes touch it. It's the default profitability ratio in finance because it strips out capital structure noise. Technically, ROS often uses EBIT, while operating margin is commonly written as operating income divided by net sales - in practice, most teams use them interchangeably. Close has a detailed breakdown that walks through the mechanics if you want the long version.
Benchmark: A realistic ROS range is often around 5-20%, but "good" depends heavily on industry.
Cost-of-Sales Ratio
Formula: Cost of Goods Sold / Net Sales x 100
Worked example: $6M COGS on $10M revenue = 60% cost-of-sales ratio.
This is the inverse lens of gross margin. A rising cost-of-sales ratio means your input costs are eating more of each revenue dollar - a red flag in manufacturing, a structural reality in commodities.
Gross Margin Ratio
Formula: (Net Sales - COGS) / Net Sales x 100
Worked example: ($10M - $6M) / $10M = 40% gross margin.
Gross margin and cost-of-sales ratio always sum to 100%. Software tends to run much higher gross margins than hardware and physical goods. If your gross margin is shrinking quarter over quarter, dig into COGS before anything else.
Valuation Ratios
Price-to-Sales (P/S)
Formula: Market Capitalization / Total Annual Revenue
Worked example: $400M market cap / $100M revenue = P/S of 4.0. The market values this company at four times its annual revenue.
P/S is the go-to valuation multiple for pre-profit or early-stage companies where earnings-based ratios like P/E don't work. The catch: P/S completely ignores profitability. A company burning cash at a 4x P/S is a very different bet than a profitable one at the same multiple. As one r/FinancialAnalysis thread notes, multiplying P/S by profit margin conceptually links you back toward P/E - which is the whole point.
For a fundamentals-based approach, the "justified P/S" ties the multiple to profit margin, payout ratio, and growth rate via the Gordon Growth Model - useful for DCF-oriented analysts who want to anchor the multiple to something more than market sentiment.
Enterprise Value-to-Sales (EV/S)
Formula: (Market Cap + Total Debt - Cash) / Total Annual Revenue
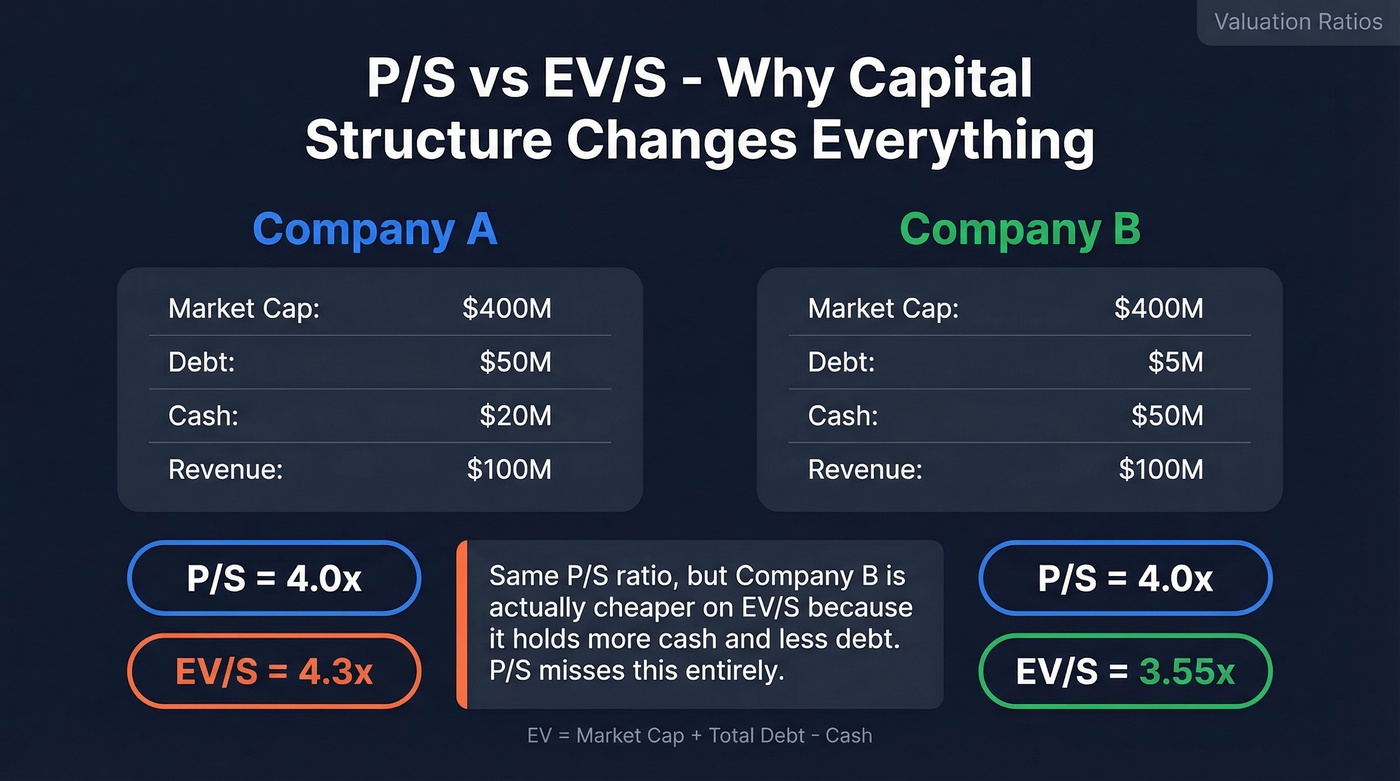
Worked example: Company A has a $400M market cap, $50M in debt, and $20M in cash. Enterprise value = $430M. Divide by $100M revenue and you get an EV/S of 4.3.
EV/S normalizes for capital structure, and that distinction matters more than most people realize. Two companies with identical revenue and market caps look the same on P/S, but if one carries $50M in debt and the other holds $50M in cash, their enterprise values - and their risk profiles - are wildly different. For leveraged companies or M&A analysis, EV/S is the sharper tool.
Operational & Efficiency Ratios
Inventory Turnover & Holding Days
Inventory Turnover Formula: COGS / Average Inventory
Holding Days Formula: Average Inventory / COGS x 365
Some sources calculate inventory turnover using Net Sales instead of COGS. Both conventions exist, but COGS is the cleaner denominator if you want an apples-to-apples view at cost.
The holding days formula trips people up because it feels backwards. Here's the intuition: if you sell $365K worth of goods per year at cost, that's $1K per day. If you're holding $30K in inventory, you've got 30 days' worth sitting on shelves. The formula just formalizes that mental math.
Worked example: $6M COGS / $750K average inventory = 8x turnover. Flip it: $750K / $6M x 365 = 46 holding days.
Benchmark: Fast-moving consumer goods turn 8-12x per year. Heavy equipment might turn 2-4x.
Inventory-to-Sales Ratio
Formula: Average Inventory / Net Sales
This is the inverse of turnover, expressed as a proportion. An ideal range sits around 0.167-0.25 for most retail and ecommerce businesses - meaning inventory represents roughly 17-25% of sales. Higher than that and you're tying up cash. Lower and you risk stockouts.
Asset Turnover
Formula: Net Sales / Average Total Assets
Worked example: A consulting firm with $50M revenue and $33M in assets = 1.5x asset turnover.
Asset turnover measures how efficiently a company uses its entire asset base to generate revenue. Asset-light businesses like software and consulting naturally run higher ratios than capital-intensive ones like manufacturing and utilities. A software company at 1.5x and a steel manufacturer at 0.4x can both be perfectly healthy - the ratio only matters relative to peers.
Sales per Employee
Formula: Total Sales / Number of Employees
Worked example: $20M revenue / 80 employees = $250K per employee.
A blunt but useful efficiency metric. SaaS companies often target $200K-$400K in revenue per employee. If your sales-per-employee figure is declining while headcount grows, you've got an efficiency problem - not a growth story.
Your conversion rate formula is only as good as the pipeline feeding it. Prospeo gives you 300M+ profiles with 98% email accuracy so every ratio you track - from pipeline velocity to sales efficiency - starts with real, reachable buyers.
Fix the numerator. Get verified contacts at $0.01 per email.
Sales Activity Ratios
These are the ratios sales managers live in daily. They measure pipeline health, rep productivity, and conversion efficiency at every stage.
Sales Conversion Rate
Formula: Number of Sales / Number of Leads x 100
Worked example: 27 closed deals from 100 leads = 27% conversion rate.
Simple formula, but the denominator is where most teams get it wrong. Here's the thing: if 20% of your lead list bounces on the first email, those aren't real leads - they're ghosts inflating your denominator and making your conversion rate look worse than it actually is. We've seen teams using Prospeo's verified emails discover their true conversion rate was 25-30% higher than what their CRM reported, simply because the lead count finally reflected real, reachable contacts instead of data rot.

Here's how funnel conversion benchmarks break down by industry and stage:
| Industry | Lead to MQL | MQL to SQL | SQL to Opp | SQL to Closed |
|---|---|---|---|---|
| B2B SaaS | 39% | 38% | 42% | 37% |
| eCommerce | 32% | 35% | 40% | 30% |
| Financial Services | 28% | 33% | 45% | 35% |
| Healthcare | 27% | 36% | 39% | 28% |
| Manufacturing | 25% | 30% | 38% | 32% |
Calls-to-Appointment Ratio
Formula: Total Calls / Total Appointments Booked
Worked example: 100 calls, 5 appointments = 20:1 ratio.
A 20:1 baseline is common for cold outbound. If your reps are running 40:1 or worse, the problem is targeting or messaging - not effort. In our experience, teams cut this ratio in half by tightening their ICP and verifying contact data before dialing.
If you're trying to improve this number, it helps to standardize your sales call flow and track outcomes consistently.
Appointment-to-Sale Ratio
Formula: Total Appointments Held / Total Sales Closed
Worked example: 10 appointments, 2 closed deals = 5:1 ratio (20% close rate).
A common benchmark is to stay above 10% - meaning you should close at least 1 in 10 qualified appointments. If it drops below that, the issue is qualification upstream, not closing skill. Existing customers convert at 60-70%, while new prospects sit at 5-20%. That gap alone tells you why expansion revenue matters more than most teams realize.
If you want a deeper benchmark view, compare against your average close rate by segment.
Pipeline Velocity
Formula: (Number of Opportunities x Average Deal Size x Win Rate) / Sales Cycle Length (days)
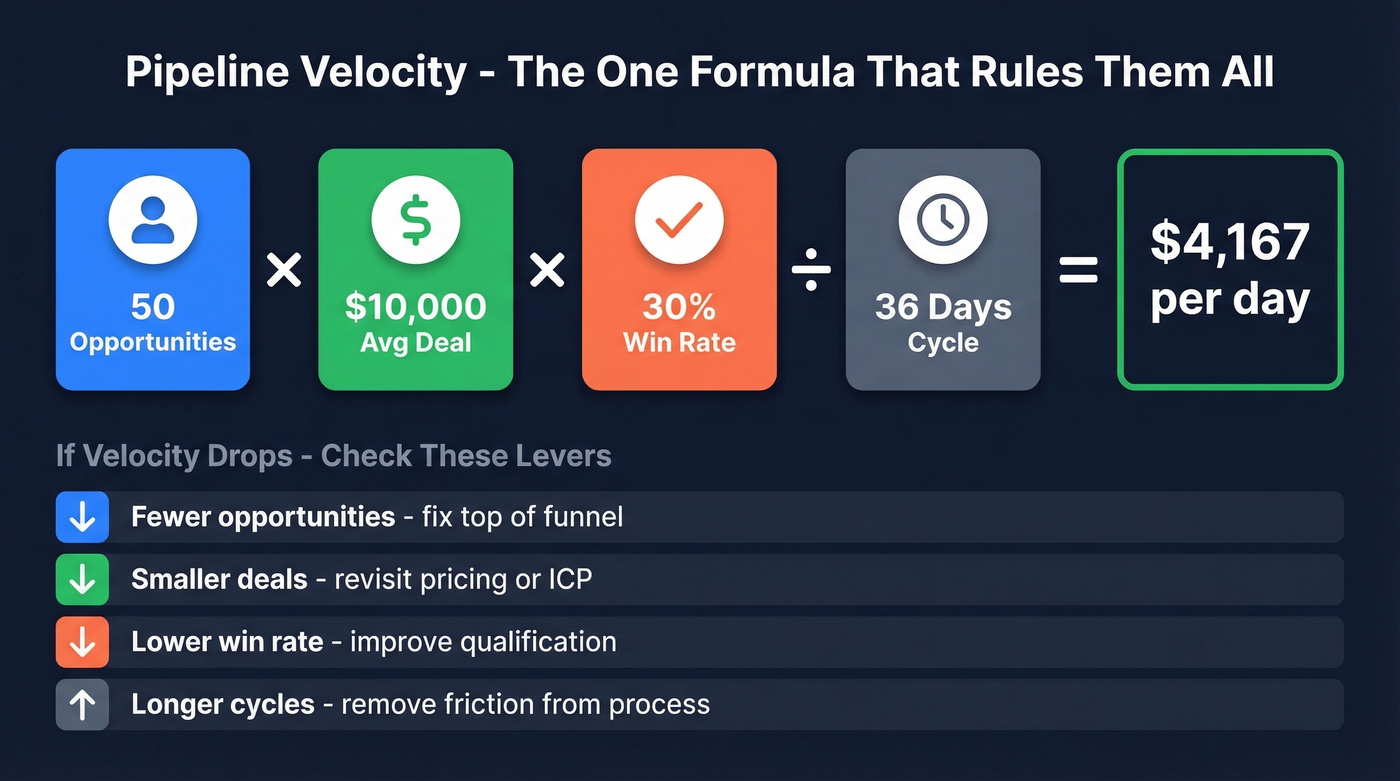
Worked example: 50 opportunities x $10,000 average deal x 30% win rate / 36-day cycle = $4,167/day flowing through your pipeline.
Pipeline velocity is the single best compound metric for sales leadership because it captures volume, value, efficiency, and speed in one number. Track it monthly. If velocity drops, you can immediately diagnose which input changed - fewer opps, smaller deals, lower win rate, or longer cycles. That diagnostic power is what makes it worth the slightly more complex calculation.
To pressure-test the inputs, it’s useful to track average deal size and average sales cycle alongside velocity.
SaaS & GTM Ratios
Sales Efficiency Ratio
Formula: New Revenue / Sales (or Sales + Marketing) Spend
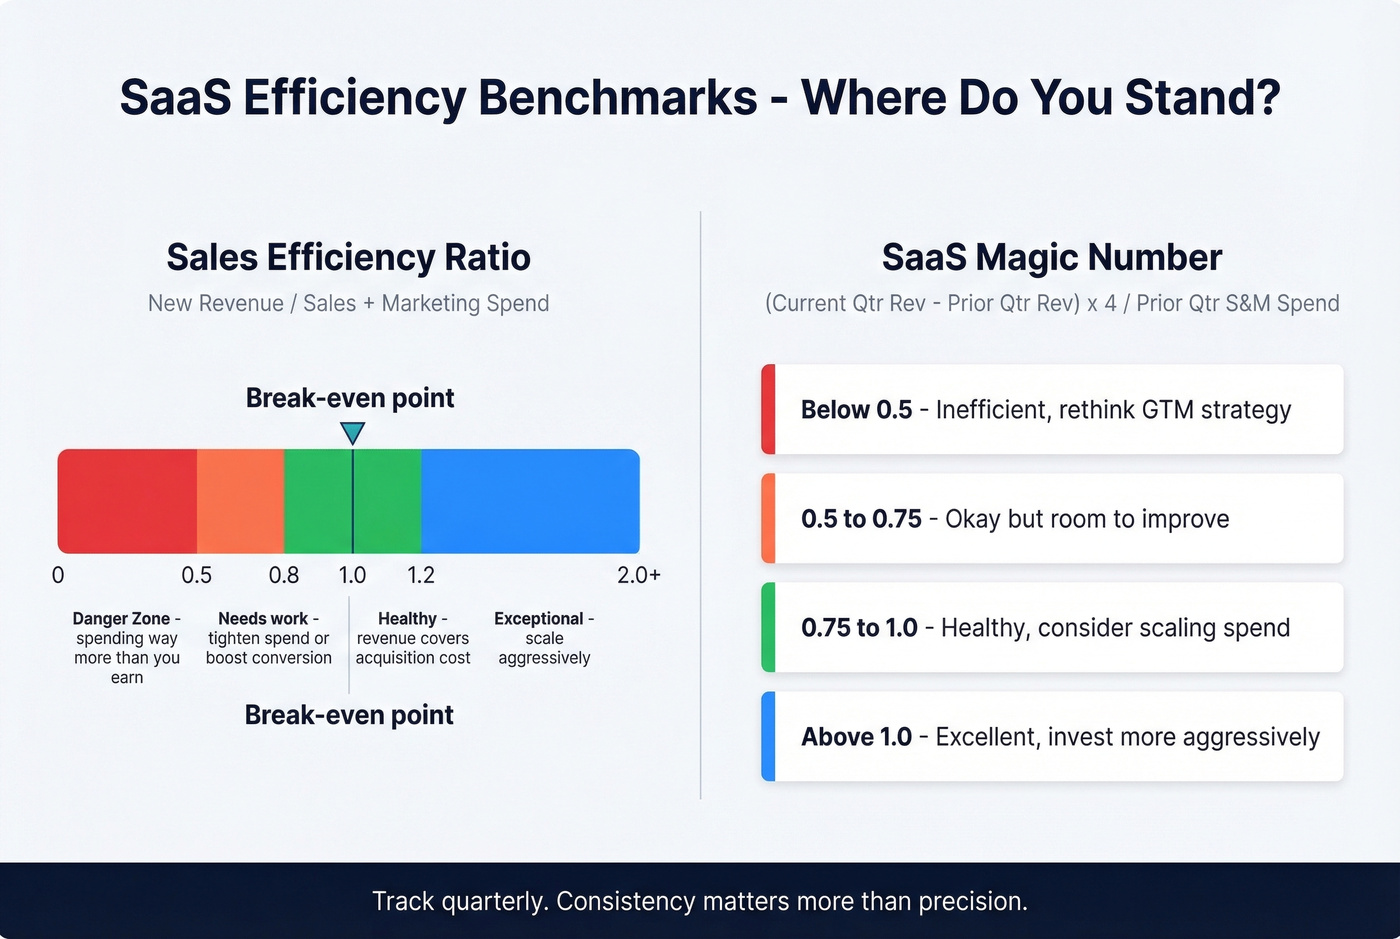
Two variants exist. The sales-only version isolates direct sales team impact. The S&M version gives you a CAC-inclusive view. Both are useful - just be consistent about which one you're tracking.
Benchmarks: A good sales efficiency ratio falls between 0.8 and 1.2. Above 1.0 means you're generating more revenue than you spend acquiring it. For sales-only measurement, 2.0+ is exceptional in SaaS. Below 0.5 on the S&M version signals a real efficiency problem.
Let's be honest: if your average deal size is under $10K, you probably don't need a complex attribution model to measure sales efficiency. Just divide new ARR by total S&M spend each quarter and watch the trend. Overthinking the formula matters less than consistently tracking it.
If you want to tie this back to unit economics, pair it with your CAC math.
SaaS Magic Number
Formula: (Current Quarter Revenue - Prior Quarter Revenue) x 4 / Prior Quarter S&M Spend
Worked example: Revenue grows from $2M to $2.25M quarter over quarter. Annualized growth = $1M. Prior quarter S&M spend = $1M. Magic Number = 1.0.
A Magic Number of 1.0 implies roughly a one-year CAC payback - healthy for most SaaS businesses. Below 0.5 means you're spending too much relative to growth. Above 1.5 means you should invest more aggressively - you're leaving growth on the table.
One warning: the Magic Number reflects net revenue growth, which includes churn. A company with strong new bookings but high churn will show a lower Magic Number than its sales team deserves credit for. Always read it alongside gross retention metrics from SaaS Capital or similar benchmarks.
Complete Reference Table
Every sales ratio formula in one place. Bookmark this.
| Ratio | Formula | Good Range | Best For |
|---|---|---|---|
| ROS / Operating Margin | Operating Income / Net Sales | ~5-20% (industry-dependent) | Finance |
| Cost-of-Sales | COGS / Net Sales | Varies widely | Finance |
| Gross Margin | (Sales - COGS) / Sales | Higher is better (peer-relative) | Finance |
| P/S | Market Cap / Revenue | Varies by sector | Investors |
| EV/S | EV / Revenue | Varies by sector | Investors |
| Inventory Turnover | COGS / Avg Inventory | 4-12x | Operations |
| Inventory-to-Sales | Avg Inventory / Net Sales | 0.167-0.25 (retail/ecom) | Operations |
| Asset Turnover | Net Sales / Avg Assets | Peer-relative | Operations |
| Sales per Employee | Total Sales / Employees | $200K-$400K (SaaS) | Operations |
| Conversion Rate | Sales / Leads x 100 | ~20% average; ~30% top performers | Sales Mgmt |
| Pipeline Velocity | (Opps x Deal x Win%) / Days | $2K-$10K/day (mid-market) | Sales Mgmt |
| Sales Efficiency | Revenue / S&M Spend | 0.8-1.2 | SaaS/GTM |
| Magic Number | Delta Revenue x 4 / S&M Spend | 0.75-1.5 | SaaS/GTM |
Common Mistakes With Sales Ratios
Five traps that distort your numbers:
Cross-industry comparisons. Always benchmark within your sector, or the ratio is meaningless noise.
FIFO vs. LIFO effects. Your accounting method for inventory directly impacts COGS, which flows into every profitability and inventory ratio. Two identical businesses using different methods will report different margins. Know which method your company uses before comparing.
Seasonality distortion. Pulling a single quarter's inventory turnover for a retailer in Q4 will look nothing like Q2. Use trailing twelve-month figures or compare the same quarter year-over-year.
One-time events. Asset sales, legal settlements, and restructuring charges can spike or crater profitability ratios for a single period. Strip these out before drawing conclusions.
Single-ratio reliance. No ratio tells the full story alone. A high conversion rate means nothing if pipeline velocity is tanking. Use a basket - profitability, efficiency, and activity ratios together give you the real picture.
Sales per rep declining? The problem isn't your formula - it's your data. Teams using Prospeo book 35% more meetings than Apollo users and cut bounce rates below 4%, turning every activity ratio in your deck into a growth story.
Stop optimizing ratios built on bad data. Switch to Prospeo.
FAQ
What's the most common sales ratio formula?
In finance, Return on Sales (operating income / net sales x 100) is the default profitability measure. In sales management, conversion rate (closed deals / leads x 100) gets tracked most often. The term covers at least a dozen distinct calculations across finance, operations, and pipeline management - there's no single universal version.
How do I calculate a sales ratio in Excel?
For conversion rate, use =B2/A2*100 where A2 is leads and B2 is closed deals. For ROS: =Operating_Income/Net_Sales*100. For pipeline velocity: =(Opportunities*Avg_Deal*Win_Rate)/Cycle_Days. Label columns clearly and use absolute references when comparing against benchmark thresholds.
What's a good sales conversion rate?
The average B2B closing rate is around 20%, and high-performing organizations hit 30%. Existing customers convert at 60-70%, while new prospects sit at 5-20%. Your rate is only meaningful with clean lead data - bounced contacts from stale databases inflate the denominator and make performance look worse than it is.
How does data quality affect sales ratios?
Bad data inflates denominators and deflates conversion metrics by 15-30%. A team with 100 "leads" where 25 bounce is really working 75 leads - their true conversion rate is a third higher than reported. Verifying contacts before they enter your CRM keeps every downstream ratio accurate.
Should I skip any of these ratios?
If you're running a pure SaaS business, skip inventory turnover and cost-of-sales - they don't apply to you. Focus on the Magic Number, sales efficiency, and pipeline velocity instead. For physical goods businesses, the valuation ratios (P/S, EV/S) are less actionable day-to-day than inventory turnover and gross margin. Pick the ratios that match your business model and ignore the rest.