Pipeline Quality: Why a Smaller Pipeline Almost Always Wins
It's the last week of the quarter. Your CRM says $2.4M in "Commit." Your gut says half of it won't close. The VP of Sales is already rehearsing the board narrative about "deals that slipped." You've seen this movie before - and the sequel is always the same: next quarter, leadership demands more pipeline. More volume. More coverage. And the problem gets worse.
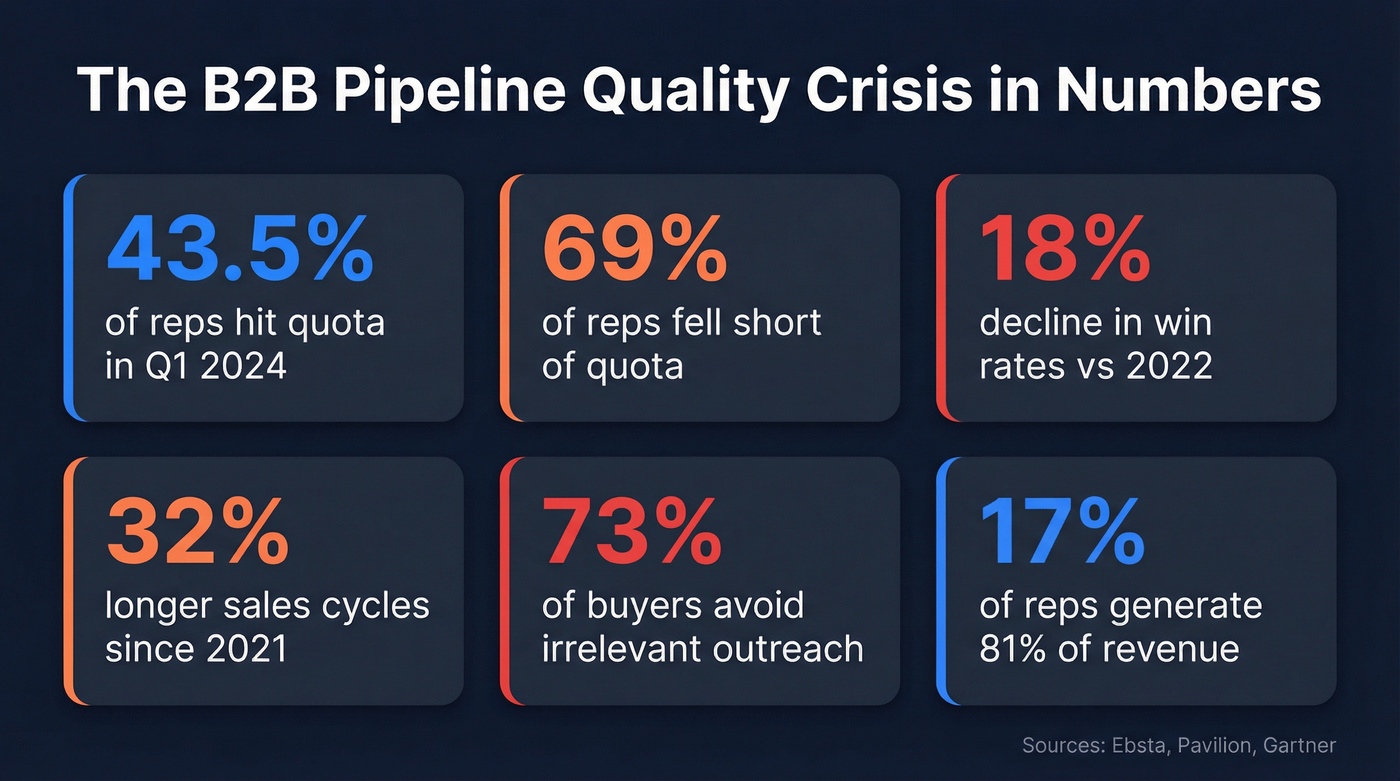
Here's the real number: in Q1 2024, only 43.5% of sales professionals hit quota. 69% of reps fell short entirely. Win rates declined 18% compared to 2022. The problem isn't that teams don't have enough pipeline. It's that most pipeline is fiction - a pipeline illusion that inflates forecasts while starving revenue.
What You Need (Quick Version)
If you're short on time, here's the playbook:
- Measure pipeline velocity, not just pipeline value. 68% of teams don't track velocity at all. The ones that do see 23% faster revenue growth.
- Pick a qualification framework and enforce it. MEDDIC for enterprise, BANT for transactional, BID for mid-market. No framework = no pipeline entry. (If you need a starting point, use a simple lead qualification framework scorecard.)
- Fix your data first. Bad contact data - bounced emails, dead phone numbers, decayed CRM records - poisons everything downstream. You can't close deals with people you can't reach.
The Sales Pipeline Quality Crisis
Picture this: it's forecast call day. Your top AE has $800K in her pipeline. She's confident. She's been "working" these deals for weeks. But when you dig in, three of the five deals have had their close dates pushed twice. One hasn't had a stage change in 47 days. Another has no identified economic buyer - just a "champion" who's really an internal coach with no budget authority.
This isn't an edge case. This is the median B2B sales team in 2026.
Only 43.5% of sales professionals hit quota in Q1 2024. Ebsta and Pavilion's joint research found 69% of reps fell short. Win rates dropped 18% versus 2022 and 27% versus 2021. Sales cycles lengthened 32% since 2021, with enterprise deals stretching 36%. And 73% of B2B buyers actively avoid sellers who send irrelevant outreach - meaning bloated pipelines don't just waste your time, they actively damage your brand with buyers.
17% of reps generate 81% of revenue. The gap between top performers and everyone else isn't closing. It's widening.
The instinctive response from leadership? "We need more pipeline." More outbound. More SDR activity. More MQLs. Crank the machine harder. But that instinct is exactly what's making things worse. Organizations with more than 40% unqualified pipeline waste 15-25% of total selling capacity on deals that never close. The quality vs quantity debate shouldn't even be a debate anymore - the data is overwhelming.
One company proved the opposite approach works: they trimmed bloated rep account books from thousands down to 300-400 accounts. Win rates jumped from 13% to over 20%. The recommended sweet spot is 100-300 active accounts per rep, refreshed every 30-60 days. Smaller territory, deeper knowledge, better results. Fewer marketing teams are celebrating MQL volume now; more are tracking pipeline velocity and actual revenue impact. The MQL-to-qualified-pipeline shift is real, and the teams making it are pulling ahead.
More than 50% of revenue leaders have missed a forecast at least twice in the past year. 97% say better data would improve forecast accuracy.
The fix isn't more pipeline. It's building a high-quality pipeline that actually converts.
What Pipeline Quality Actually Means
David Brock nailed the definition: pipeline quality is about "real deals properly positioned in the appropriate selling/buying process stage." Not deals your reps hope will close. Not deals that looked promising three months ago. Real deals, with real buyers, at real stages.

It has three dimensions, and most teams only think about one of them.
Opportunity quality is what most people mean when they talk about this topic. Is this a real deal? Does the prospect match your ICP? Is there a confirmed problem, a quantified impact, and a decision timeline? Is there an economic buyer who's engaged - not just a contact who took a meeting?
Data quality is the dimension everyone ignores until it bites them. Are the emails in your CRM still valid? Are the phone numbers still connected? Is the contact still at that company? Contact data decays at 2-3% per month. Within six months, a quarter of your contacts are stale. A pipeline built on decayed data is a pipeline built on sand. (If you want the benchmarks and a refresh cadence, see B2B contact data decay.)
Process quality is whether your pipeline stages actually reflect where the buyer is - not where the rep thinks they are. Deals don't move linearly. Customers skip around, move forward and backward.
Standard CRM probability defaults (10% at prospecting, 40% at qualifying, 80% at closing) have nothing to do with customer propensity to buy. Think about it: if four competing vendors each rate the same deal at 80% probability, that's a combined 320% - mathematically impossible. Exit criteria for each stage should be customer commitments, not rep activities or default percentages.
When any of these three dimensions breaks down, you get the pipeline death spiral. Manager sets a 3X coverage goal. Reps fill the pipe with garbage to hit the number. Win rates drop. Manager raises the target to 4X. Then 5X. Quality deteriorates further. The pipeline gets bigger and bigger while revenue stays flat - or shrinks.
This article says contact data decays 2-3% per month. Prospeo refreshes every 7 days - not the 6-week industry average. With 98% email accuracy and 5-step verification, your pipeline is built on real contacts, not ghosts.
Kill the pipeline death spiral at the source - start with clean data.
Metrics That Actually Measure Pipeline Quality
Most sales dashboards track the wrong things. Pipeline value is a vanity metric. Stage counts are decoration. If you want to know whether your pipeline is healthy, you need metrics at three levels: deal, pipeline, and outcome.
Deal-Level Metrics
These are the early warning signals that tell you whether individual opportunities are real or fiction.
1. Close date extensions. Count the number of times a deal's close date has slipped from one month to another. Within-month changes don't count - you're looking for month-to-month slides. Three or more extensions is a red flag. If a deal slipped last month, there's an increased chance it'll move again this month. Use conditional highlighting in your CRM: 3+ extensions = red, 2 = amber.
2. Days since last stage change. A deal sitting in the same stage for weeks without movement is either stalled or dead. If your average cycle from Discovery to Close is 90 days and a deal has been in "Proposal" for 60 days with no movement, something's wrong.
3. Days open versus average cycle length. Compare each deal's age against your historical average. A deal that's been open for 180 days when your average cycle is 90 days has a dramatically lower close probability. It's not impossible - but it shouldn't be in this month's forecast.
No single metric tells the full story. Use all three in combination. A deal with four close date extensions, stuck in Negotiation for two months, and open for twice your average cycle length? That's not a deal. That's a wish.
Pipeline-Level Metrics
This is where you zoom out from individual deals to assess the health of your entire pipeline.
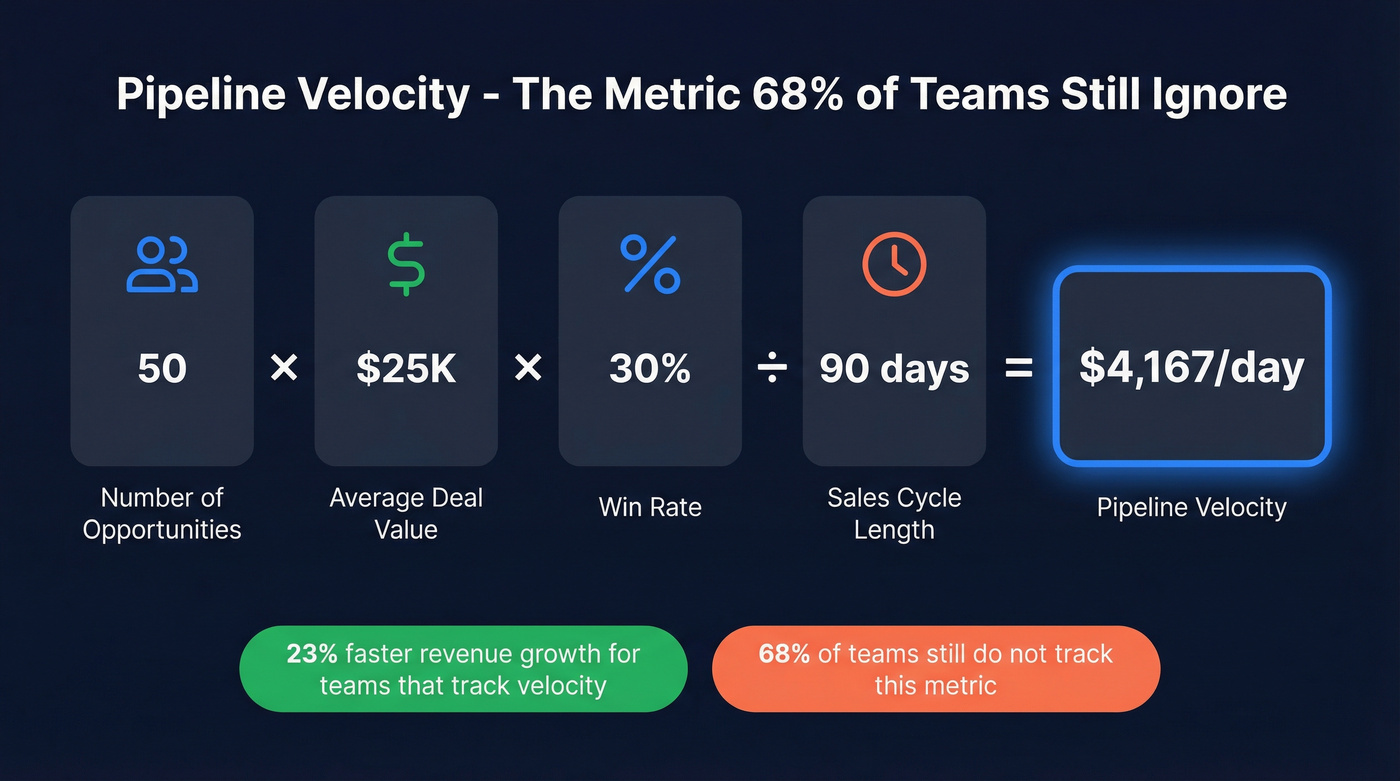
Pipeline Velocity is the single most important metric most teams aren't tracking. The formula:
Pipeline Velocity = (Number of Opportunities x Average Deal Value x Win Rate) / Sales Cycle Length
Velocity tells you how fast revenue moves through your pipeline. It's a leading indicator - unlike pipeline value, which is a lagging snapshot. Teams tracking velocity saw 23% faster revenue growth versus those tracking only pipeline value. Yet 68% of teams still don't track it at all.
Pipeline Coverage Ratio is the one everyone knows - but most teams apply it wrong. The blanket "you need 3X coverage" advice is lazy. Your right ratio depends entirely on your historical win rate. At a 33% win rate, 3X works. At a 20% win rate, you need 5X. At a 50% win rate, 2X is fine. Calculate from your actual data, not from a blog post.
Stage Conversion Rates tell you where deals die. If 60% of deals make it from Discovery to Demo but only 15% make it from Proposal to Negotiation, you've got a proposal problem - not a top-of-funnel problem. Track conversion between every stage, and watch for changes over time.
Outcome-Level Metrics and the Pipeline Quality Index
Win rate benchmarks: The average B2B win rate sits between 21-28% depending on the source. HubSpot pegs it at 28%; Gradient Works data suggests 21% for many segments. If you're below 20%, you've got a qualification problem. If you're above 35%, you're either exceptional or not putting enough at-bats in the pipeline.
Sales cycle length: Cycles have lengthened 32% since 2021, and 57% of sales professionals say they're still getting longer. Track your median cycle by segment - new business versus expansion, SMB versus enterprise. A blended average hides the real story. (If you want a clean breakdown, use a SaaS sales cycle segmentation model.)
Forecast accuracy: Only 7% of B2B sales organizations achieve 90%+ forecast accuracy. The median sits between 70-79%. If your forecast accuracy is below 70%, the quality of your pipeline is almost certainly the root cause.
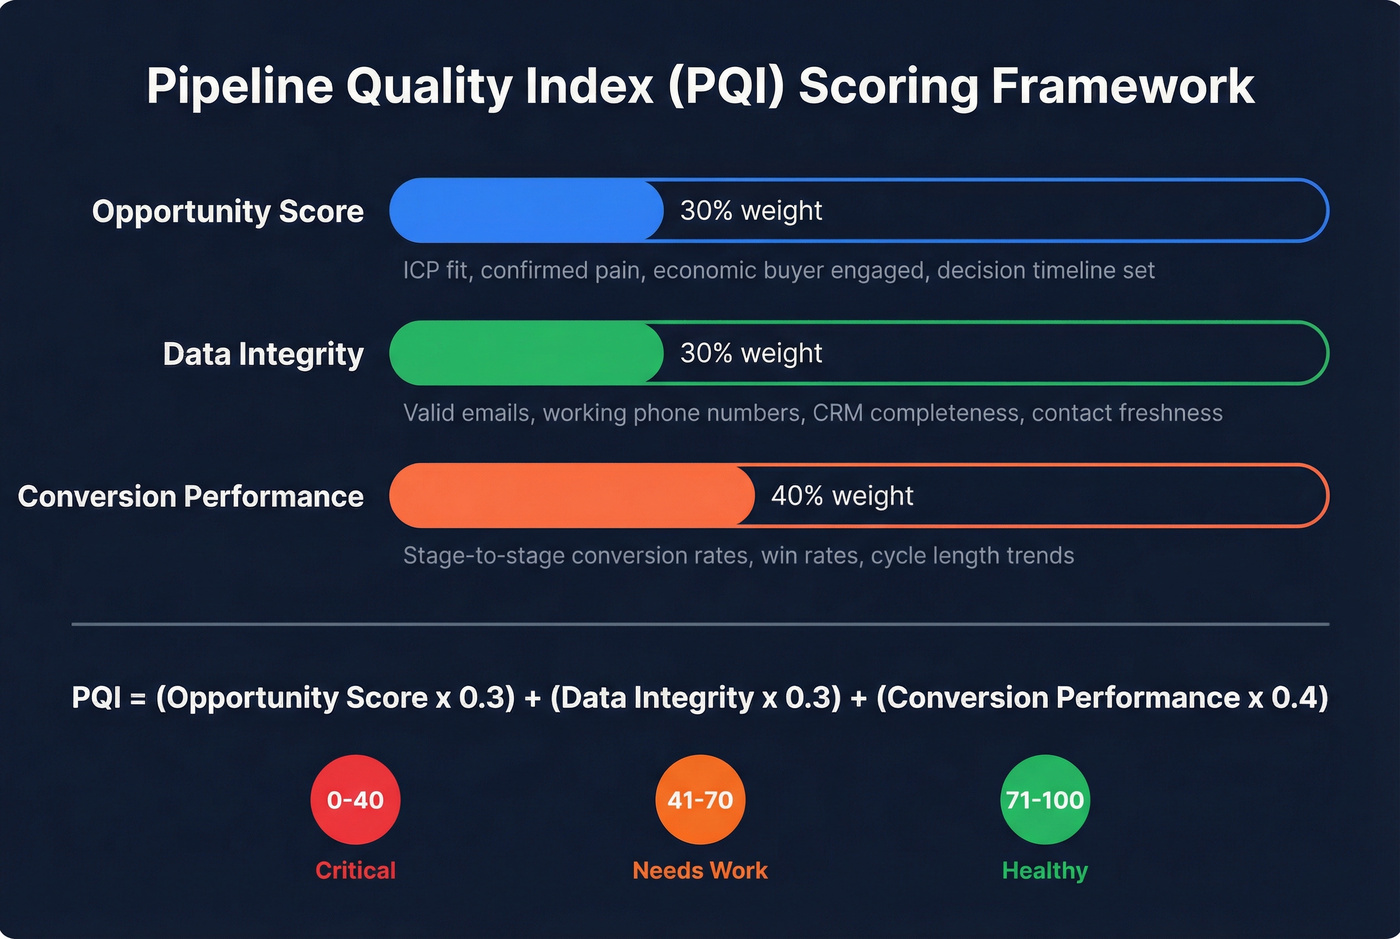
To tie it all together, consider a Pipeline Quality Index (PQI):
PQI = (Opportunity Score x 0.3) + (Data Integrity x 0.3) + (Conversion Performance x 0.4)
Score each component on a 0-100 scale. Opportunity Score reflects qualification rigor. Data Integrity reflects CRM completeness and contact data accuracy. Conversion Performance reflects actual stage-to-stage and stage-to-close rates. The weighting puts the most emphasis on outcomes - because ultimately, the pipeline either converts or it doesn't.
| Metric Level | Key Metrics | What It Tells You |
|---|---|---|
| Deal | Close date extensions, days since stage change, days open | Is this deal real? |
| Pipeline | Velocity, coverage ratio, stage conversion | Is the pipeline healthy? |
| Outcome | Win rate, cycle length, forecast accuracy, PQI | Is the system working? |
The ROI of Building a High-Quality Pipeline
The business case isn't theoretical.
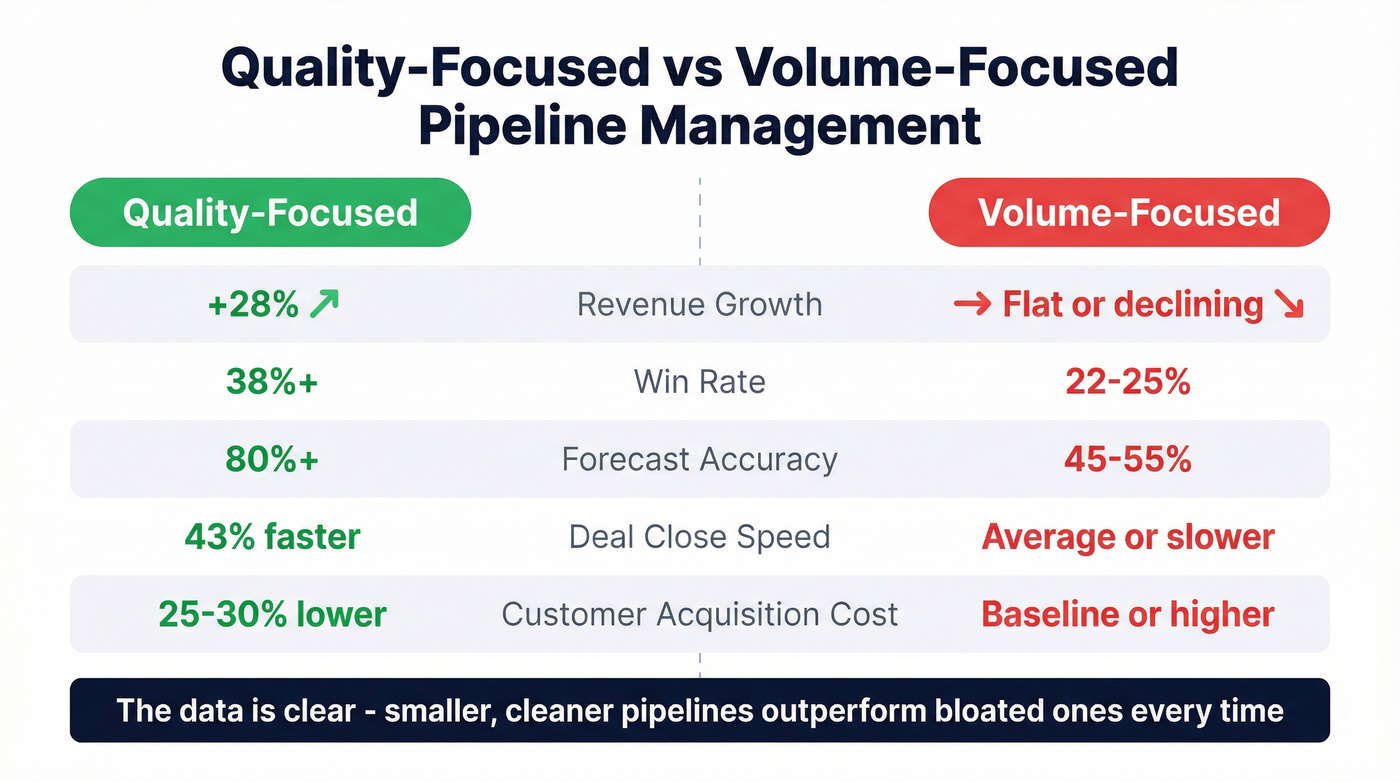
Companies with structured pipeline management see 28% higher revenue growth. Properly qualified opportunities close 43% faster than unqualified ones. Quality-focused management reduces customer acquisition cost by 25-30%. Companies maintaining rigorous standards achieve win rates of 38%+, compared to the industry average of 22-25%.
The forecast accuracy gap is staggering: quality-focused organizations achieve 80%+ forecast accuracy versus 45-55% for volume-focused teams. When your CEO asks why the number keeps moving, the answer is almost always the quality of what's sitting in your pipeline.
And here's the selling-time connection: organizations with 90%+ quota attainment see 34% of sales time spent actively selling, versus just 23% at lower-performing orgs. Better qualification doesn't just improve win rates - it frees reps to actually sell instead of chasing ghosts.
Drift's results after implementing a pipeline quality framework: win rates jumped from 21% to 34% in six months. Average deal size increased 27%. Sales cycle length dropped 31%. The counterintuitive part? They achieved this while reducing their target account list by 40%.
Fewer accounts, better qualification, dramatically better results.
We've seen the same pattern play out repeatedly: teams that cut their pipeline by 30-40% and focus on qualification see revenue go up, not down. It's the most counterintuitive finding in B2B sales, and it's backed by data from every major research firm. A high-converting pipeline doesn't come from casting a wider net - it comes from fishing in the right pond.
The McKinsey angle matters too: companies with quality-focused pipeline management achieve 5-10% increases in sales productivity. That doesn't sound dramatic until you do the math. A 10% productivity gain across a 50-person sales team is the equivalent of adding 5 reps - without the headcount cost.
Hot take: If your average deal size is under $10K, you probably don't need a $60K revenue intelligence platform. You need clean data, a qualification framework, and a manager who coaches instead of interrogates. Most teams are over-tooled and under-disciplined. Fix the foundation before you buy the dashboard.
Qualification Frameworks: Which One Fits Your Sales Motion
Every sales team needs a qualification framework. The question isn't whether to use one - it's which one matches your sales motion.
| Framework | Best For | Strengths | Limitations |
|---|---|---|---|
| BANT | High-velocity, transactional | Fast, binary, easy to train | Too simple for complex deals |
| MEDDIC | Enterprise, multi-stakeholder | Thorough, forecast-accurate | Heavy, slows fast cycles |
| BID | Mid-market, consultative | Buyer-validated, kills assumptions | Requires skilled discovery |
BANT - For High-Velocity Sales
BANT has been around since IBM created it in the 1950s, and it's still the right framework for high-velocity sales with shorter cycles and fewer decision-makers. Budget, Authority, Need, Timeline - four binary gates. Pass all four or the deal doesn't enter the pipeline.
The trick is asking better questions. "Are you the decision-maker?" is useless - most people say yes even when they're not. Instead: "Walk me through your approval process for a purchase like this." That surfaces the real authority structure without putting anyone on the defensive.
Same with budget. "Do you have budget?" gets you a vague "we're working on it." Instead: "What resources have been allocated for solving this problem?" The difference between "we have budget" and "we have $100K approved for Q2" is the difference between a qualified deal and a prayer.
Use BANT if you're running a transactional motion with deal sizes under five figures and sales cycles under 60 days. Skip it if you're selling six-figure enterprise deals with procurement committees - you need more rigor.
Four authority roles to map: economic buyer (signs the check), technical buyer (evaluates the solution), end user buyer (lives with it daily), and champion (sells internally on your behalf). BANT works when you can identify all four quickly. When you can't, you need MEDDIC.
MEDDIC - For Enterprise Complexity
MEDDIC was developed at PTC in the 1990s, and the results speak for themselves: after implementing MEDDIC, PTC's revenue grew from $195M to $650M in four years. That's not a coincidence.
Metrics, Economic Buyer, Decision Criteria, Decision Process, Identify Pain, Champion - six elements that force reps to understand the buying process at a depth BANT can't reach. The modern extension, MEDDPICC, adds Paper Process (procurement and legal) and Competition - both critical for enterprise deals where you can win the evaluation and still lose to red tape or an incumbent.
The stat that should scare every enterprise AE: deals without an identified decision-maker are 80% less likely to close.
MEDDIC forces you to find that person early. If you can't identify the economic buyer by the second meeting, the deal probably isn't real. Use MEDDIC if your average deal is six figures, involves three or more stakeholders, and takes 90+ days to close. The overhead is worth it. Skip it if you're running a PLG motion or selling to individual contributors - you'll over-engineer the process and slow everything down.
BID - The UnderrATED Middle Ground
BID (Buyer Input Data) is the framework most teams haven't heard of, and it's the most practical of the three for mid-market sales. Developed by the Sales Growth Company, BID focuses on one thing: does the rep have buyer-validated data to support this opportunity?
Four elements: the buyer's confirmed problems, quantified business impacts, root causes driving the issues, and desired outcomes. Every element must come from the buyer - not from the rep's assumptions, not from the marketing deck, not from what the SDR wrote in the handoff notes.
The pipeline entry standard is simple: no BID data, no deal. If a rep can't provide verified buyer data on all four elements, the opportunity doesn't enter the pipeline. In our experience, teams that implement BID see their pipeline shrink by 40% while revenue holds steady or grows. The deals that get cut were never going to close anyway.
Pipeline Reviews That Actually Work
Most pipeline reviews are status updates disguised as coaching sessions. The manager asks "what's the deal size?" and "when's it closing?" The rep gives optimistic answers. Everyone moves on. Nothing changes.
The 40/60 Rule - Inspection vs. Coaching
The best pipeline reviews spend 40% of the time on inspection and 60% on coaching. Most managers do the exact opposite - 80% inspection, 20% coaching (if any).
Inspection questions check status: "What's the deal size?" "When's the close date?" "What stage is it in?" These are necessary but insufficient. They tell you where things stand. They don't help the rep move deals forward.
Coaching questions develop skills: "Walk me through how you validated that close date with the economic buyer." "What would need to be true for this deal to close 30 days earlier?" "You said the champion is engaged - what specifically did they commit to doing internally this week?"
The difference is night and day.
The framework: Prepare, Question, Listen, Guide, Commit, Follow Up. Before the review, the manager reviews stage history, key stakeholders, recent activity, deal age versus typical cycle, and MEDDIC field completion. During the review, they ask coaching questions and actually listen - assessing how deeply the rep understands the buying process, what they know versus what they're guessing, and whether their confidence comes from data or hope.
After the review, both parties commit to specific actions with deadlines. 75% of sales reps say they're more likely to hit targets with a coach or mentor. Yet most managers treat pipeline reviews as interrogations. (If you want a repeatable cadence, use a pipeline review cadence template.)
Seven Pipeline Review Mistakes to Stop Making
1. No clear objectives or agenda. Fix: Share a structured agenda 24 hours before the review. Every attendee knows which deals they'll discuss and what data to prepare.
2. Relying on gut feeling instead of data. Fix: Pull CRM data before the meeting. Close date extensions, days since stage change, days open. Let the numbers start the conversation.
3. Insufficient qualification. Fix: Require BANT/MEDDIC/BID fields to be completed before a deal can be discussed in review. No data, no discussion.
4. Ignoring stage definitions. Fix: Document exit criteria for every stage - based on customer commitments, not rep activities. Review stage accuracy in every pipeline meeting.
5. Inconsistent cadence. Fix: Weekly reviews for active pipeline. No exceptions. No "let's skip this week because everyone's busy." Consistency compounds.
6. No documented action items. Fix: Every deal discussed gets a written next step with an owner and a deadline. Review completion at the start of the next meeting.
7. Creating an interrogation environment. Fix: Start with wins. Ask "how can I help?" before "why hasn't this moved?" Reps who feel supported share real information. Reps who feel attacked hide problems.
The Data Quality Foundation
Reps spend just 2 hours per day actually selling. The rest? Wrestling with bad data - wrong emails, disconnected phone numbers, contacts who left the company six months ago, duplicate records clogging the CRM. That 60-70% of time on non-selling tasks isn't an abstract stat. It's your team's reality.
74% of sales teams with AI are prioritizing data hygiene to support it. Every AI tool, every lead scoring model, every forecasting algorithm is only as good as the data feeding it. And most CRMs are full of garbage. (If you need a scorecard, start with data quality KPIs.)
Companies with 95%+ CRM data completion rates achieve 25% higher win rates. When reps have accurate contact data, they actually reach prospects. When they reach prospects, deals move. When deals move, pipeline quality improves - and you start building the kind of high-converting pipeline that actually shows up in revenue.
Look, there's a classic Sandler training story about a rep named Brian who stopped qualifying effectively. Every inquiry became "active." His pipeline ballooned. His manager was thrilled - look at all that coverage! But Brian's close rate cratered, his cycle times stretched, and his actual revenue flatlined. When Brian implemented stricter entry criteria and cleaned up his contact data, his pipeline shrank by half - and his revenue increased.

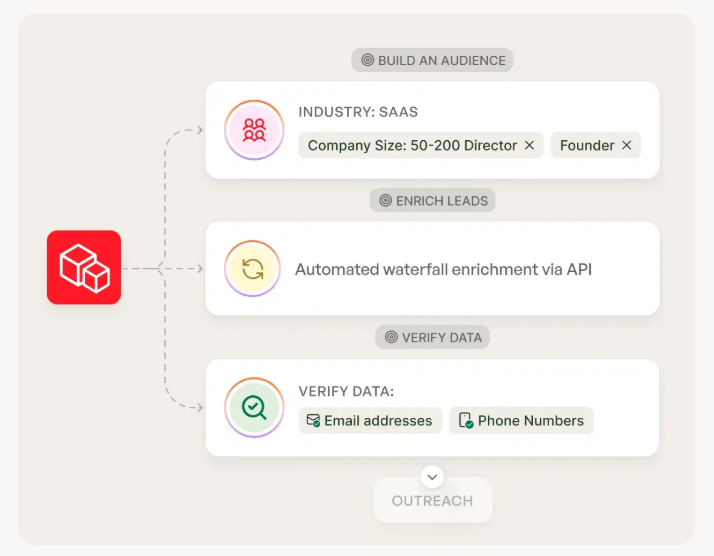
Here's what that looks like in practice - from raw list to verified, pipeline-ready contacts:
Tools for Pipeline Quality Management
You don't need a $100K tech stack to manage pipeline quality. You need the right tools in the right categories, and most teams are over-invested in some areas and completely blind in others.
| Tool | Category | Best For | Pricing |
|---|---|---|---|
| Salesforce Einstein | CRM Intelligence | At-risk deal flags, forecasting | ~$50-75/user/mo add-on |
| HubSpot Sales Hub | CRM Intelligence | Mid-market pipeline mgmt | $90-150/user/mo |
| Clari | Revenue Intelligence | Forecast accuracy, analytics | ~$30-50K+/year |
| Gong | Revenue Intelligence | Deal inspection via calls | ~$100-150/user/mo |
| Momentum | GTM Automation | Deal alerts, AI summaries | Custom pricing |
| Prospeo | Data Quality | Verified emails, mobiles | Free tier; from ~$39/mo |
| Freshworks CRM | SMB CRM | Visual pipeline, AI scoring | From $9/user/mo |
| GSP Dashboard | Free Analytics | Pipeline quality in SFDC | Free (AppExchange) |
CRM Intelligence (Salesforce Einstein, HubSpot Sales Hub): These platforms bake pipeline analytics directly into your CRM. Einstein flags at-risk deals and surfaces AI-driven forecasts inside Salesforce. HubSpot Sales Hub is the better fit for mid-market teams - its visual pipeline and built-in reporting hit the sweet spot between power and usability without the Salesforce admin overhead.
Revenue Intelligence (Clari, Gong): This category gets most of the budget and most of the attention. Clari excels at forecast accuracy and pipeline analytics - it's the tool your CFO will love because it turns pipeline chaos into predictable revenue calls. Gong takes a different angle: it analyzes actual sales conversations to surface deal risk, coaching opportunities, and competitive intel you'd never get from CRM fields alone. Both run $30-60K/year for mid-market teams. They're genuinely useful, but only if your underlying data is solid.
GTM Automation (Momentum): Momentum lives in Slack, which is where your reps already are. It pushes deal alerts, AI-generated call summaries, and pipeline updates into channels without forcing anyone to log into the CRM. For teams that struggle with CRM adoption, Momentum is the workaround that actually works.
Data Quality: This is the category most teams underinvest in - and it's the foundation everything else depends on. You can have the most sophisticated pipeline analytics in the world, and it won't matter if 30% of your emails bounce and your reps can't get prospects on the phone. (If you're building a workflow, start with BDR contact data QA.)
SMB and Free Options: Freshworks CRM gives small teams a visual pipeline with AI-powered lead scoring starting at $9/user/month - hard to beat for early-stage companies. The free GSP Sales Dashboard on the Salesforce AppExchange gives you the three core deal-level metrics (close date extensions, days since stage change, days open) without spending a dime. Layer in a qualification framework, clean your data, and you've got 80% of the value at 10% of the cost.
For sales pipeline management best practices, Outreach's 2026 guide covers the operational cadences that tie these tools together.
Pipeline Quality Audit Checklist
Run this audit quarterly. Better yet, run items 1-5 weekly during pipeline reviews.
Pipeline entry criteria are defined and enforced. Every deal entering the pipeline has passed BANT, MEDDIC, or BID minimum gates. No exceptions.
Every deal has buyer-validated qualification data. Not rep assumptions. Not SDR handoff notes. Actual buyer statements confirming the problem, impact, and timeline.
Close dates are confirmed by the buyer, not the rep. If the buyer hasn't agreed to a timeline, the close date is fiction. Flag any deal where the close date was set by the rep alone.
Stage definitions match the customer buying process. Exit criteria are customer commitments (signed NDA, scheduled technical review, budget approved), not rep activities (sent proposal, had demo).
Deals older than 2x average cycle length are flagged for review. These aren't necessarily dead - but they need a hard conversation about what's actually happening.
Contact data has been verified within the last 30 days. Emails, phone numbers, job titles. If the data is older than 30 days, re-verify before counting the deal as active. (If you need a how-to, follow a verification workflow.)
A champion is identified and actively engaged. "Identified" means you can name them. "Active" means they've taken a specific internal action on your behalf in the last two weeks.
Pipeline velocity is tracked weekly. Not monthly. Not quarterly. Weekly. Velocity is a leading indicator - by the time it shows up in quarterly results, it's too late to fix.
Coverage ratio is calibrated to your actual win rate. Not a blanket 3X. Calculate from your last four quarters of data. Adjust by segment if your win rates vary significantly between new business and expansion.
Weekly reviews follow the 40/60 inspection/coaching split. Time yourself. If you're spending more than 40% of the review asking status questions, you're doing it wrong.
Bad data wastes 15-25% of selling capacity. Prospeo's 300M+ verified profiles, 125M+ direct dials with 30% pickup rates, and CRM enrichment returning 50+ data points per contact mean your reps reach real buyers - not dead ends.
Stop inflating pipeline with contacts you'll never reach.
Frequently Asked Questions
What is a good pipeline coverage ratio?
It depends on your win rate: at 33%, 3x coverage works; at 20%, you need 5x; at 50%, 2x is sufficient. Calculate from your last four quarters of historical data - blanket rules lead to pipeline bloat or missed targets.
How often should you review pipeline quality?
Weekly for active deals - no exceptions. Run monthly strategic reviews covering velocity, coverage, and conversion trends. Reserve quarterly sessions for framework and stage-definition adjustments.
What's the single fastest way to improve pipeline quality?
Implement strict pipeline entry criteria and enforce them without exception. "No BID data, no deal" or BANT-minimum gates typically shrink the pipeline immediately while win rates climb within one quarter. Teams that prioritize qualified opportunities over raw volume consistently outperform those chasing coverage ratios.
How does contact data accuracy affect pipeline health?
Bad emails and dead phone numbers mean reps can't reach prospects, deals stall in early stages, and CRM data decays into noise. A 7-day verification cycle with 98% email accuracy prevents pipeline rot at the source - Snyk cut bounce rates from 35-40% to under 5% and grew AE-sourced pipeline 180%.
What's the difference between pipeline quality and pipeline health?
Pipeline quality refers to individual opportunity legitimacy - is this deal real, qualified, and accurately staged? Pipeline health is the aggregate view: velocity, coverage, conversion rates, and forecast accuracy. Quality at the deal level drives health at the portfolio level.