How to Calculate Customer Acquisition Cost (2026 Guide)
You're in the board meeting. The slide says your CAC is $85. The CFO asks why pipeline costs are up 40% year-over-year, and you realize the $85 only counts ad spend - not the three SDRs, the agency retainer, or the $12k/year you're paying for data tools. Your real CAC is probably four times that number.
Knowing how to calculate customer acquisition cost correctly is the difference between confident decisions and expensive guesswork. In the travel sector, CAC climbed about 35% from 2022 to 2025, while customer lifetime value rose just 4.5%. Most SaaS businesses underestimate or miscalculate their acquisition cost. The formula is simple. Getting it right is not.
What Is Customer Acquisition Cost?
Customer acquisition cost is the total amount you spend to turn a stranger into a paying customer. Every dollar of sales and marketing effort that touches the acquisition journey belongs in this number.
Don't confuse CAC with CPA. As Andrew Chen frames it, CPA is the cost per any conversion - a lead, a trial signup, an activated free user. CAC is the cost to acquire someone who actually pays you. Dropbox's CPA might be the cost per free registration; their CAC is the cost per user who upgrades to a paid plan. That distinction matters enormously when you're making budget decisions.
The CAC Formula
The basic customer acquisition cost formula looks deceptively simple:
CAC = Total Sales & Marketing Costs / New Customers Acquired
Say you spent $50,000 on sales and marketing last quarter and acquired 200 new paying customers. Your CAC is $250. Clean, easy, fits on a slide.
But this is the "thermometer" version - it tells you the temperature without diagnosing the illness. The real question isn't the formula itself. It's what goes into the numerator. Most teams get that part wrong, which is why the "simple" version and the "fully loaded" version produce wildly different numbers.
What to Include in Your CAC
The gap between a useful CAC and a misleading one comes down to your cost inputs. Here's what belongs in the numerator.
Paid marketing: Ad spend across all channels (search, social, display, sponsorships), affiliate payouts, and any agency fees managing those campaigns.
Organic marketing costs: Content writers, designers, SEO tools, email platform subscriptions, social media management tools. These aren't free just because you didn't buy a click.
Sales team expenses: SDR and AE base salaries, commissions, bonuses, benefits. CRM licenses, data tools, dialers, and enrichment platforms are real acquisition costs that belong in your numerator. So do sales enablement tools and training programs.
Other acquisition costs: Trade shows, webinars, event sponsorships, outsourced prospecting, printed materials, and any freelance or contractor work tied to demand generation.
The most commonly forgotten line items? SDR salaries (people treat them as "headcount" rather than acquisition cost), data provider subscriptions, and creative production. Leaving these out can understate your CAC by half or more.
Step-by-Step Worked Example
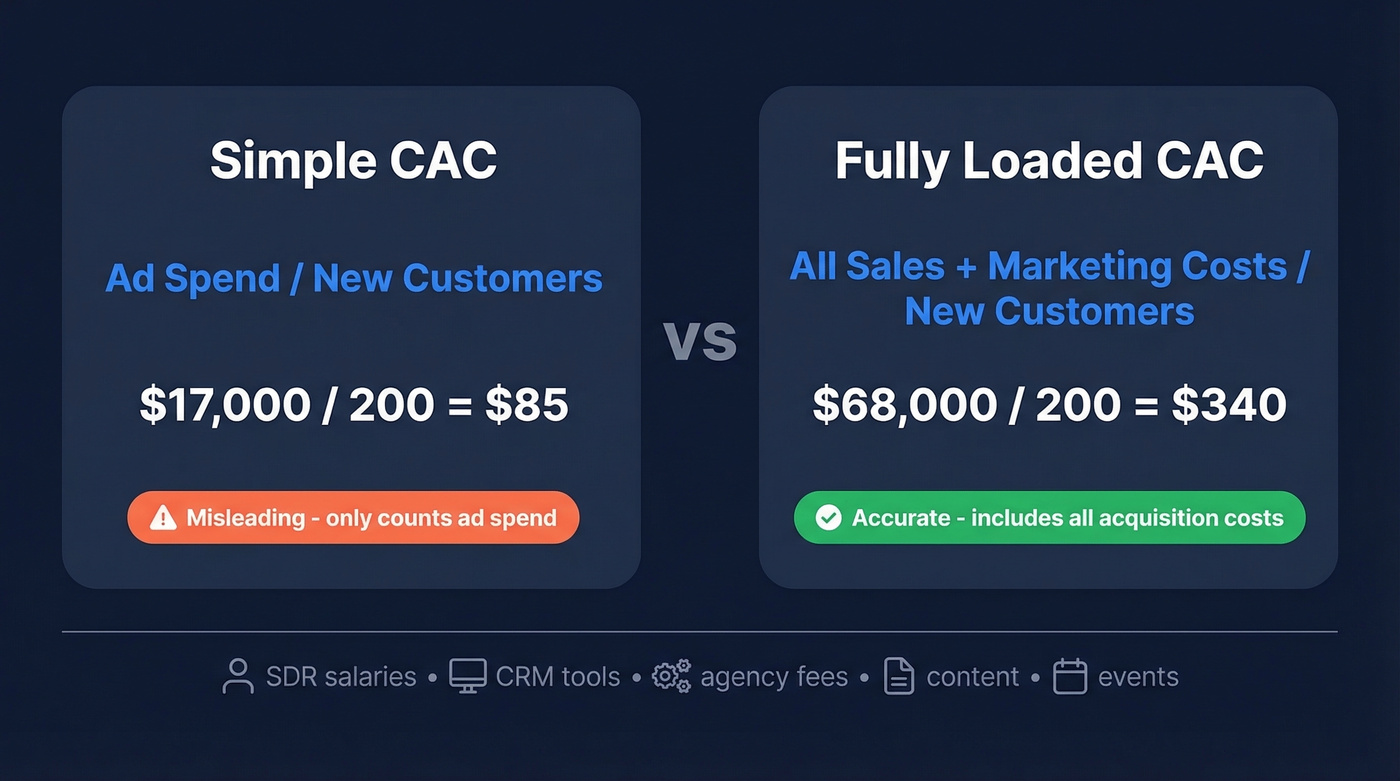
Let's revisit that board meeting. Here's what the "simple" version looks like versus the fully loaded truth.
Simple version - ad spend only: You spent $17,000 on Google and Facebook ads last quarter. You acquired 200 customers. CAC = $85. Looks great on a slide.
Fully loaded version - everything included:
| Cost Category | Quarterly Spend |
|---|---|
| Paid ads | $17,000 |
| 2 SDRs (salary + benefits) | $30,000 |
| 1 AE (prorated to new biz) | $12,000 |
| CRM + data tools | $3,500 |
| Content + SEO | $2,500 |
| Agency retainer | $2,000 |
| Webinar program | $1,000 |
| Total | $68,000 |
Same 200 customers. Fully loaded CAC = $340. Four times the number you showed the board. Same company, same quarter, radically different story.
5 Mistakes That Distort Your CAC
Nearly 70% of businesses miscalculate their acquisition cost. Here's where the math breaks down.
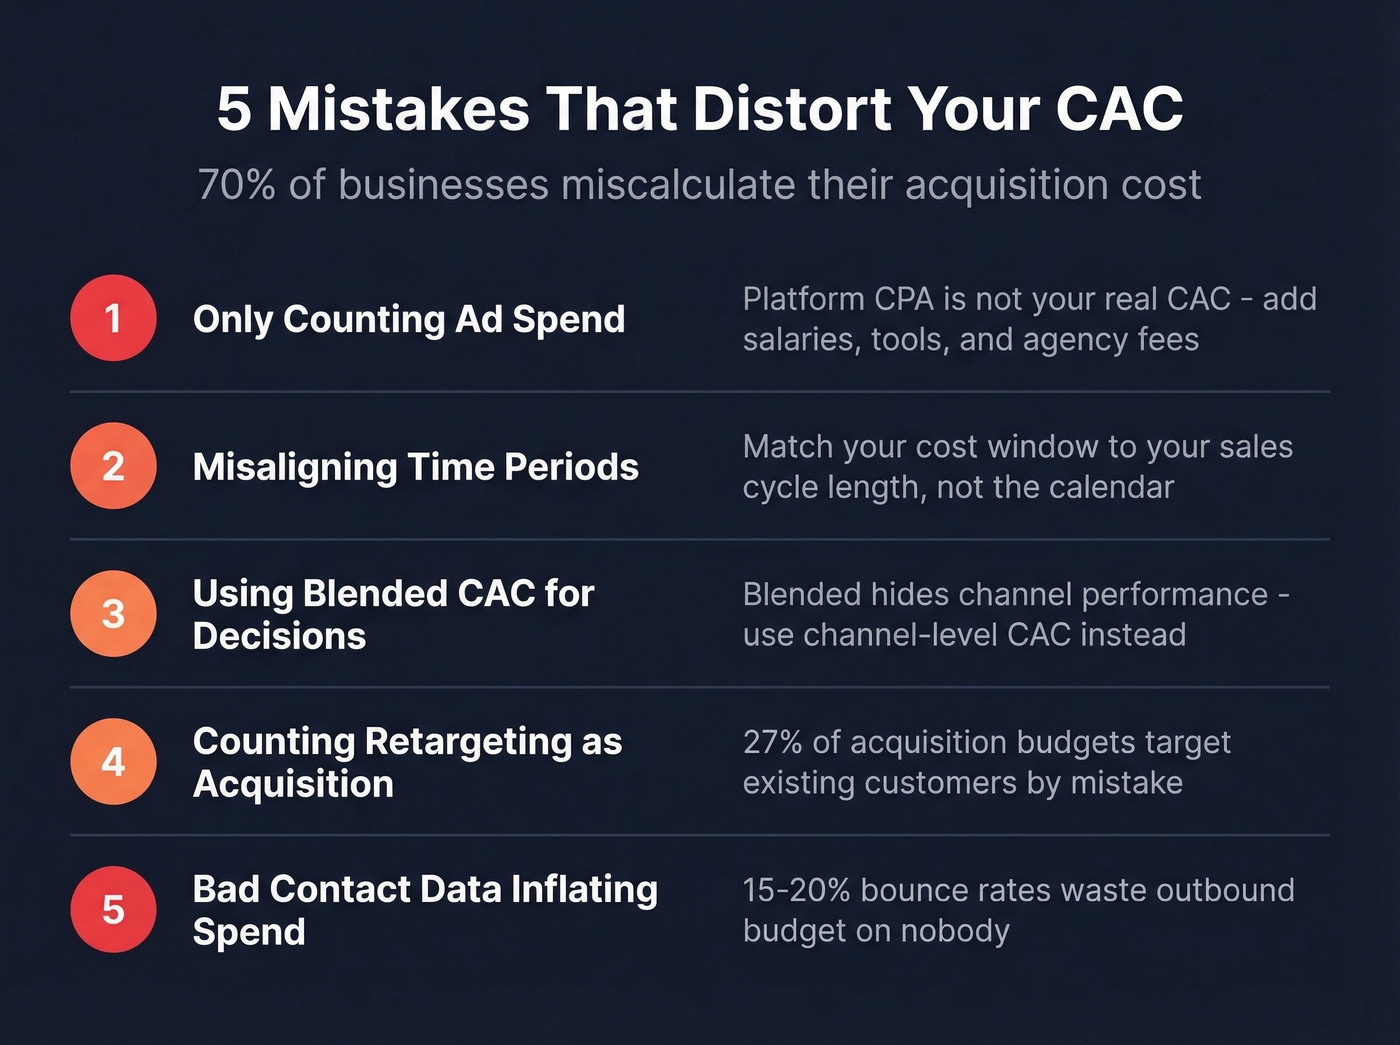
Only Counting Ad Spend
This is the most common mistake and the most dangerous. Your ad platform says your cost per acquisition is $50. You report that as CAC. But when you add salaries, tools, creative production, and agency fees, the real number is $200. Platform-reported CAC is a vanity metric - it reflects the ad ecosystem, not your business.
Misaligning Time Periods
If your average sales cycle is 60 days, the leads you spent money on in March aren't becoming customers until May. Dividing March spend by March customers creates a number that's mathematically valid and operationally useless. You'll shut off good channels or keep bad ones running because the timing doesn't match. Align your cost window to your sales cycle length, not your calendar.
Using Blended CAC for Decisions
Blended CAC averages your best and worst channels into a single number that helps nobody. If your organic CAC is $120 and your paid CAC is $450, the blended $200 tells you nothing about where to invest. Track blended for board decks. Use channel-level CAC for actual decisions.
Counting Retargeting as New Acquisition
In a travel-industry survey, an estimated 27% of digital acquisition budgets were spent targeting existing customers. You're running "acquisition" campaigns that retarget your own users and loyalty members. That's not acquisition - that's retention spend misclassified. Separate your audiences or your CAC will always look inflated.
Bad Contact Data Inflating Spend
Every bounced email and disconnected phone number is acquisition budget spent reaching nobody. If your outbound list has a 15-20% bounce rate, you're wasting 15-20% of your outbound spend before a single prospect reads your message. We've seen teams run 5,000-email sequences where 800+ bounced - SDR time, tool credits, and domain reputation burned for zero pipeline.

This is where data quality tools pay for themselves. Prospeo's 98% email accuracy and 7-day data refresh cycle mean your outbound budget actually reaches real people. At roughly $0.01 per verified email, the cost of verification is trivial compared to the CAC inflation caused by dead contacts. (If you want a broader view of options, compare email verification tools before you commit.)
Every bounced email inflates your CAC. At ~$0.01 per verified email and 98% accuracy, Prospeo eliminates the wasted SDR time, burned tool credits, and domain damage that silently bloat your acquisition costs. 15,000+ companies already use it to reach real prospects.
Stop paying to reach inboxes that don't exist.
Blended vs. Paid vs. Organic CAC
Three versions of CAC, three different uses.
Blended CAC = Total S&M Costs / All New Customers. This is the number your board sees. Useful for high-level trend tracking and investor conversations, but it hides channel-level performance.
Paid CAC = Paid Channel Costs / Customers from Paid Channels. Higher than blended, but it tells you the true cost of scaling through paid acquisition. This is the number that matters when you're deciding whether to increase ad budget.
Organic CAC = Organic Channel Costs / Customers from Organic Channels. Lower than paid, but slower to build. The catch: multi-touch attribution makes it hard to cleanly separate organic from paid. A prospect might see a blog post, then click a retargeting ad, then book a demo. Who gets credit?
As one SaaS founder put it on r/smallbusiness, multi-touch attribution "feels like black magic." First-touch and last-touch models both lie. Perfect attribution doesn't exist, but directional channel-level CAC is still far more useful than a single blended number.
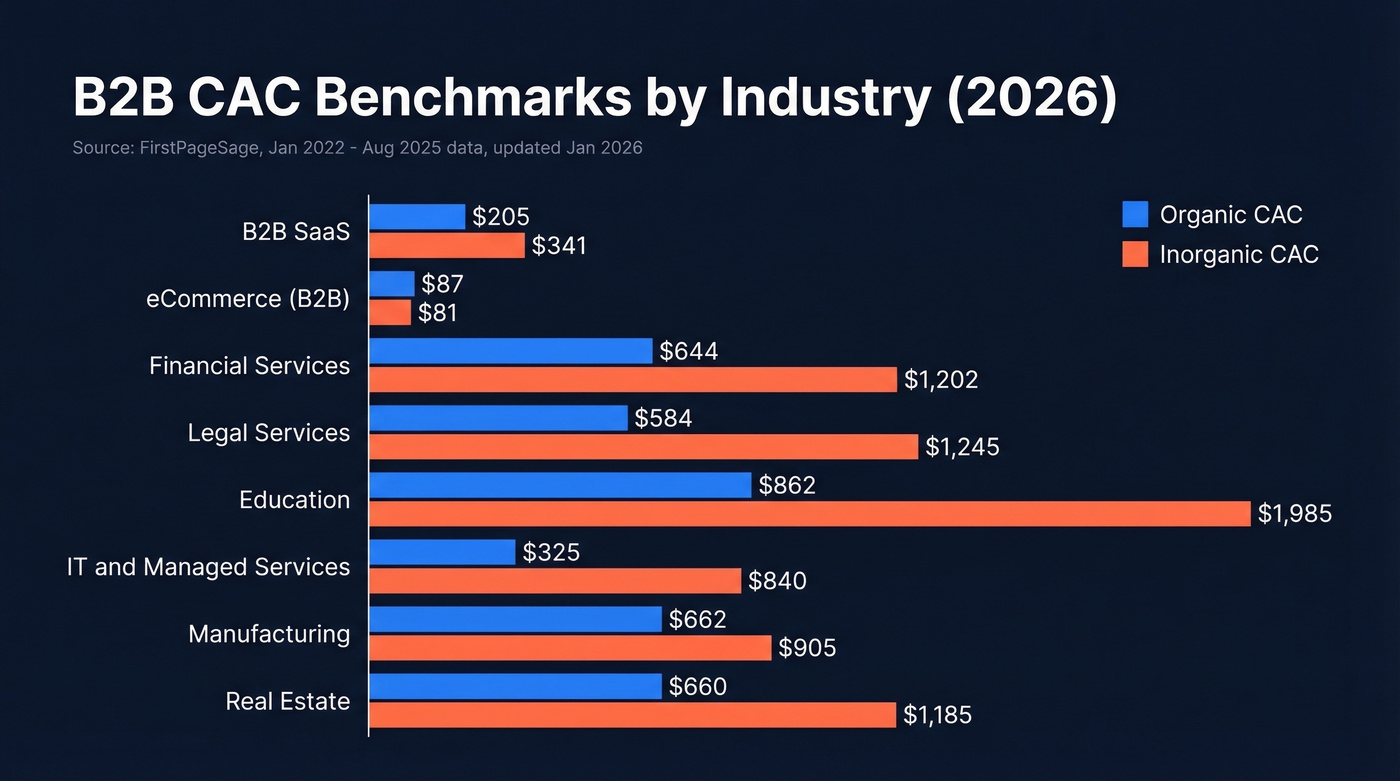
CAC Benchmarks by Industry
FirstPageSage published B2B CAC benchmarks based on client analytics from January 2022 through August 2025, updated in January 2026. Their combined average weights 75% organic and 25% inorganic, reflecting their client mix:
| Industry | Organic CAC | Inorganic CAC | Combined CAC |
|---|---|---|---|
| B2B SaaS | $205 | $341 | $239 |
| eCommerce (B2B) | $87 | $81 | $86 |
| Financial Services | $644 | $1,202 | $784 |
| Legal Services | $584 | $1,245 | $749 |
| Education | $862 | $1,985 | $1,143 |
| IT & Managed Services | $325 | $840 | $454 |
| Manufacturing | $662 | $905 | $723 |
| Real Estate | $660 | $1,185 | $791 |
A few things jump out. If your B2B SaaS CAC is above $350, you're spending more than most. Financial services and legal have eye-watering inorganic CAC - over $1,200 - which explains why those industries invest so heavily in content and SEO. eCommerce B2B is the outlier: organic and inorganic CAC are nearly identical, suggesting paid channels are unusually efficient there.
We've seen B2B SaaS companies with CAC above $400 that were perfectly healthy because their ACV justified it. A $1,200 CAC is fine if your average deal is $50k/year. It's catastrophic if you're selling $99/month subscriptions. Use these as directional benchmarks, not gospel.
LTV:CAC Ratio and Payback Period
CAC alone is meaningless. You need two companion metrics.
The LTV:CAC Ratio
The standard benchmark is 3:1 - for every dollar you spend acquiring a customer, you should earn at least three dollars back over their lifetime:
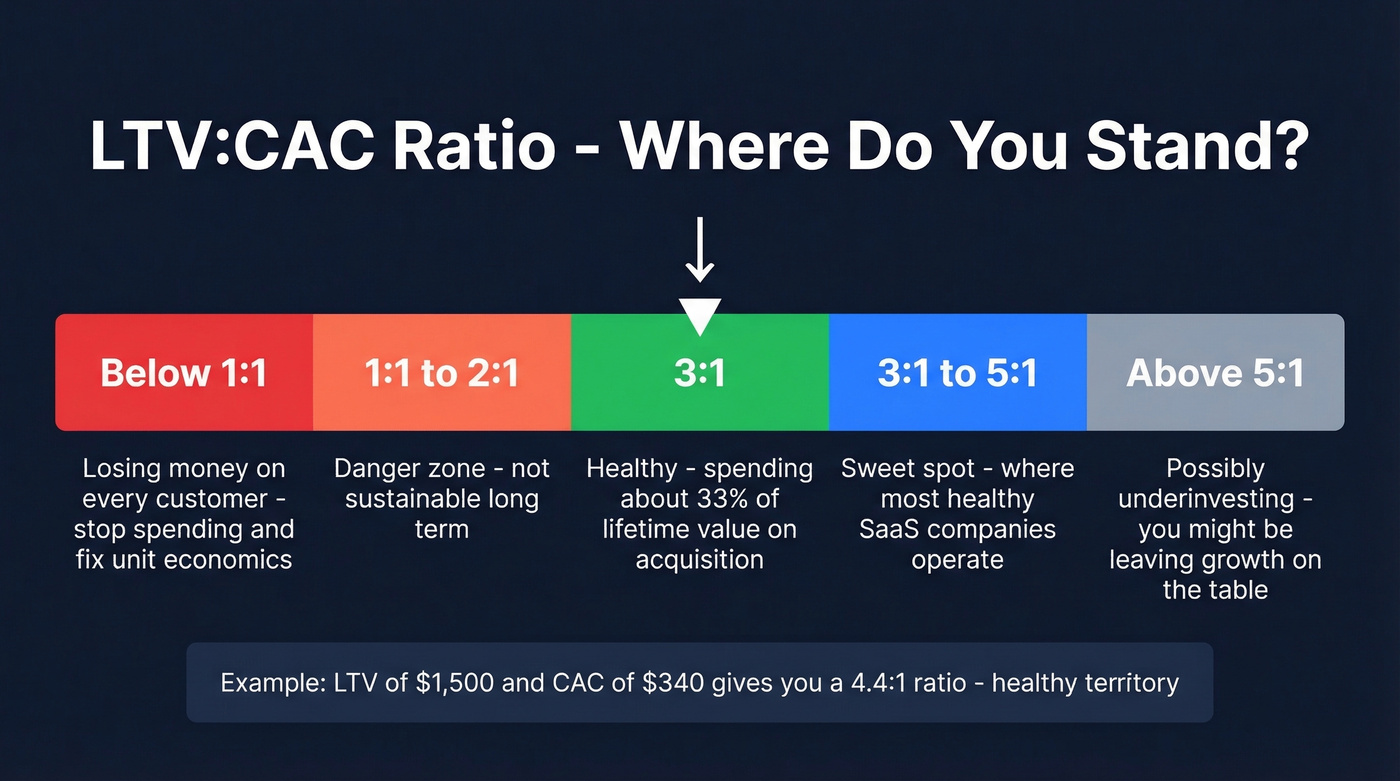
- Below 1:1 - you're losing money on every customer. Stop spending until you fix unit economics.
- 3:1 - healthy. You're spending roughly 33% of lifetime value on acquisition.
- Above 4:1 - possibly underinvesting. You might be leaving growth on the table.
Let's be honest: 3:1 is the minimum, not the goal. Most healthy SaaS companies operate between 3:1 and 5:1.
CAC Payback Period
This tells you how many months it takes to recoup your acquisition cost from a customer's gross margin:
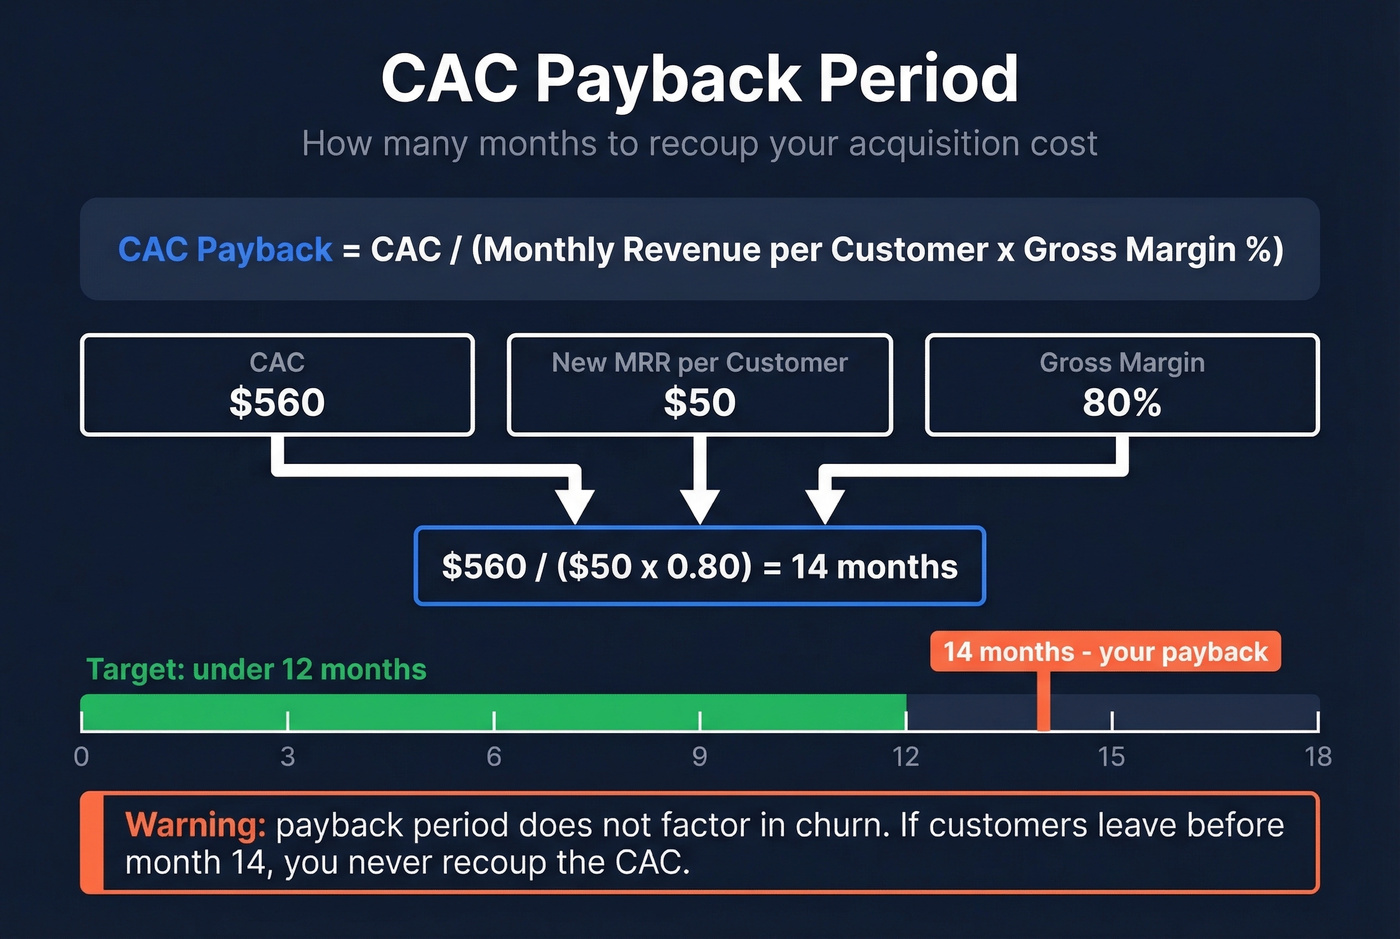
CAC Payback Period = CAC / (New MRR per Customer x Gross Margin %)
Worked example: your CAC is $560, average new MRR per customer is $50, and gross margin is 80%. Payback = $560 / ($50 x 0.80) = 14 months. That's above the benchmark of fewer than 12 months for viable SaaS startups.
One caveat worth flagging: payback period doesn't factor in churn. If customers churn before the payback window closes, you never recoup the CAC. That creates "CAC debt" - new customers are effectively subsidizing the unrecovered cost of churned ones. If you aren't tracking payback period alongside churn, you're flying blind.
Build a CAC Tracker in Google Sheets
You don't need expensive analytics software to track acquisition costs properly. A well-structured spreadsheet gets you 80% of the way there.
Set up Column A with your cost categories: paid ads, SDR salaries, AE commissions, CRM/tools, content production, agency fees, events. Column B holds the dollar amounts for the period. Add a SUM row at the bottom for total acquisition cost. On a separate tab, track date and new customers acquired per period, with its own SUM. Your CAC formula cell is simply: Total Acquisition Cost / Total New Customers.
For multi-period tracking, use SUMIFS to pull costs and customers by date range so you can see CAC trending over time. If you want a quick sanity check before building a full tracker, free online CAC calculators from Omnicalculator or Wall Street Prep work for back-of-napkin math.
The operational reality is that consolidating data across platforms - your ad accounts, CRM, billing system, event spend - takes 3-4 hours per week for most small teams doing it manually. That's worth automating early, even if it's just connecting Sheets to your ad platforms via Supermetrics or Looker Studio connectors.
How to Reduce Your CAC
Once you're measuring acquisition cost correctly, here's how to bring it down.
Improve conversion rates. Every percentage point improvement in your funnel conversion rate reduces CAC without spending an additional dollar. Add social proof, speed up your sales cycle, and A/B test landing pages relentlessly. This is the highest-impact move you can make. (If you need baselines, start with sales conversion rate benchmarks.)
Fix your data quality. If even 10% of your outbound list bounces, you're burning SDR hours and domain reputation on phantom prospects. Verify before you send - the cost of verification is a rounding error compared to the CAC inflation caused by dead contacts. (This ties directly to email bounce rate and deliverability.)
Double down on organic channels. In most B2B industries, organic CAC runs lower than inorganic. Content, SEO, and community take longer to build but compound over time. Shift budget gradually - don't kill paid overnight.
Segment and kill underperformers. Break your blended CAC into channel-level numbers. You'll almost certainly find one or two channels dragging the average up. Cut them or fix them. (A simple way to operationalize this is with funnel metrics by channel.)
Retain more customers. Every churned customer increases your effective CAC because you need a new customer to replace the lost revenue. Improving retention has an outsized impact on unit economics - sometimes more than any acquisition optimization. (If you're not already, run a basic churn analysis.)
Your fully loaded CAC includes every data tool, every SDR hour, and every dead-end dial. Prospeo replaces expensive, stale databases with 300M+ profiles refreshed every 7 days - so your sales spend actually converts. Teams book 26% more meetings versus ZoomInfo at 90% lower cost.
Shrink the numerator in your CAC formula starting today.
FAQ
What's a good CAC?
Aim for a 3:1 LTV:CAC ratio at minimum. B2B SaaS averages roughly $239 combined; financial services runs closer to $784. The number itself matters less than the ratio to lifetime value - a $1,200 CAC is healthy if your average contract is $50k/year.
Should I include salaries in CAC?
Yes. Always include SDR and AE salaries, commissions, and benefits. These are direct acquisition costs. Excluding them can understate your CAC by 2-4x, which means every budget decision based on that number is wrong.
How often should I measure CAC?
Monthly at minimum, quarterly for trend analysis. Align your measurement window to your average sales cycle - if deals take 60 days to close, a monthly snapshot will misattribute costs to the wrong customer cohort.
Is CAC the same as CPA?
No. CAC measures the cost to acquire a paying customer. CPA covers any conversion - a lead, a trial signup, or a free-tier activation. Conflating the two makes your acquisition economics look better than they are.
How does bad data affect CAC?
Every bounced email and wrong number is budget wasted on outreach that reaches nobody. Teams with 15-20% bounce rates effectively inflate CAC by that same percentage. Verifying contacts before you send - even at a fraction of a cent per email - eliminates that waste before campaigns launch.