How to Set Sales Team Objectives That Don't Destroy Your Team
An enterprise AE on r/sales shared a story that stuck with us. They'd crushed their number - $1.85M against a $1.7M quota, selling deals averaging $250K ACV. Management's response? Double the headcount, slice territories in half, strip one product from quota retirement, and hand out the same aggressive targets. That's not setting sales team objectives. That's organizational sabotage.
Around half of reps miss quota in any given year. The problem isn't lazy sellers. It's objectives built on vibes instead of math - and the human cost is real: burnout, constant job-hopping, and reps who stop trusting leadership entirely.
The Short Version
Pick 3-5 objectives max. One revenue target, one pipeline coverage ratio, one leading indicator per role. Ground every number in real benchmarks, not round numbers pulled from thin air. Review weekly on leading indicators, not quarterly on lagging ones. That's the entire framework. Everything below is the detail behind it.
What Are Sales Objectives?
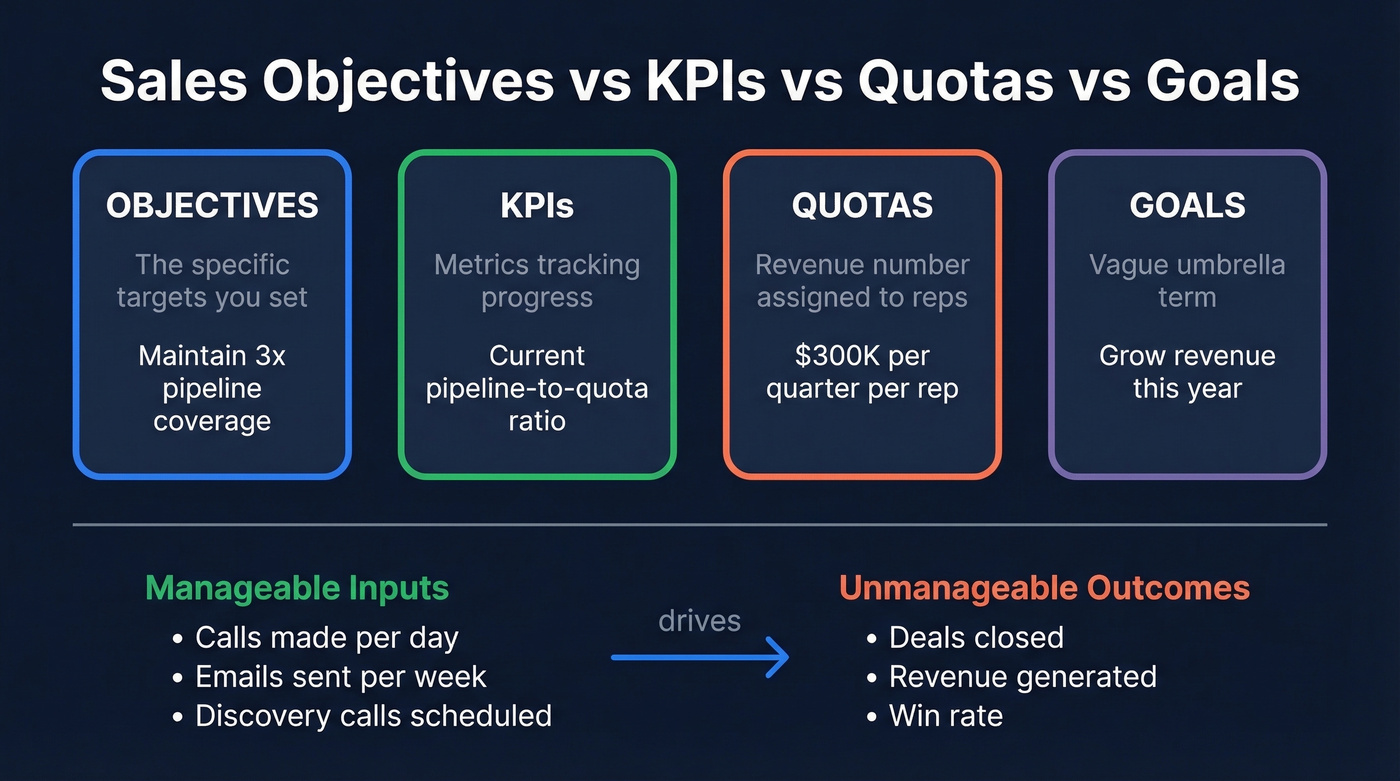
Sales team objectives are the specific, measurable outcomes you want your team to achieve within a defined period. They aren't the same as goals, KPIs, or quotas - though people use these terms interchangeably and create confusion.
The distinction that matters:
- Objectives - the targets you set (maintain 3x pipeline coverage)
- KPIs - the metrics tracking progress (current pipeline-to-quota ratio)
- Quotas - the revenue number assigned to individual reps
- Goals - the vague umbrella term covering all of the above
The most useful framework we've found separates objectives into manageable and unmanageable categories, popularized by Jason Jordan's Cracking the Sales Management Code. You can manage how many calls a rep makes. You can't directly manage how many deals close - that's an outcome of upstream activities. The best objectives focus on manageable inputs that drive unmanageable outcomes.
Setting Objectives With OKRs
Every sales management article tells you to make objectives SMART. Fine. It's also table stakes. If your objectives aren't specific and measurable in 2026, you've got bigger problems than a framework gap.
Where SMART falls short is connecting strategic ambitions to the daily activities reps actually control. OKRs (Objectives and Key Results) do this better, especially for teams above 10 reps where cascading targets from company revenue down to individual contributors matters most.
Two OKR templates adapted from Perdoo's sales OKR guide that we've seen work well in practice:
Pipeline Velocity OKR
- Objective: Accelerate pipeline throughput to hit Q3 revenue targets
- KR1: Reduce MQL-to-SQL conversion time from 7 days to 3 days
- KR2: Increase proposal-to-close ratio from 30% to 45%
- KR3: Increase early-stage disqualification rate from 15% to 30%
Deal Quality OKR
- Objective: Win bigger, better-fit deals
- KR1: Increase average deal size per rep from $250K to $325K
- KR2: Maintain win rates above 35%
- KR3: Reduce average sales cycle by 20%
Notice how the third key result in the pipeline OKR is about disqualifying faster, not just closing faster. That's the kind of nuance SMART goals rarely capture. OKRs force you to define what "better" looks like across multiple dimensions simultaneously.
Benchmarks for Realistic Targets
You can't set realistic objectives without knowing what "normal" looks like. Here are the numbers that matter, pulled from Outreach's 2026 benchmarks:
| Metric | Benchmark | Context |
|---|---|---|
| B2B win rate (all stages) | ~21% | 15-25% range is typical |
| Win rate (qualified opps) | ~29% | Qualification matters |
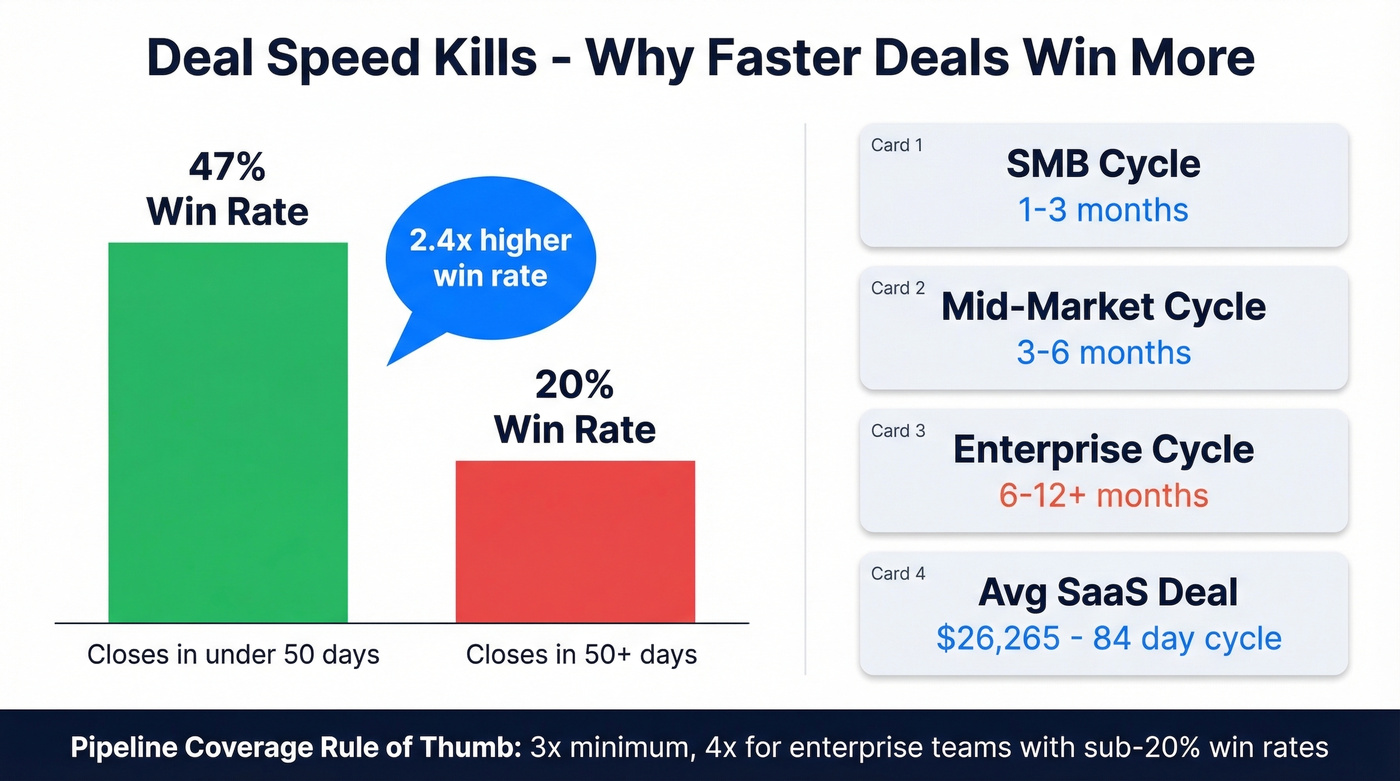
| Deals closing < 50 days | 47% win rate | Speed correlates with wins |
| Deals closing > 50 days | ~20% win rate | Stale deals die |
| Avg SaaS deal size | $26,265 | 84-day avg cycle |
| SMB cycle length | 1-3 months | Varies by product complexity |
| Mid-market cycle | 3-6 months | Multi-stakeholder buying |
| Enterprise cycle | 6-12+ months | Procurement adds weeks |
| Professional services | 28% / 51 days | Higher win rate, fast cycle |
| Real estate/construction | 16% / 147 days | Low win rate, long cycle |
The deal velocity relationship is the most actionable insight here. Deals that close within 50 days win at more than double the rate of deals that drag past that mark. If your team's average cycle is creeping upward, that isn't just a speed problem - it's a win-rate problem.
Pipeline coverage of 3x is the standard practitioners reference on Reddit and in most sales orgs. If your quarterly target is $300K, you need $900K in qualified pipeline. Some enterprise teams run 4x to account for longer cycles and lower win rates.
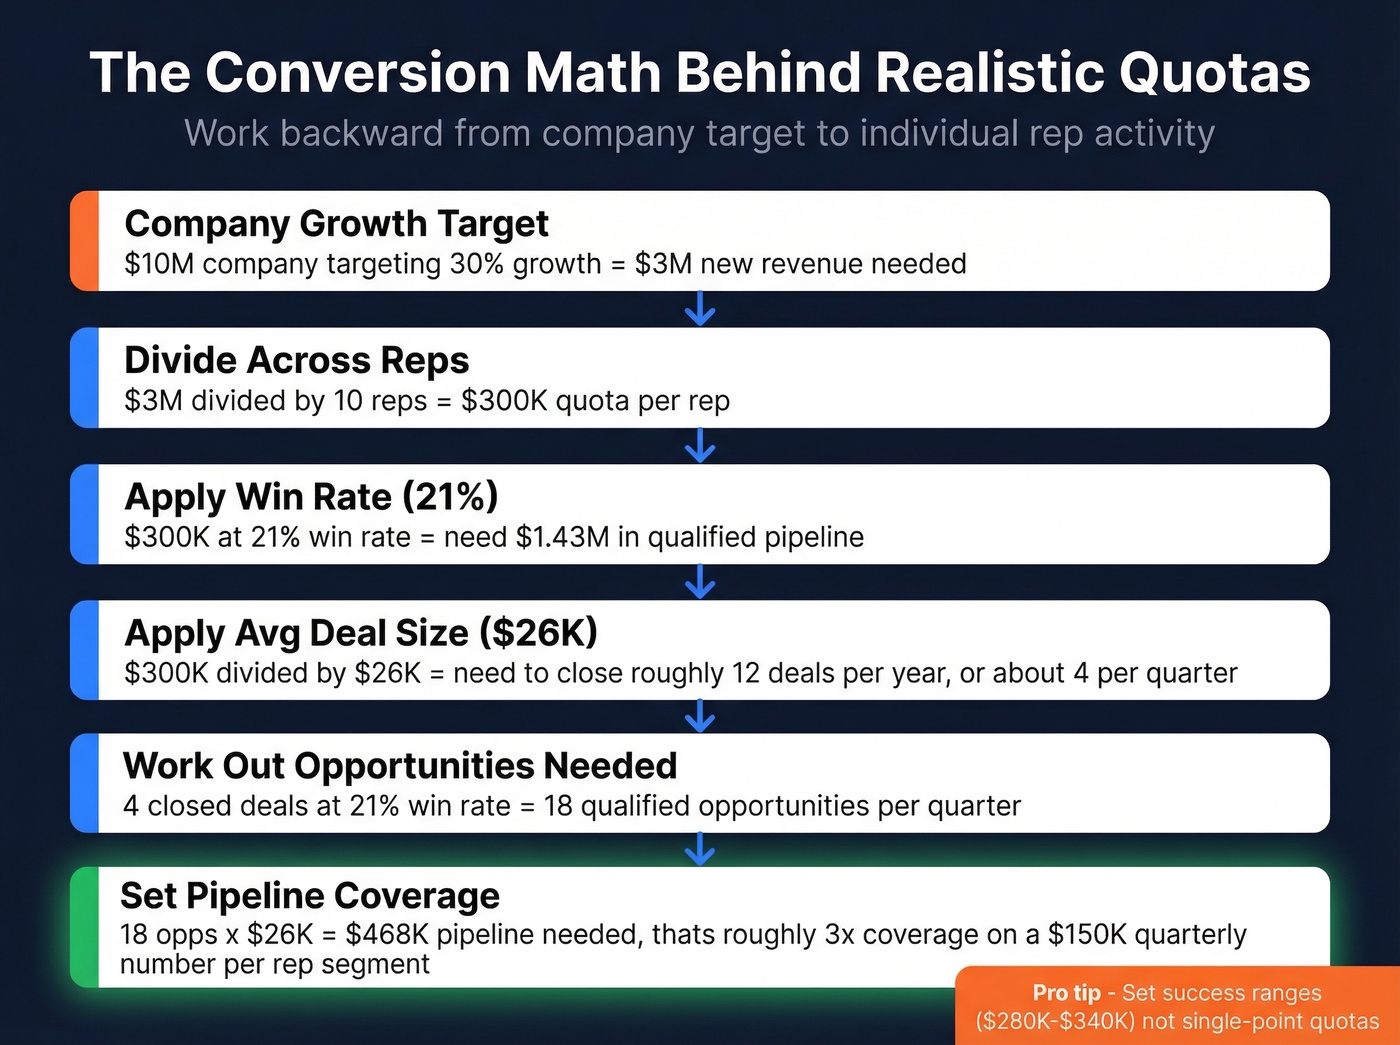
Here's the thing: most teams should also set objectives as ranges, not single numbers. A "success range" of $280K-$340K with tiered incentives at each threshold is more motivating and more honest than a flat $300K target. Single-point quotas create a binary pass/fail that demoralizes reps who land at 95% - which is absurd when half of all reps miss entirely.
Pipeline coverage objectives mean nothing without verified contacts behind them. Prospeo gives your reps 300M+ profiles with 98% email accuracy and 125M+ direct dials - refreshed every 7 days. When every rep needs 18 qualified opportunities per quarter, bad data isn't a nuisance. It's a quota killer.
Stop setting objectives your data can't support.
Eight Objectives Worth Setting
Not 15 objectives. Not 20. Eight, grouped into three clusters. The key is pairing each quantitative target with behavioral goals that shape how reps sell, not just what they close.
Revenue Growth
If your average deal is $26K and your win rate is 21%, each rep needs roughly 18 qualified opportunities per quarter to close 4 deals. Work backward from the company target to individual rep quotas using real conversion rates, not aspirational ones. A $10M company targeting 30% growth needs $3M in new revenue, decomposed across reps by territory and segment.
SMART example: Increase new business revenue from $2.4M to $3.1M by Q4 2026.
Pipeline Coverage
3x minimum. 4x for enterprise teams with sub-20% win rates.
Weekly pipeline audits catch problems that quarterly reviews miss entirely. If a rep's coverage drops below 2.5x in week three, you still have time to course-correct. Wait until the quarterly business review and you're just documenting the damage.
SMART example: Maintain 3.5x pipeline-to-quota ratio, measured weekly. (If you need a tighter definition of what “healthy” looks like, use a pipeline health scorecard.)
Average Deal Size
The lever is multi-threading into economic buyers. Reps who only talk to one stakeholder sell smaller deals because they never reach the person who can approve a larger scope. One OKR framework we've seen targets moving average deal size from $250K to $325K - that kind of lift comes from selling to the right people, not from better closing techniques. The SaaS average sits around $26,265; your number depends on segment and product.
SMART example: Increase average closed-won deal size from $22K to $28K by end of H1 2026.
Win Rate
Here's a stat worth pinning to the wall: win rates are 4.4x higher when reps discuss specific next steps on calls. Not vague "let's circle back" - concrete next steps with dates and owners. That's a behavioral change that costs nothing to implement, and it compounds over time.
The average B2B win rate is 21% overall, 29% on qualified opportunities. If your team is consistently below 15%, the problem is qualification, not closing.
SMART example: Improve qualified opportunity win rate from 24% to 30% by Q3 2026. (To pressure-test your funnel math, compare against sales conversion rate benchmarks.)
Sales Cycle Length
The counterintuitive tactic: disqualify faster. Target increasing early-stage disqualification from 15% to 30%. Killing bad deals early frees reps to focus on winnable ones, which compresses the average cycle for deals that actually close. Remember - deals closing under 50 days win at 47% vs 20% for longer cycles.
SMART example: Reduce average mid-market sales cycle from 95 days to 75 days by Q4 2026.
Forecast Accuracy
This is the single most impactful objective most teams ignore. CRM adoption alone can boost forecast accuracy by 42%. When your forecast is reliable, every downstream decision - hiring, marketing spend, capacity planning - gets better. When it's off by 30%, you're flying blind. Track this on a rolling 90-day window and aim for plus-or-minus 8% variance.
SMART example: Achieve 92% forecast accuracy on a rolling 90-day basis by end of Q2 2026. (If you’re rebuilding your process, start with sales forecasting solutions and a clear sales forecast vs sales goal definition.)
Outbound Activity
Let's do the math. 50 calls x 8% connect rate x 25% meeting rate = 1 meeting per day from calls alone. Add email sequences and you're in the 1.5-2 range. But activity targets collapse when bounce rates hit 35-40% - your math becomes fiction. Snyk ran into exactly this problem: bounce rates of 35-40% meant their 50 AEs were burning hours on dead addresses. After switching to Prospeo for verified contact data, bounces dropped under 5% and AE-sourced pipeline jumped 180%.
SMART example: Each SDR delivers 80 verified emails and 50 calls per day, generating 1.5 qualified meetings daily. (If you need a menu of what to track, use these sales activities examples.)
Qualification Rate
MQL-to-SQL conversion varies wildly by source - inbound typically converts at 15-25%, outbound at 5-15%. Layer intent signals and technographic data to score leads before they hit the SDR queue. A rep spending time on a company actively researching your category is far more likely to convert than one cold-called from a static list.
SMART example: Increase MQL-to-SQL conversion rate from 12% to 18% by Q3 2026. (For a tighter system, align on lead scoring and an ideal customer profile.)
Cascading Objectives by Role
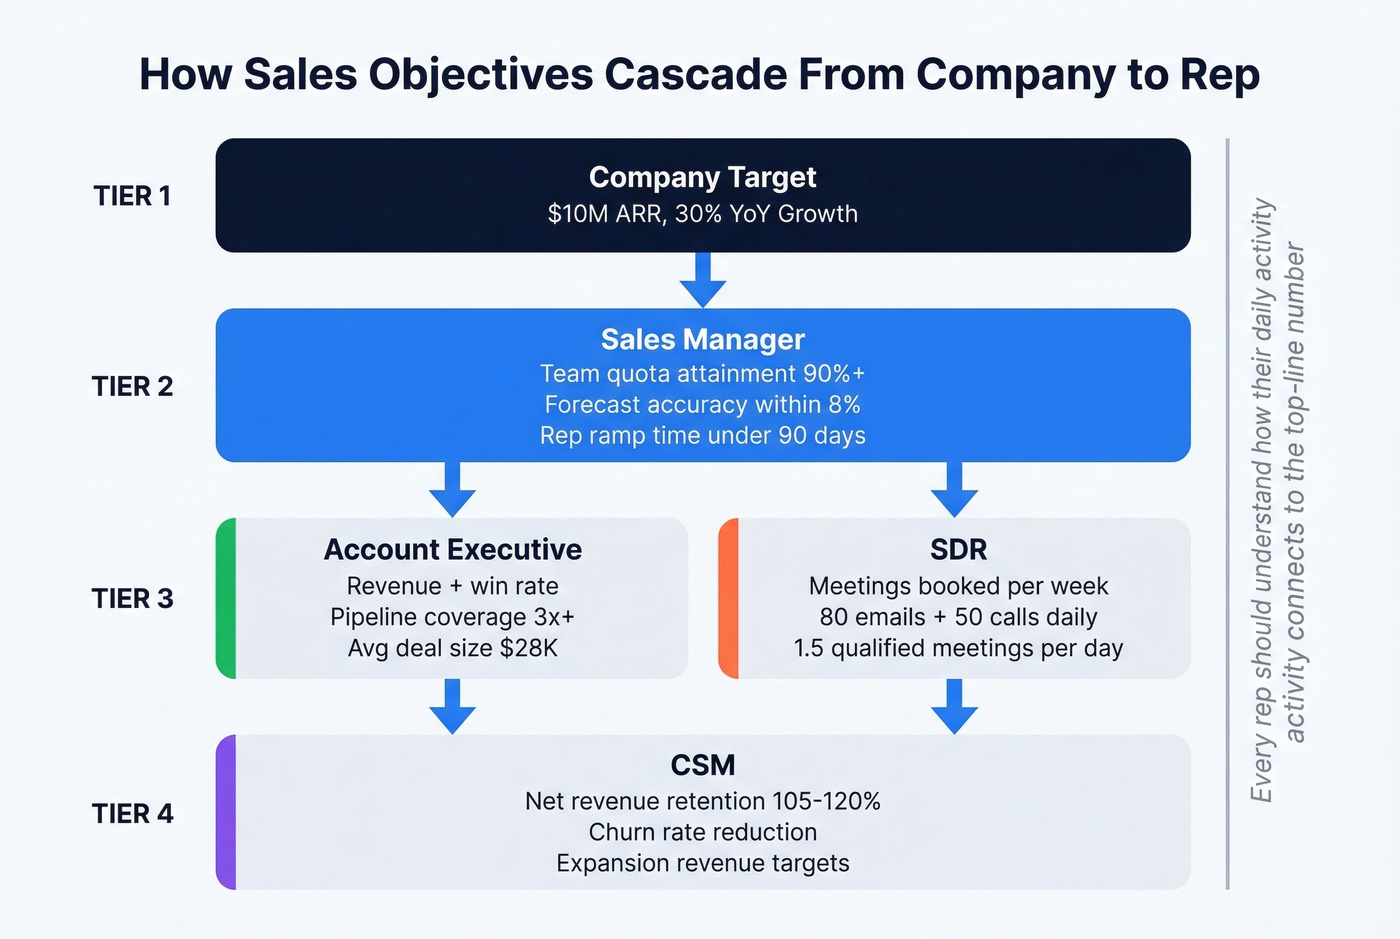
Different roles need different primary objectives. The most effective orgs cascade targets from the company number down through managers to individual contributors, so every rep understands how their daily activity connects to the top-line target.
| Role | Primary Objective | Leading Indicator | Benchmark |
|---|---|---|---|
| SDR | Meetings booked | Calls + emails/day | 8 touches before a meaningful connection |
| AE | Revenue + win rate | Pipeline coverage | 3x minimum |
| Sales Manager | Team quota attainment | Forecast accuracy + rep ramp time | 90%+ rolling |
| CSM | Net revenue retention | Churn rate + expansion | NRR 105% to 120% |
The CSM row deserves attention. Moving net revenue retention from 105% to 120% is the difference between a company that grows and one that's on a treadmill. CSM objectives should include expansion revenue, not just retention. Skip this if your team doesn't have dedicated CSMs - but if you do, these targets matter as much as new-business numbers.
Leading vs. Lagging Indicators
Most teams obsess over lagging indicators - revenue, win rate, average deal size. These tell you what already happened. Leading indicators tell you what's about to happen, and they're where weekly reviews create real impact.
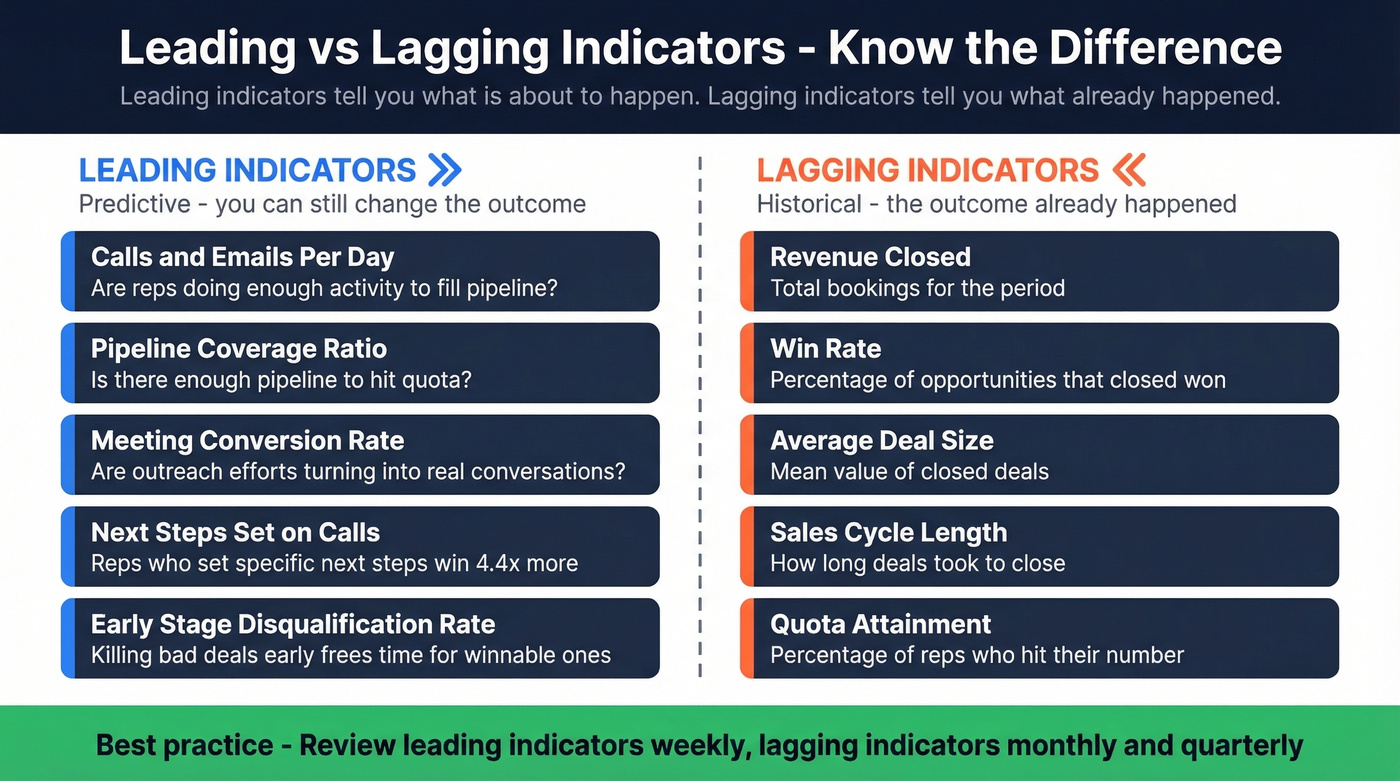
Here's how leading indicators map to deal stages, adapted from DocBeacon's framework:
| Deal Stage | Leading Indicators | What They Predict |
|---|---|---|
| Early | Pipeline velocity, qualification rate | Future pipeline health |
| Mid | Multi-threading rate, engagement depth | Deal progression likelihood |
| Late | Proposal engagement, response time | Close probability |
The proposal engagement data is striking. Proposals opened within 24 hours where the buyer spends 8+ minutes reading close at a 67% rate. Proposals never opened close at 2%. That's a 33x gap. If your team isn't tracking proposal engagement as a leading indicator, you're missing the single best predictor of late-stage deal outcomes.
Weekly leading-indicator reviews catch problems well before quarterly reviews do. A rep whose multi-threading rate drops in week two is a rep whose Q3 number is at risk. You can intervene now, or you can find out in October.
Five Mistakes That Kill Objectives
Unrealistic quotas disconnected from territory math. Remember that Reddit AE who hit $1.85M and got rewarded with a halved territory and the same targets? This happens everywhere. If you double headcount, adjust quotas proportionally - don't just hope new reps "ramp fast." (If you’re trying to rebuild trust after changes like this, start with sales leadership trust.)
Activity goals without conversion math. "Make 50 calls a day" means nothing without knowing your connect rate, meeting conversion rate, and pipeline value per meeting. Fifty calls in the dark is busywork, not a strategy.
No role or segment segmentation. An SDR selling into SMB and an AE closing enterprise deals can't share the same objectives. Cycle lengths, deal sizes, and conversion rates differ dramatically across segments.
Ignoring data quality. Bad data is the silent killer of activity-based objectives. If 20% of your emails bounce, your activity math is fiction - reps are hitting targets on paper while pipeline starves. Prospeo's 98% email accuracy and 7-day refresh cycle keep bounce rates under 4%, so your numbers reflect reality. (If you want to quantify the impact, track email bounce rate alongside activity.)
Annual-only reviews. If you're reviewing objectives once a quarter, you're already dead by Q2. Weekly reviews on leading indicators, monthly on lagging ones. One team smashed records chasing a $50 gas card - the point isn't the prize, it's the frequency of feedback loops.
Multi-threading into economic buyers is how you grow average deal size - but only if your team can actually reach them. Prospeo's 30+ filters let reps target by seniority, department headcount, funding stage, and buyer intent across 15,000 topics. At $0.01 per verified email, scaling outreach to the right stakeholders doesn't blow your budget.
Give your reps the contacts that move deal size and win rates upward.
FAQ
How many sales objectives should a team have?
Three to five per role - one revenue target, one pipeline coverage ratio, and one leading indicator. Beyond five priorities, focus dilutes and none get the attention they need.
What's a realistic B2B win rate?
The average B2B win rate is 21% across all stages and 29% on qualified opportunities. If you're consistently below 15%, the problem is a broken qualification process, not a closing skills gap.
How often should you review sales objectives?
Weekly on leading indicators like pipeline generation and qualification rate. Monthly on lagging indicators like revenue and win rate. Quarterly-only reviews miss problems by 10+ weeks - long enough to tank an entire quarter before anyone notices.
How do you make sure outbound activity targets are achievable?
Work backward from conversion math and verify your contact data first. At an 8% connect rate and 25% meeting conversion, 50 calls yields one meeting - but only if those contacts are real. Bad data turns your activity math into fiction, and reps lose trust in the targets fast.