SDR Metrics: 2026 Benchmarks, Targets, and What Actually Moves the Needle
83.4% of SDRs fail to consistently hit quota. Cold email reply rates have slid from 6.8% in 2023 to 5.8% today, the average company takes 42 hours to respond to an inbound lead, and 63% never respond at all. The channels are harder, buyers are noisier, and most SDR teams are measuring the wrong things - or measuring the right things with garbage data underneath.
The teams that do hit quota aren't working harder. They're tracking smarter SDR metrics, fixing upstream problems, and spending less time in CRM than on the phone.
Three Metrics That Predict Revenue
If you only track three things, track these:
- Meetings booked per month. This is your leading indicator. Median is 8-10, top quartile hits 12-15. Below 8, something upstream is broken.
- Show rate. 80% is average. Below that, your qualification or confirmation process needs work. Above 85%, you're running a tight ship.
- Pipeline generated. Meetings mean nothing without pipeline. SDRs at sub-$25k ACV companies should generate ~$191k/month. Higher ACV motions push $600-700k.
Everything below expands on these three - the full metric hierarchy, tiered benchmarks, and the upstream problem most teams ignore entirely.
The Four KPI Categories
Sales development metrics follow a hierarchy: Activity → Efficiency → Quality → Outcome. The critical insight is that upstream metrics corrupt everything downstream. Bad contact records poison your efficiency numbers, mislead your quality indicators, and guarantee disappointing outcomes. We'll come back to this - it's the single biggest lever most teams aren't pulling.
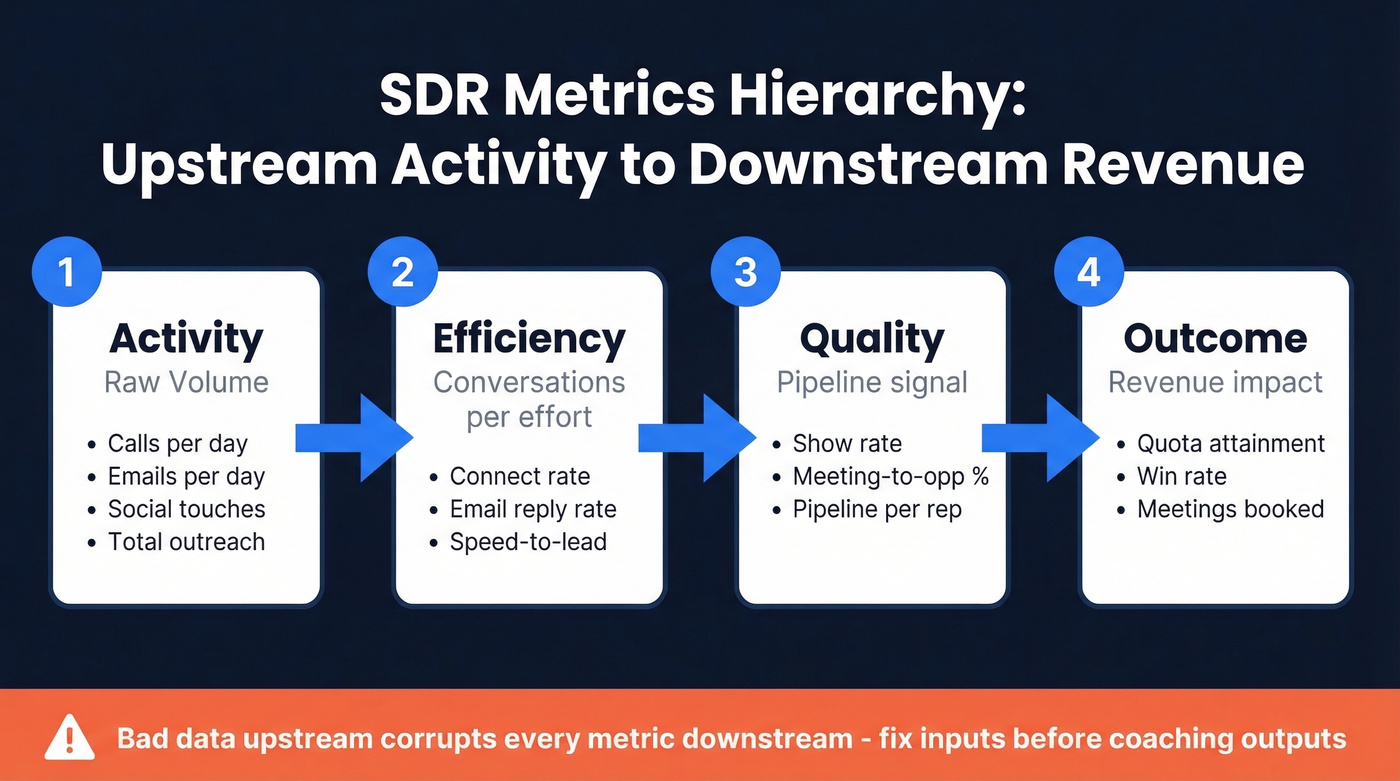
Here's each layer with 2026 benchmarks from real datasets.
Activity Metrics
Activity is the foundation - raw volume of outreach. But volume without targeting is noise. The Optifai benchmark, covering 939 companies from Q1-Q3 2025, gives us clean top-quartile tiers, and median estimates below use commonly cited Operatix/Bridge Group ranges.
| Activity Type | Median (range) | Top Quartile |
|---|---|---|
| Outbound calls/day | 40-50 | 70-80 |
| Cold emails/day | 10-40 | 45-55 |
| Social touches/day | 15-25 | 25-35 |
| Total outreach/day | 80-100 | 140-170 |
Beyond daily volume, two numbers matter for activity planning: 16 touchpoints per account and 75-125 accounts per rep at any given time. If your reps are working 300+ accounts, they're spreading too thin to execute meaningful sequences.
The "activity trap" is real. Teams pushing 80+ calls/day with terrible lists consistently underperform teams doing 50 calls with researched, verified contacts. Brute-force dialing just doesn't hold up anymore.
Efficiency Metrics
Efficiency tells you whether activity is translating into conversations - and this is where data quality separates good teams from great ones. These are the sales metrics for SDRs that reveal whether your process is working or just busy.
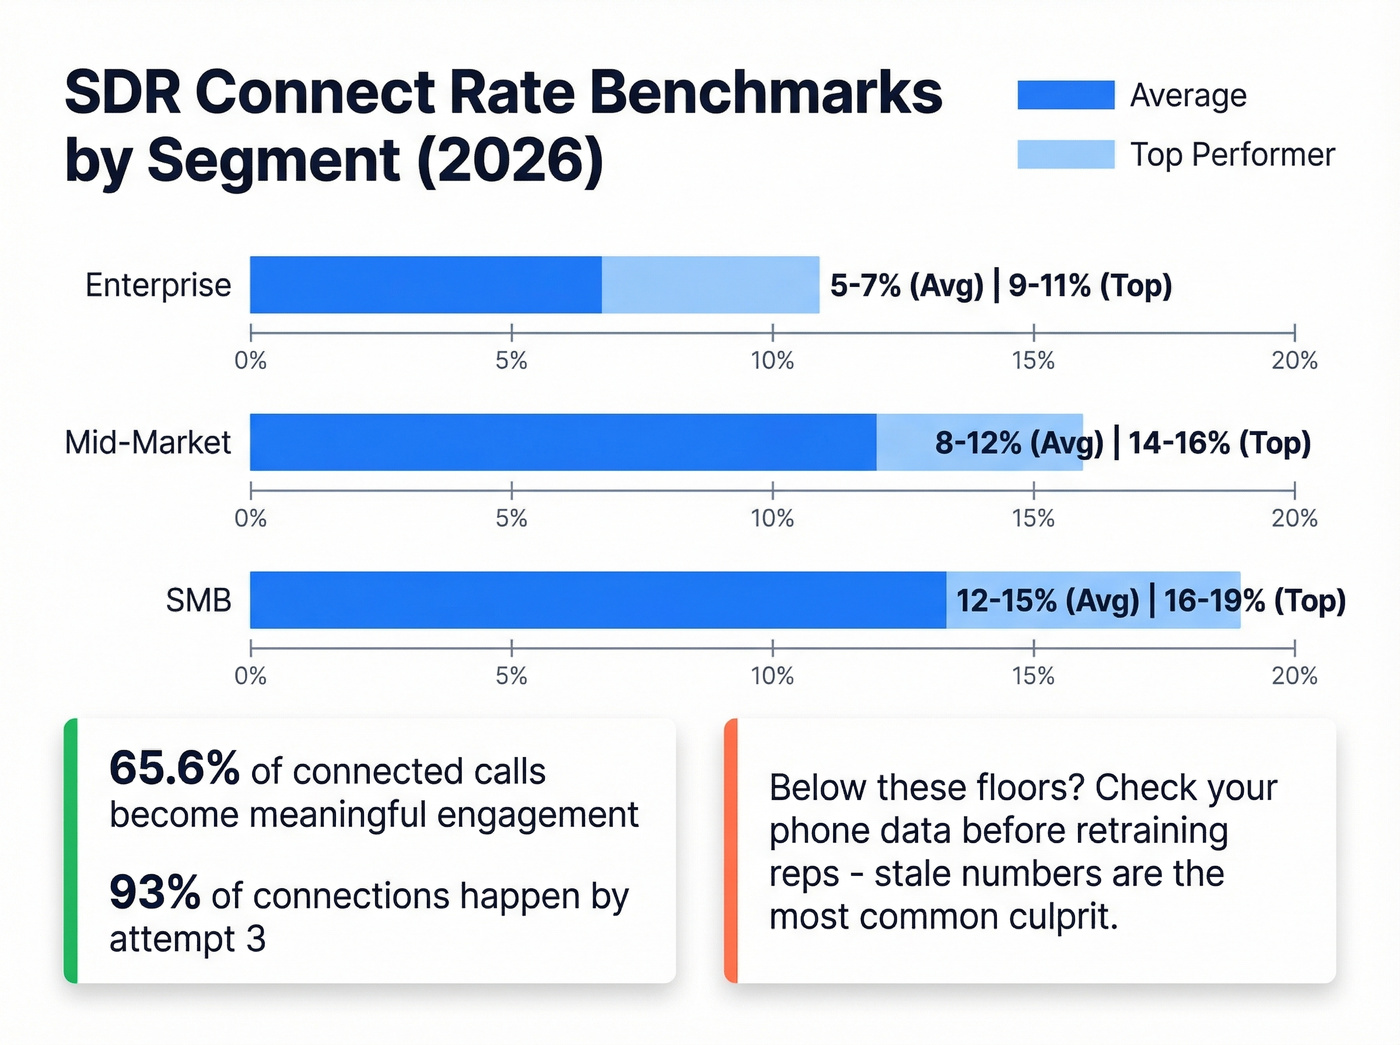
Start with connect rates. A study of 55,000 dials found a 16.6% overall connect rate, but your segment matters enormously. Enterprise runs 5-7% on a good day, mid-market sits at 8-12%, and SMB teams see 12-15%. Top performers in each segment push 2-4 points higher. If you're consistently below these floors, check your phone data before retraining reps - stale numbers are the most common culprit.
Here's a stat that should reshape how you coach: once connected, SDRs convert 65.6% of conversations into meaningful engagement. 93% of those connections happen by the third call attempt. Getting through is the hard part. If your reps can dial accurate numbers and reach attempt three, the math works in their favor.
| Metric | Average | Good | Top Performer |
|---|---|---|---|
| Email reply rate | 5.8% | 7-8% | 10%+ |
| Meetings per connect | 20-25% | 25-30% | 30%+ |
| Speed-to-lead (inbound) | 42 hours | <1 hour | <5 minutes |
Cold email reply rates average 5.8% across 16.5M emails analyzed. Thursday sends outperform Monday by about 30%, emails in the 6-8 sentence range hit a 6.9% reply sweet spot, and removing open-tracking pixels lifts response rates by roughly 3%.
Speed-to-lead is the efficiency metric nobody wants to talk about. Only 7% of companies respond within five minutes, yet 78% of buyers purchase from the first company that responds. If your inbound SDRs aren't measured on response time with a sub-60-minute SLA, you're leaving revenue on the table.
Quality Metrics
Quality metrics separate pipeline from noise. These are the KPIs your CRO actually cares about - and the diagnostic checklist for figuring out where your funnel leaks.
Is your show rate below 80%? Every point below that represents meetings your reps worked to book that evaporated. Fix your confirmation cadence - a same-day reminder plus a morning-of text - before trying to book more meetings.
Is your meeting-to-opportunity conversion below 50%? Your reps are booking meetings with the wrong people. Tighten your ICP definition and qualification criteria.
Is your pipeline per rep below $191k/month at sub-$25k ACV? That's the median. If you're below it, the problem is usually upstream - either not enough meetings or meetings with contacts who can't buy.
SDRs generate 46-73% of total pipeline depending on the org. That's not a supporting function - that's the revenue engine. Top-performing teams push show rates above 90% and meeting-to-opportunity conversion above 50%.
Outcome Metrics
This is the final scorecard:
| Metric | Average | Good | Top Performer |
|---|---|---|---|
| Quota attainment | 56-60% | 70% | 80%+ |
| Win rate (SDR opps) | 22% | 30% | 40%+ |
| Meetings booked/month | 8-10 | 12-15 | 18+ |
Median SDR-generated pipeline sits at $3M annually across 351 B2B companies with a $50k median ASP. If your SDRs are materially below that, you've got a structural problem - not just a rep problem.
Win rate on SDR-sourced opportunities tells you whether your team is booking meetings with the right people. Below 22% means the issue isn't closing - it's qualification.
Here's the thing: if your average deal size is under $10k, you probably don't need most of these metrics at all. Track meetings booked, show rate, and pipeline generated. Everything else is overhead that slows down a motion that should be fast and high-volume.
Inbound vs. Outbound: Different KPIs
This is a gap most guides skip, and it matters. Inbound and outbound SDRs should be measured on fundamentally different primary metrics.
Inbound SDRs live and die by speed-to-lead and lead response SLAs. Their activity numbers matter less - what matters is how fast they respond and how well they qualify. Track response time in minutes, not hours. Track qualification accuracy by measuring meeting-to-opportunity conversion. An inbound SDR booking 6 highly qualified meetings per month can outperform an outbound rep booking 12 unqualified ones.
Outbound SDRs are measured on activity volume, connect rates, and meetings booked from cold outreach. Their efficiency numbers - particularly calls-to-connect and reply rates - are the coaching levers. Outbound reps should also track accounts worked per week and multi-touch sequence completion rates.
Blending these two motions into a single dashboard is how teams end up with performance data that looks fine on paper but masks real problems.
Channel Conversion Benchmarks
Not all channels convert equally, and multi-touch sequences are the clear winner:
| Channel | Conversion to Meeting | Best For |
|---|---|---|
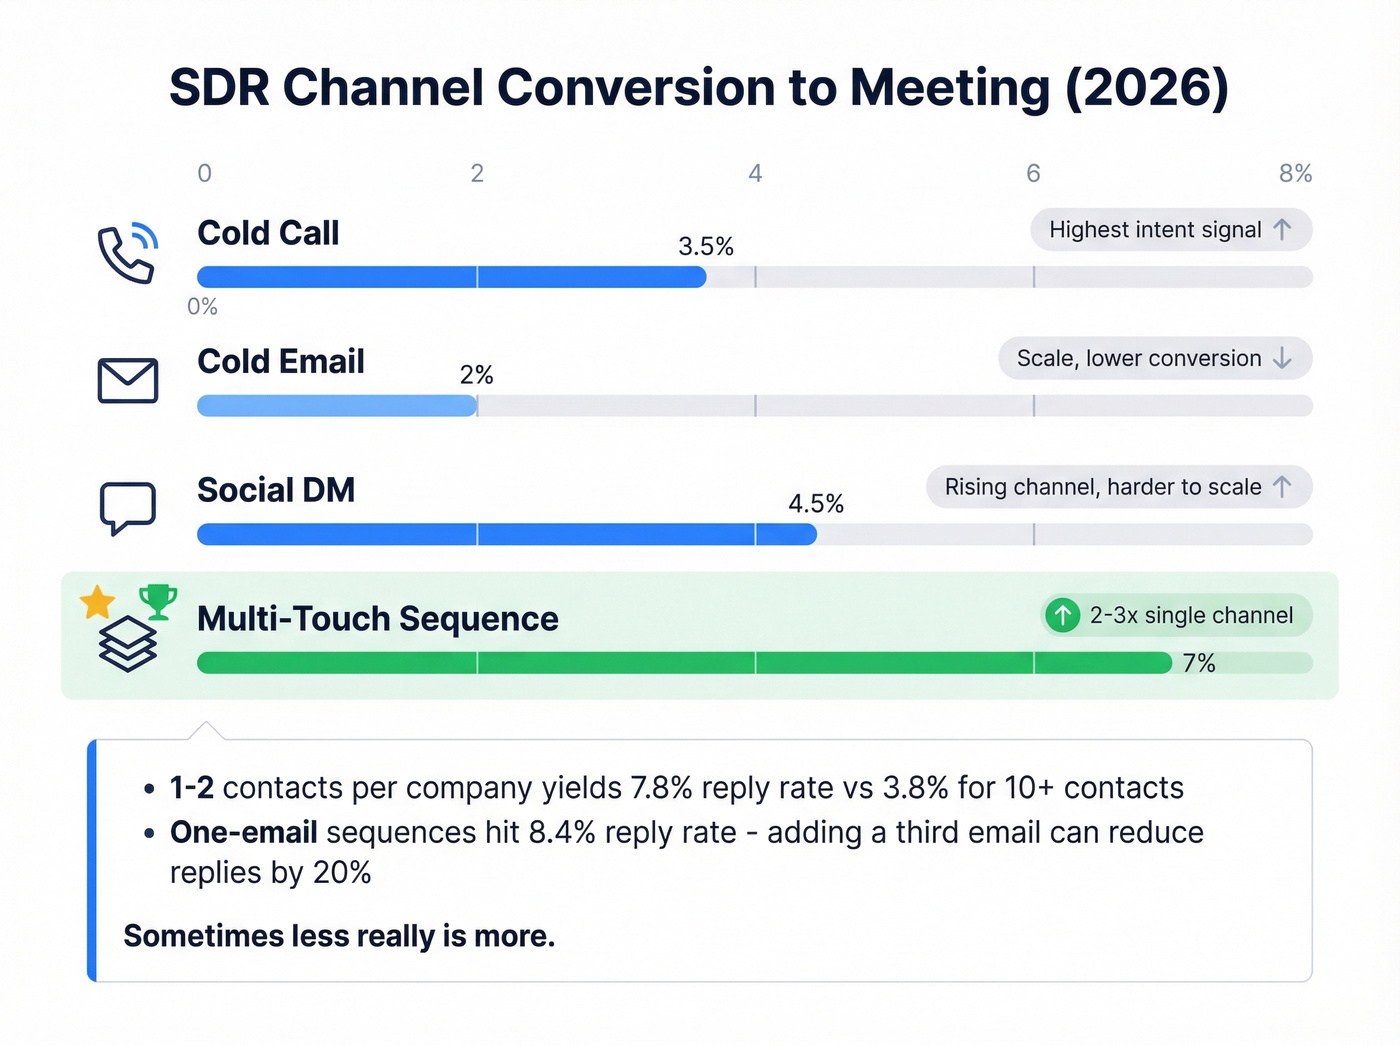
| Cold call | 2-3.5% | Highest intent signal |
| Cold email | 0.8-2% | Scale, lower conversion |
| Social DM | 2-4.5% | Rising channel, harder to scale |
| Multi-touch sequence | 4-7% | 2-3x single-channel |
Build your cadence around multi-touch sequences. The data is unambiguous: they convert 2-3x better than any single channel alone.
A few email execution details worth flagging: contacting 1-2 people per company yields a 7.8% reply rate, but spraying 10+ contacts at the same company drops it to 3.8%. One-email sequences actually hit 8.4% reply rates - adding a third email can reduce replies by up to 20%. Sometimes less really is more.
You just read it: 65.6% of connected calls turn into meaningful engagement, and 93% of connections happen by attempt three. The bottleneck isn't your reps - it's reaching real people. Prospeo's 125M+ verified mobiles hit a 30% pickup rate, and every record refreshes every 7 days - not the 6-week industry average that tanks your connect rates.
Stop coaching reps on skills when stale numbers are the real problem.
Where SDR Time Actually Goes
The uncomfortable reality of SDR time allocation:
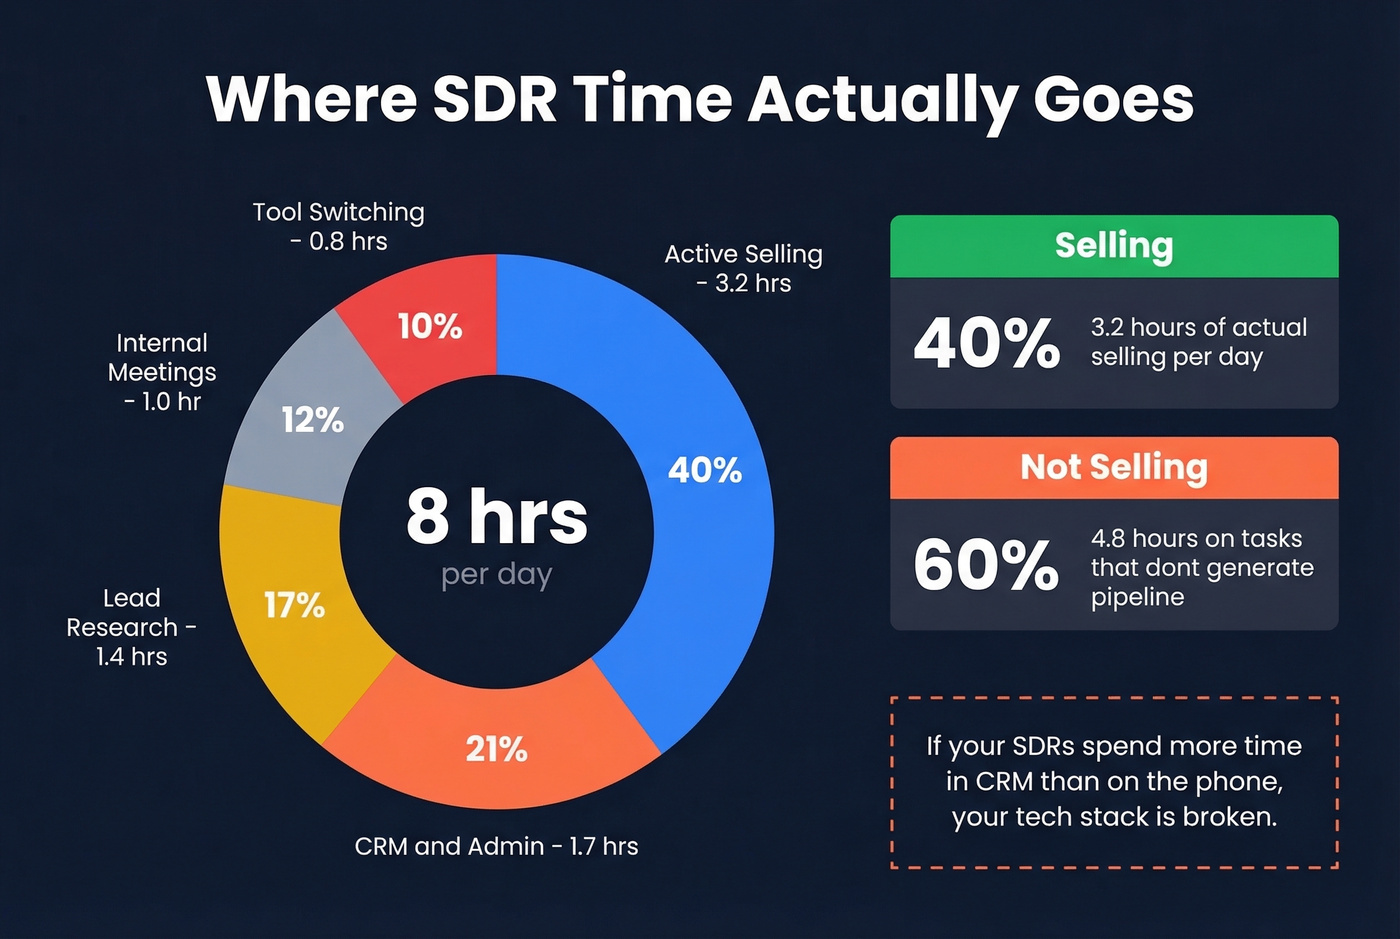
- 40% active selling - 3.2 hours per day
- 21% CRM and admin - 1.7 hours
- 17% lead research - 1.4 hours
- 12% internal meetings - 1.0 hour
- 10% tool switching - 0.8 hours
Reps spend 60% of their time on non-selling tasks. If your SDRs spend more time in CRM than on the phone, your tech stack is broken. That 17% on lead research is particularly telling - reps doing manual prospecting work that should be automated or pre-loaded into sequences with verified contact data.
Data Quality: The Upstream Multiplier
Every SDR metrics conversation focuses on rep behavior - more calls, better scripts, tighter qualification. Almost nobody talks about the upstream input that makes all of those measurements possible: contact data quality.
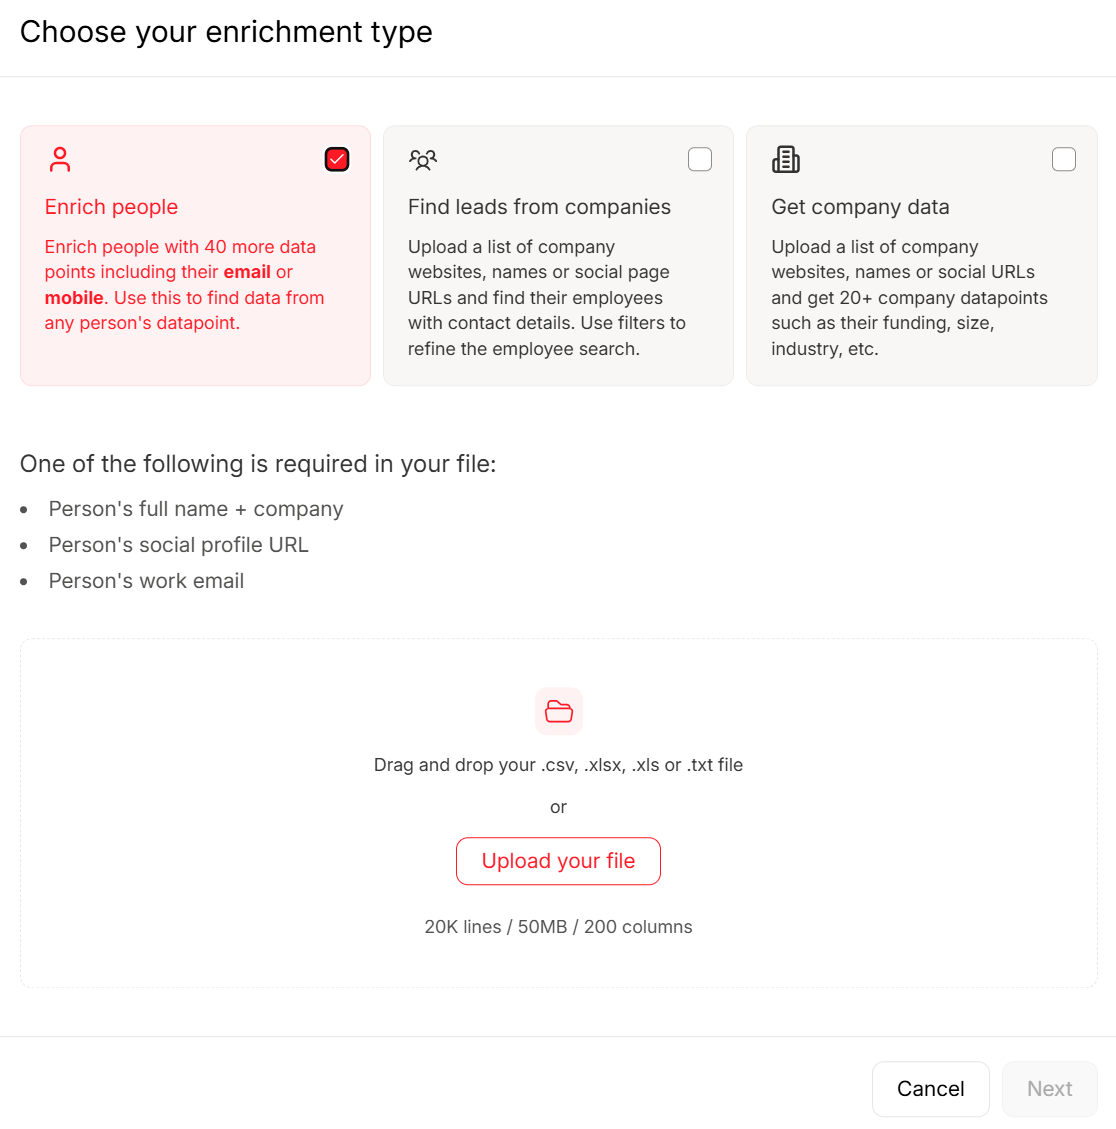
If you're trying to fix this systematically, start with data enrichment and a repeatable lead generation workflow so your SDRs aren't rebuilding lists from scratch every week.
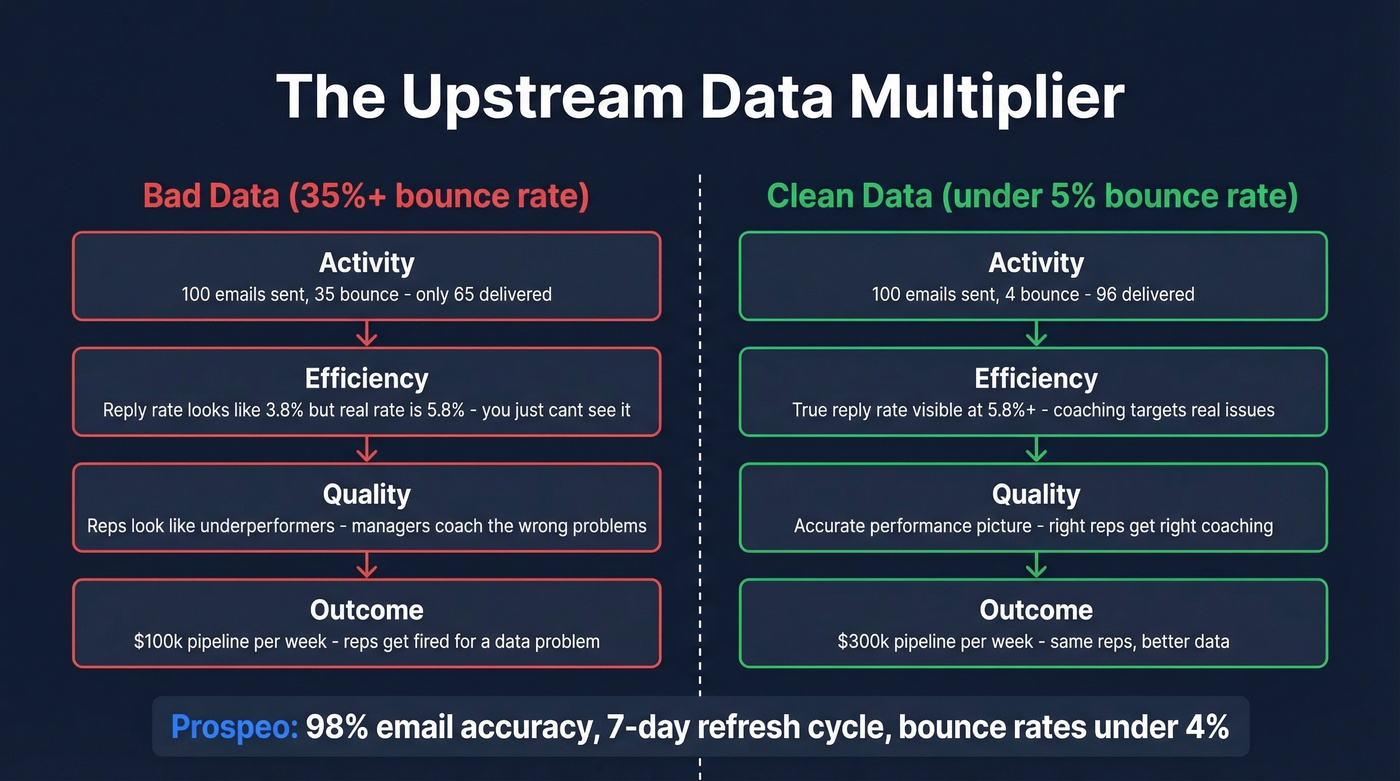
The cascade is brutal. A 35-40% email bounce rate means your activity numbers overstate effort, your efficiency numbers understate rep skill, and your outcome numbers paint a picture of underperformance that's really a data problem. We've watched teams fire reps over "low performance" that was actually a list quality issue. It's infuriating.
We've seen this play out repeatedly in our own customer base. Meritt was running a 35% bounce rate - emails bouncing, dials hitting dead numbers, the team looking like underperformers. After switching to Prospeo's verified email database with 98% email accuracy and a 7-day data refresh cycle, bounce rates dropped under 4%, connect rates tripled to 20-25%, and pipeline went from $100k to $300k per week. Snyk had a similar story: 50 AEs prospecting 4-6 hours per week with 35-40% bounce rates. After implementing verified data, bounce rates fell under 5% and AE-sourced pipeline jumped 180%. GreyScout cut rep ramp time from 8-10 weeks to 4 weeks - new reps stopped wasting their first month learning that half their contact list was dead.
The industry average data refresh cycle is 6 weeks. If your bounce rate is above 5%, fix the data before you retrain the reps.
Cold email reply rates dropped to 5.8% - and bounce rates from bad data destroy your domain reputation on top of that. Prospeo's 98% email accuracy and 5-step verification keep bounce rates under 4%, so every send counts. At $0.01 per email, fixing your upstream data costs less than one wasted SDR hour per week.
Your SDR metrics improve the moment your contact data does.
Ramp, Tenure, and Org Design
Average SDR ramp time is 3.0 months - the lowest since 2010. Month 1, expect 20-30% of quota. Month 2 hits 40-60%. Month 3 reaches 70-90%, and Month 4+ should be at or above 100%. Teams with clean, pre-loaded contact data consistently ramp faster because new reps aren't spending their first weeks discovering that half their list is dead. If you want a practical ramp structure, use a 30-60-90 plan to align activity, coaching, and targets.
Average SDR tenure has rebounded to 1.9 years. Org design is fairly standardized: 60% of sales development groups report to Sales, 82% align SDRs to AE territories, and the SDR-to-AE ratio sits at 1:2.4.
Aligning Compensation to KPIs
Comp design is where metric strategy meets rep behavior. The typical base-to-variable split is 60/40 or 50/50, with US base salaries ranging $45k-$70k.
Pure meeting-booked comp creates perverse incentives - reps will book unqualified meetings all day if that's what they're paid on. A hybrid weighting model works better: 40% meetings booked, 30% opportunities created, 30% pipeline influenced.
The weighting should evolve with team maturity. Early-stage teams run 60/20/20 to keep activity high while reps learn. Mature orgs shift toward 30/35/35. This progression naturally moves reps from volume-oriented behavior to quality-oriented behavior as they develop. Skip this if you're a two-person startup - just pay on meetings booked and move fast.
Common Pitfalls
A few traps that silently corrupt your reporting - and the review cadence that catches them:
Voicemail misclassification. Many teams count calls exceeding 60 seconds as "conversations," but a voicemail plus a detailed message easily crosses that threshold. Your CRM says the rep had 15 conversations today; they actually talked to 4 humans. LLM-based call analysis fixes this, but most teams haven't implemented it yet.
Activity inflation. 80+ calls/day with a terrible list underperforms 50 calls with verified contacts. Don't reward volume without conversion. The consensus on r/sales is pretty clear on this - reps hate being measured on dials when they know the list is garbage, and they're right.
Peak window cannibalization. Don't schedule internal meetings during Tuesday-Thursday mornings in your prospect's time zone. Those are your highest-connect windows.
The "more activity = more pipeline" assumption. Targeted, multi-touch sequences at 4-7% conversion crush brute-force single-channel outreach at 1-2%. Let's be honest: if your team is still running a pure volume play in 2026, you're fighting the last war. If you need a tighter playbook for what to do instead, start with proven sales prospecting techniques.
Ignoring AI-assisted workflows. AI-generated personalization and automated follow-up sequences are shifting benchmark expectations upward. If your competitors' SDRs are using AI to personalize at scale and yours aren't, your team will look like underperformers even if their raw skills are comparable. This is where AI sales follow-up workflows can move the needle without adding headcount.
Review cadence that works: Track activity metrics weekly, conversion and efficiency metrics monthly, and revenue outcomes quarterly. The teams that win aren't tracking the most metrics - they're tracking the right ones at the right frequency, with clean data underneath. Fix the inputs, and the outputs follow.
FAQ
How many meetings should an SDR book per month?
Median is 8-10 meetings per month; top quartile hits 12-15; elite performers book 18+. Segment by ACV - a rep booking 8 meetings at $100k ACV outperforms one booking 15 at $10k ACV.
What's a good connect rate for cold calls?
Enterprise runs 5-7%, mid-market 8-12%, SMB 12-15%. Top performers push 2-4 points higher in each segment. Consistently below these floors? Check your phone data quality first - stale numbers are the most common culprit.
How long should SDR ramp take?
Average ramp to full productivity is 3.0 months - the lowest since 2010. Month 1, expect 20-30% of quota. Month 2 around 40-60%. Month 3 reaches 70-90%. Teams using pre-verified contact databases cut ramp by up to 50% because new reps skip the "dead list discovery" phase entirely.
Why are my SDR metrics worse than benchmarks?
The most common upstream cause is bad contact data. If your bounce rate exceeds 5%, every downstream metric - connect rate, reply rate, meetings booked - is artificially deflated. Fix the inputs before you blame the reps.
Which SDR metrics matter most for revenue?
Focus on three: meetings booked per month, show rate, and pipeline generated. These directly correlate with revenue outcomes. Activity and efficiency numbers are important diagnostic tools, but they're leading indicators - not the final scorecard.