Serviceable Addressable Market: How to Calculate It and Find the Data
Your co-founder just pinged you: "We need the market size for the deck by Friday." You open a browser, type in your niche, and find nothing useful - just analyst PDFs behind $5,000 paywalls and blog posts recycling the same vague definitions. So you default to the lazy "1% of a billion-dollar market" slide that makes investors cringe.
You don't need a Gartner subscription. You need a method, a few free government datasets, and a B2B database to count real companies. Here's exactly how to size your serviceable addressable market - and make the number airtight.
Quick version: SAM is the slice of your total addressable market you can actually reach and sell to today. Calculate it bottom-up: count target companies matching your ICP, multiply by your average contract value. Use free Census data plus NAICS codes for industry-level counts, a B2B database for company-level ICP filtering, and validate by checking that your top-down and bottom-up estimates stay within 3x of each other.
What Is SAM?
Serviceable addressable market is the portion of your total addressable market that your company can realistically target and serve with its current product, pricing, business model, and go-to-market capabilities. It's always a subset of TAM, filtered by the constraints that define who you can actually sell to today. If you've ever wondered what SAM means in business, it's simply the revenue ceiling you'd hit if you won every deal in your reachable segment.
You'll sometimes see it called "serviceable available market." Both abbreviate to SAM - use whichever your audience expects, because the meaning is identical.
The organic customer test: If a prospect came to you inbound tomorrow, could you actually close and serve them? If yes, they're in your SAM. If they'd need a product you haven't built yet, or they're in a geography you can't support, they belong in TAM - not SAM.
The formula is straightforward: SAM = target segment customers x average contract value. The hard part isn't the math. It's figuring out the inputs.
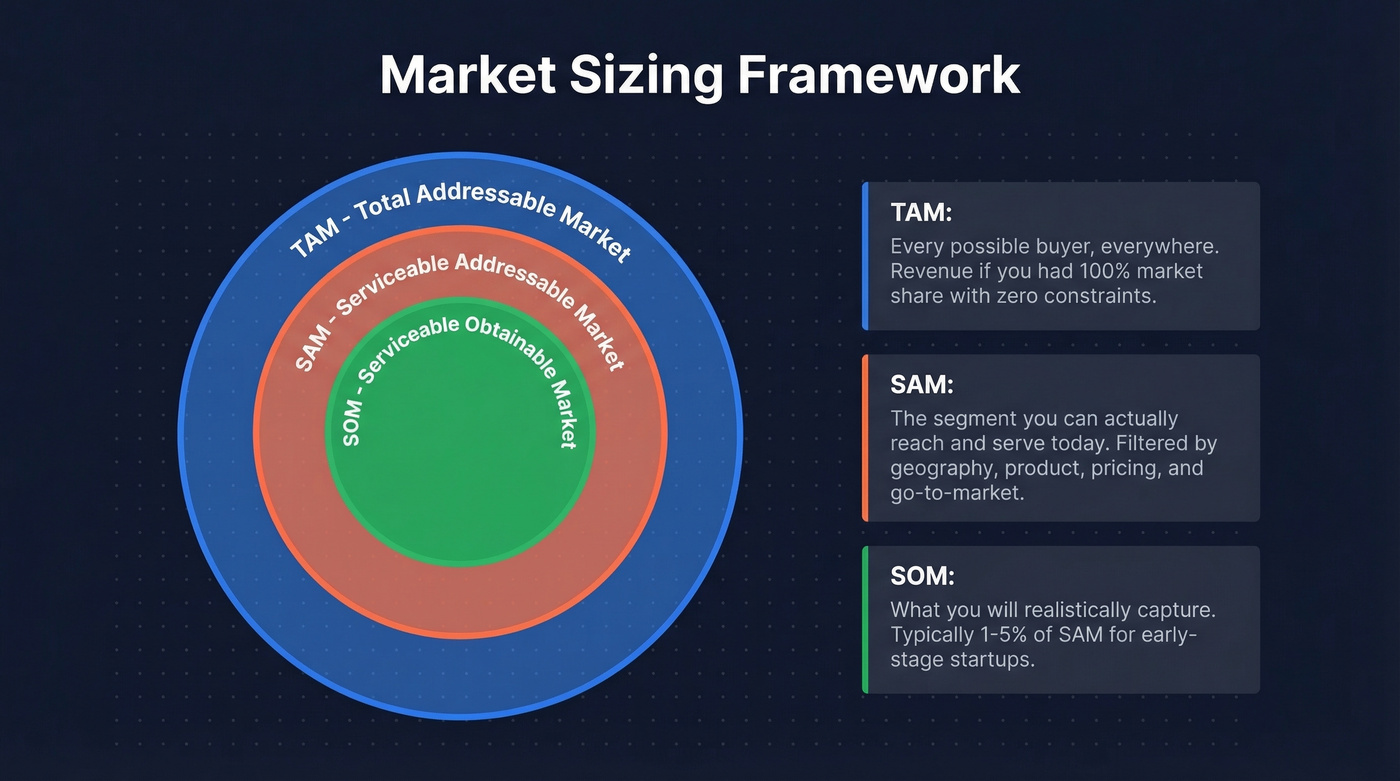
TAM vs. SAM vs. SOM
These three metrics form a nesting doll. Each is a subset of the one above it.
| Term | What It Measures | Example |
|---|---|---|
| TAM | Revenue at 100% share, zero constraints | Every possible buyer, everywhere |
| SAM | Revenue from the segment you can reach today | NA SMBs, 10-200 employees, using Slack |
| SOM | Revenue you'll realistically capture | Projected share given competition |
TAM is the entire pie. SAM is the slice you can serve. Where founders get tripped up is the relationship between the two - a clear SAM/TAM ratio signals analytical rigor, while a fuzzy one signals guesswork.
SOM benchmarks vary by maturity. Early-stage startups typically capture 1-2% of SAM. Successful established companies own 5-20%. Industry leaders push 20-40%. If you're projecting 50% SOM in year two, nobody's buying it - and we've watched founders lose entire rooms trying to defend that number.
Why SAM Matters
Three reasons, all about focus.
Resource allocation. Your sales team, marketing budget, and product roadmap all need a target. TAM is too broad. SAM tells you where to point the rifle instead of the shotgun - it converts an abstract market opportunity into a concrete go-to-market plan plan.
Investor communication. VCs care about the ratios between TAM, SAM, and SOM, not just the headline number. A $10B TAM with a $50M SAM tells a very different story than a $500M TAM with a $200M SAM. Save the detailed ratio breakdown for your market sizing slide, but know that investors use these ratios to gauge how well you understand your market.
It prevents the "boil the ocean" trap. If your SAM looks like 80% of your TAM, you haven't filtered hard enough. That's wishful thinking, not market analysis.
Three Ways to Calculate SAM
Top-Down Approach
Start with a published industry TAM number from an analyst report, trade association, or public company filings, then apply filters. Geography first, then company size, then vertical, then product fit.
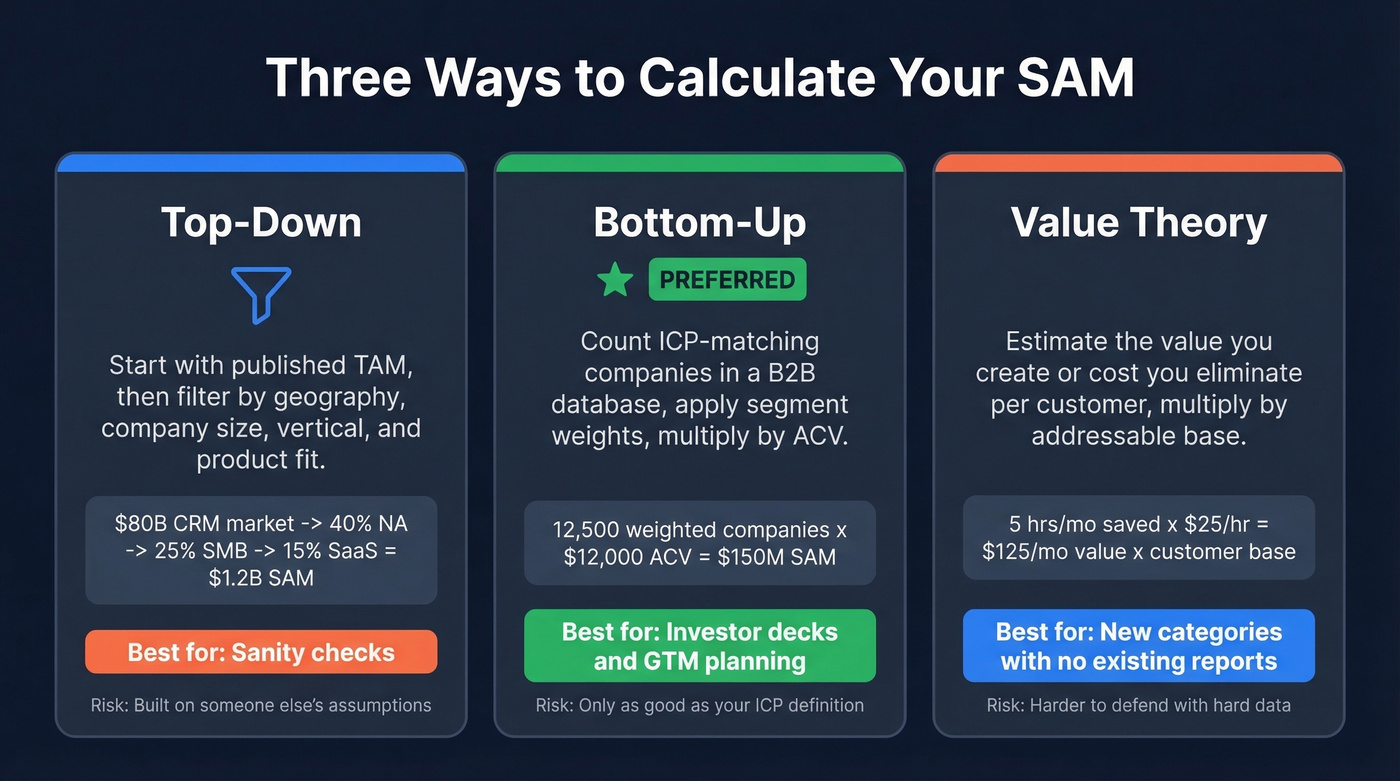
SaaS example: Assume the global CRM market is $80B. North America accounts for 40% of spend - about $32B. SMBs represent 25% of that segment, or $8B. If you only target SaaS companies at 15%, your SAM is roughly $1.2B.
Non-SaaS example: A regional organic baby food brand starts with an $8B US baby food market, filters to the Southeast (18% of US population = ~$1.4B), then narrows to organic-only households at 15% penetration - landing at a SAM around $210M.
Top-down is a sanity check, not a primary method. The numbers feel big and credible, but they're built on someone else's assumptions.
Bottom-Up (The Preferred Method)
Count the companies that match your ICP, then multiply by your ACV. This is the method that survives investor scrutiny and produces the most defensible SAM calculation.

Your ICP filters include industry, employee headcount, geography, tech stack, and funding stage. Apply those filters in a B2B database like Prospeo - which lets you layer 30+ criteria including buyer intent across 15,000 topics - and get an exact company count in minutes. That count multiplied by your ACV equals your SAM.
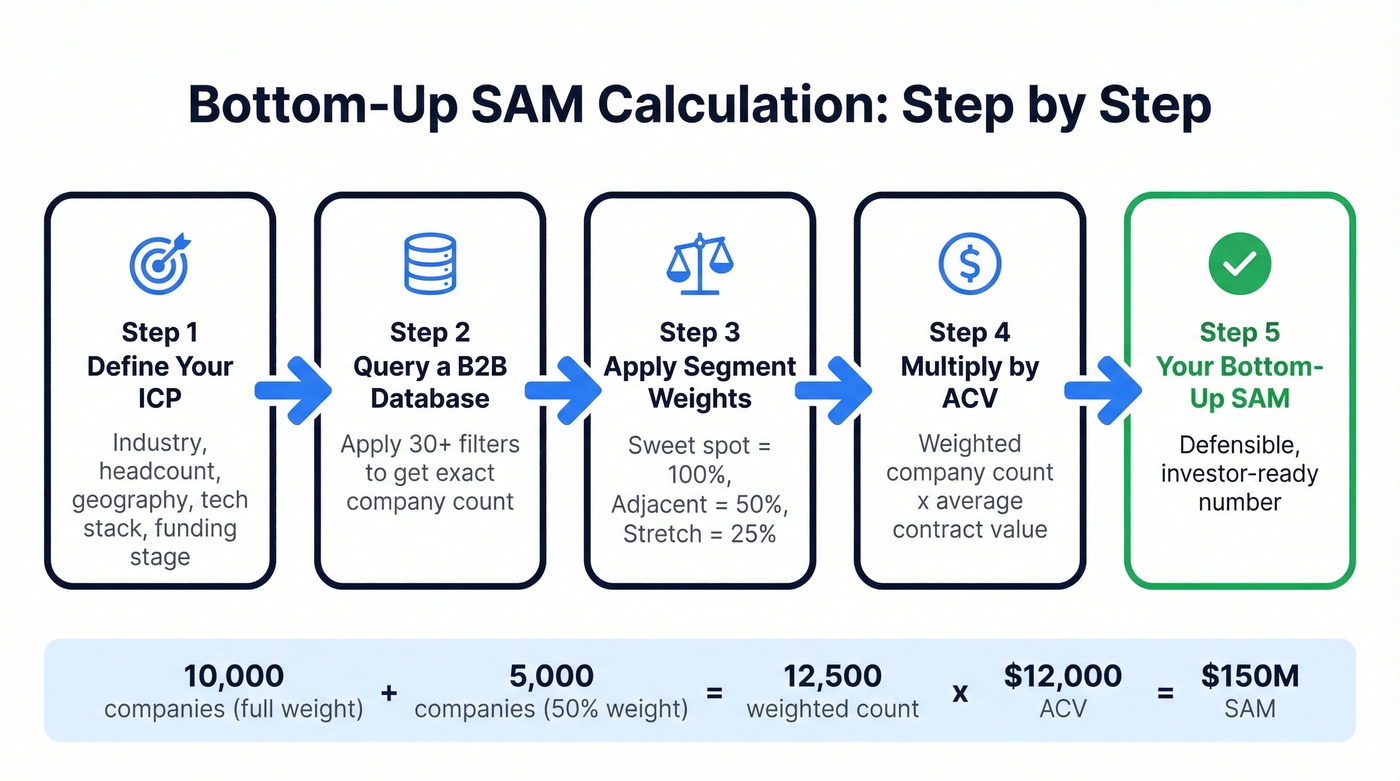
One nuance worth borrowing from practitioners on r/ProductMarketing: apply targetability weights by segment. If your product-market fit is strongest with 1-10 employee companies but drops off for 11-49 employees, weight your count accordingly.
Example: 15,000 companies match your filters. 10,000 are in your sweet spot at full weight, and 5,000 are adjacent at 50% weight, giving you a weighted count of 12,500. At an ACV of $12,000, your bottom-up SAM is $150M.
Value Theory
When you're creating a new category where no existing market report covers what you do, size the market by the value you create or the cost you eliminate.
Stitch Fix used this approach: they estimated customers spend roughly 5 hours per month shopping for clothes, valued that time at $25/hour, and arrived at $125/month in value per customer. Multiply by the addressable customer base, and you've got a TAM anchor that doesn't depend on an existing "personal styling market" report. Value theory is harder to defend than bottom-up, but infinitely better than fabricating a TAM number from thin air.
The article says to count ICP-matched companies and multiply by ACV. Prospeo's B2B database gives you 300M+ profiles with 30+ filters - industry, headcount, tech stack, funding, buyer intent across 15,000 topics. Get an exact company count for your SAM in minutes, not weeks.
Turn your SAM from a guess into a defensible number backed by real data.
Where to Get SAM Data
You don't need a $50,000 Gartner report. Free Census data plus a B2B database gets you 90% of the way there.
| Source | What It Contains | SAM Use Case | Cost |
|---|---|---|---|
| NAICS Codes | Federal industry classification | Segment by industry | Free |
| Census Business Builder | Business counts by geo/industry | Count establishments | Free |
| County Business Patterns | Establishments, payroll by ZIP | Geographic filtering | Free |
| Bureau of Labor Statistics | Employment, wages, roles | Quantify target users | Free |
| SUSB | Firm counts by size/industry | Size-based segmentation | Free |
| Economic Census | Revenue, employees by NAICS | Industry-level anchoring | Free |
| Gartner / Forrester | Market overviews, category sizing | Top-down benchmarks | $2K-$15K+/report |
| IBISWorld | Industry reports, market estimates | Industry validation | ~$1K-$5K+/yr |
| PitchBook | Funding, headcount, revenue | Startup intelligence | $20K-$100K+/yr |
| Crunchbase | Company profiles, funding | Startup counts by category | Free tier; Pro ~$29-$99/mo |
| Prospeo | 300M+ profiles, 30+ filters incl. intent | Count ICP-matching companies | Free tier; ~$0.01/lead |
The free government sources - NAICS, CBP, BLS, SUSB - give you industry-level counts and geographic breakdowns. For scrappier inputs, check G2 reviews to understand competitor customer profiles, or Yelp to visualize geographic density in local markets. Then layer in a B2B database for company-level granularity: filter by headcount, tech stack, funding stage, and geography to get your actual bottom-up count.
You just built your SAM. Now reach every company in it. Prospeo delivers 98% accurate emails at $0.01 each and 125M+ verified mobile numbers - so your bottom-up market sizing converts directly into a pipeline-ready prospect list with zero wasted steps.
Go from market sizing to first outreach in the same platform.
How to Validate Your SAM
Run through this checklist before you put the number on a slide.
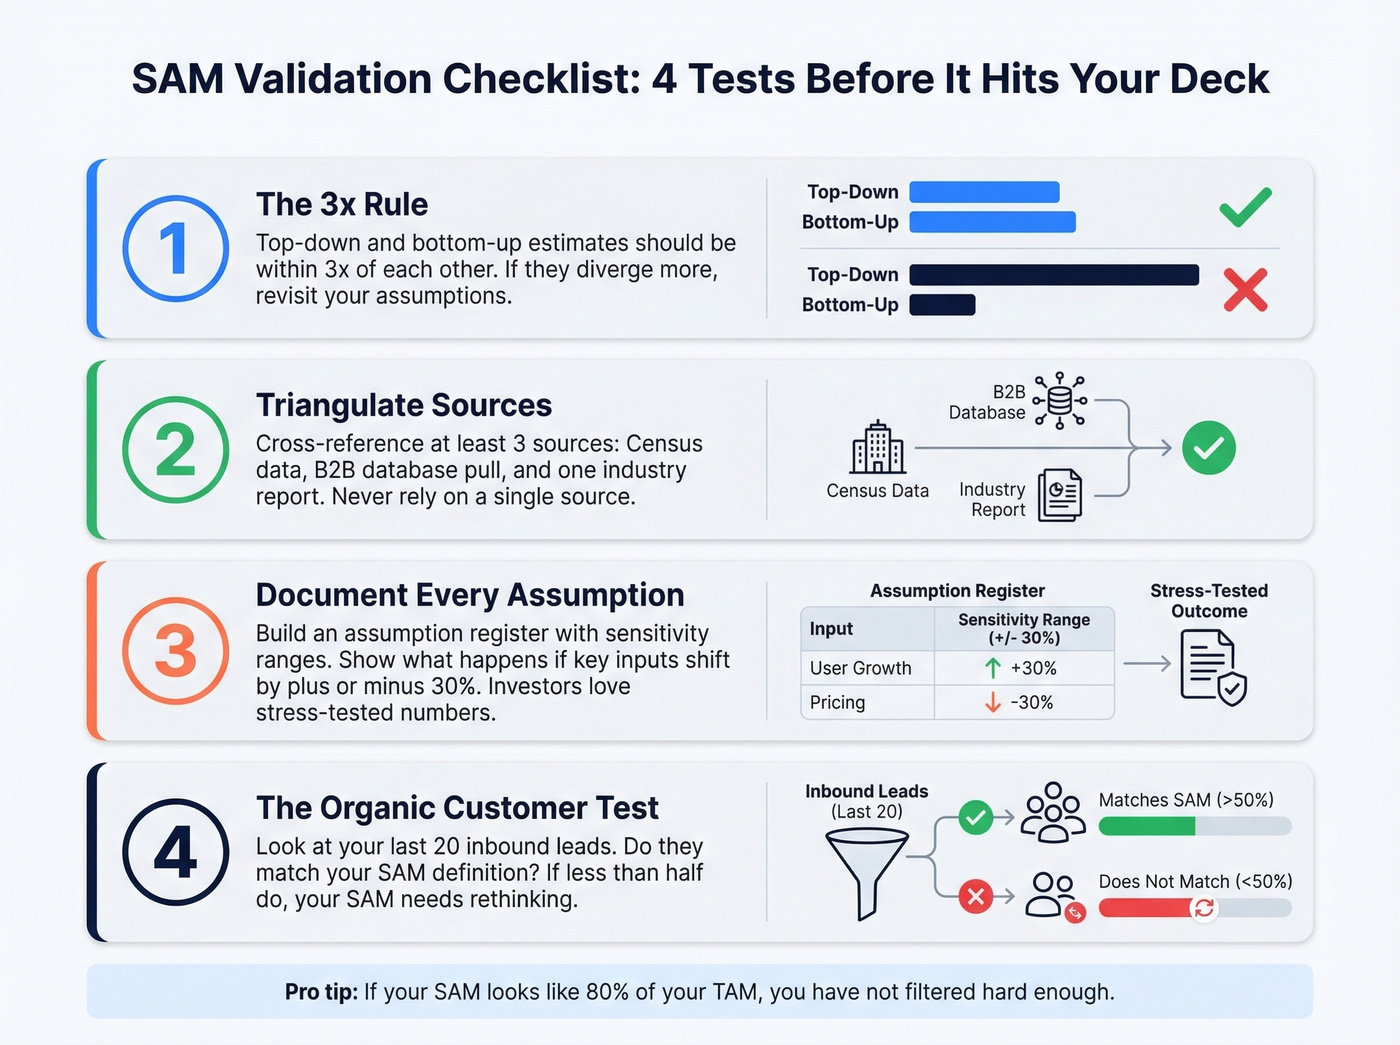
The 3x rule. If your top-down and bottom-up estimates diverge by more than 3x, something's off. In our experience, this single check catches most sizing errors before they hit a deck.
Triangulate across sources. Cross-reference Census counts with a B2B database pull and at least one industry report. Build your assumptions in a spreadsheet - free SAM templates from sites like IdeaPlan can speed this up.
Document every assumption. Create an assumption register with sensitivity ranges. "We assumed 15% of mid-market SaaS companies use Salesforce" - and note what happens if it's 10% or 20%. Investors love seeing that you've stress-tested the inputs, not just the output.
Run the organic customer test. Look at your last 20 inbound leads. Do they match your SAM definition? If half fall outside it, your SAM is either too narrow or your positioning doesn't match your market thesis.
Common SAM Mistakes
Here's the thing: most SAM errors aren't math errors. They're judgment errors. We've reviewed dozens of pitch decks where the spreadsheet was flawless but the assumptions were fantasy.
Over-relying on top-down. Analyst reports give you a starting point, not a finish line. If your entire SAM rests on a single Forrester number with a couple of percentage filters applied, you haven't done the work.
Ignoring geographic constraints. You sell in English to US mid-market companies. Your SAM isn't global. This sounds obvious, but we still see it constantly.
Confusing TAM, SAM, and SOM. Mixing up these three in a pitch deck is an instant credibility hit. Each metric has a distinct role, and investors expect you to know the difference.
Using stale data. Market data older than 2-3 years is usually a liability. Industries shift fast, and a 2023 report won't reflect the AI-driven reshuffling happening across SaaS right now.
The "1% fallacy." Saying "we only need 1% of the market" signals you haven't done the work to understand your actual capture rate. Skip this slide entirely - it does more harm than than good.
Inflating TAM for investors. An inflated TAM creates due diligence problems, not excitement. Investors prefer realistic numbers they can trust.
What Investors Want to See
Series A investors typically need a TAM of $1B+ for the fund math to work. But at seed stage, they care more about whether you understand your market than whether the number is enormous.
Let's be honest: a $200M SAM with airtight assumptions beats a $2B SAM built on hand-waving. Every time. We've seen founders with modest numbers raise faster than competitors waving around inflated TAMs, because the rigor behind the number is what builds conviction.
What actually matters on the market sizing slide is the ratios. A TAM of $5B with a SAM of $500M and a SOM of $10M tells a coherent story. A TAM of $50B with a SOM of $500M raises eyebrows because the jump is too aggressive. Think of Airbnb's early pitch deck - their TAM slide worked not because the number was huge, but because the logic connecting each layer to the next was airtight.
Bottom-up is the favored method in modern pitch decks. VCs want to see that your serviceable addressable market is built from countable assumptions - number of target companies, realistic ACV, achievable penetration rate. And your market sizing slide must match your financial model. If your SOM says $15M but your revenue projection says $30M, you've lost credibility before the Q&A starts.
FAQ
What's the difference between SAM and TAM?
TAM is the total revenue opportunity at 100% market share with zero constraints. SAM is the slice you can actually reach with your current product, business model, and go-to-market. SAM is always smaller, filtered by geography, company size, vertical, and product fit.
How do I calculate SAM without industry data?
Use bottom-up: count ICP-matching companies in a B2B database filtered by industry, headcount, geography, and tech stack, then multiply by your ACV. Supplement with free Census and BLS data for establishment-level validation.
What's a good SAM-to-TAM ratio?
No universal benchmark exists, but if your SAM exceeds 80% of TAM, you haven't applied enough filters. Most defensible decks land between 10-40%. The ratio matters less than whether you can defend every filter you used.
Can I use a B2B database to estimate SAM?
Yes - apply ICP filters like industry, headcount, geography, tech stack, and funding stage to get an exact count of matching companies. That count multiplied by your ACV gives you a bottom-up SAM grounded in real, filterable data rather than analyst assumptions.
What does SAM mean in simple terms?
SAM represents the segment of the total market you can realistically serve today given your product capabilities, geography, and go-to-market reach. If TAM is "everything possible," your serviceable addressable market is "everything reachable." Together they frame the gap between theoretical opportunity and practical revenue ceiling.