TAM SAM SOM Calculator: Build Numbers Investors Actually Believe
It's 2am, you're staring at slide 7 of your pitch deck, and the market sizing numbers look like they were pulled from a fever dream. You're not alone - roughly 42% of startups fail because they misjudged market demand, and it usually starts right here, on this slide. You don't need a fancy calculator. You need the right inputs and the logic to defend them.
Let's fix that.
The Formulas (Quick Version)
- TAM = Total potential customers x Average revenue per customer
- SAM = TAM x Serviceable percentage
- SOM = SAM x Obtainable percentage
If you only read one section, read "What Investors Actually Look For" - it'll save your pitch deck.
Jump to the free calculators section if you just want a tool.
Definitions and Formulas
| Term | What It Means | Formula |
|---|---|---|
| TAM | Total Addressable Market | Customers x ARPU |
| SAM | Serviceable Addressable Market | TAM x Serviceable % |
| SOM | Serviceable Obtainable Market | SAM x Obtainable % |
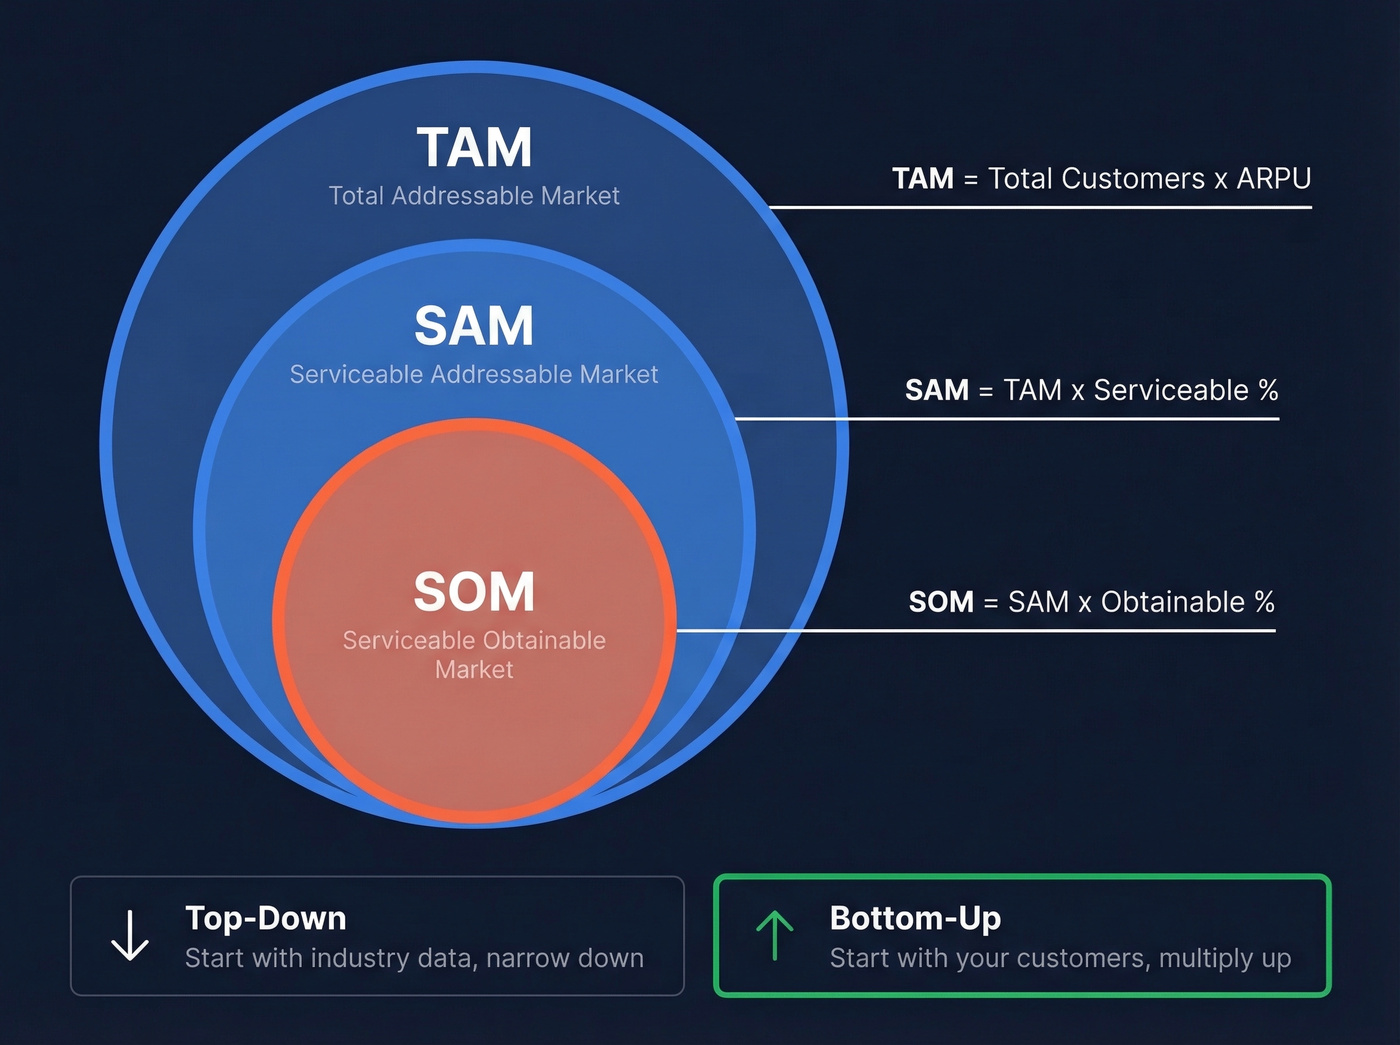
Two approaches dominate. Top-down starts with industry-level data - analyst reports, government databases - and narrows by percentages. Bottom-up starts with your specific customer segments, counts them, and multiplies by your price point.
A third approach, the value theory method, estimates willingness to pay based on the problem's cost rather than existing market spend. Use this when you're creating a new category and there's no existing market to reference. If your product eliminates a $50,000/year problem, that's your per-customer value anchor - even if nobody's spent a dollar on your category yet. Pre-revenue founders lean on this method heavily, and for good reason: it forces you to quantify the pain you're solving rather than borrowing someone else's number from a Statista chart.
Most guides stop at the formulas. The formulas aren't the hard part. Knowing which numbers to plug in - and defending them to someone writing a $2M check - is.
How to Calculate Each (Worked Example)
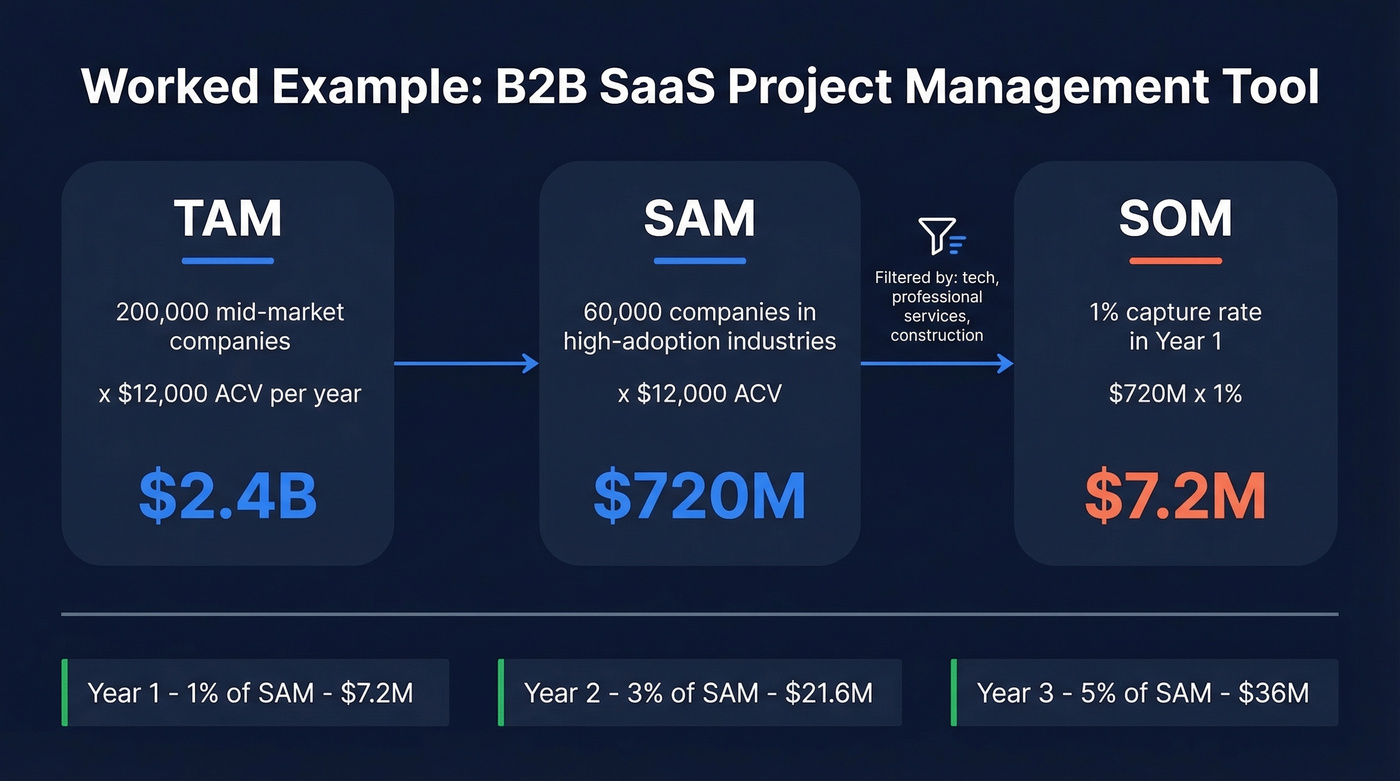
A single example: a B2B SaaS project management tool targeting mid-market companies (50-500 employees) in North America.
Calculating TAM
Top-down: Start with an industry revenue number, then narrow it to your segment and geography. If you have a credible global market estimate and you assume North America represents a meaningful share, you can derive a regional TAM for context.
Bottom-up (what you actually defend): Assume there are 200,000 mid-market companies in North America that fit your ICP. Multiply by your $12,000/year ACV:
200,000 x $12,000 = $2.4B TAM
Use top-down for context. Use bottom-up for your actual numbers. Investors trust bottom-up because it's grounded in your assumptions, not a report's.
One critical warning: using global TAM for a regional product inflates your number by 70-80%. If you're only selling in North America, your TAM is North America. Full stop.
Calculating SAM
Here's where founders building global SaaS products get stuck. If anyone with a credit card can buy your tool, what's your SAM? "The whole world" isn't an answer investors accept.
Your SAM is defined by go-to-market constraints: the countries where you'll actually run marketing and sales in the next 12-18 months, filtered by language, payment infrastructure, and regulatory access. A founder on r/startups worked through this exact problem - globally accessible product, but correctly scoped SAM to the countries where they'd actually spend acquisition dollars.
Back to our example: of those 200,000 mid-market companies, 60,000 are in industries where project management software adoption is high (tech, professional services, construction). Your SAM = 60,000 x $12,000 = $720M.
Calculating SOM
SOM is where optimism meets reality. A realistic ramp looks like 1% of SAM in year 1, 3% in year 2, 5% in year 3. For our example, that's $7.2M in year one - a number you can actually defend with a hiring plan and marketing budget.
Industry benchmarks for gut-checking your ratios:
| Segment | TAM to SAM | SAM to SOM | Notes |
|---|---|---|---|
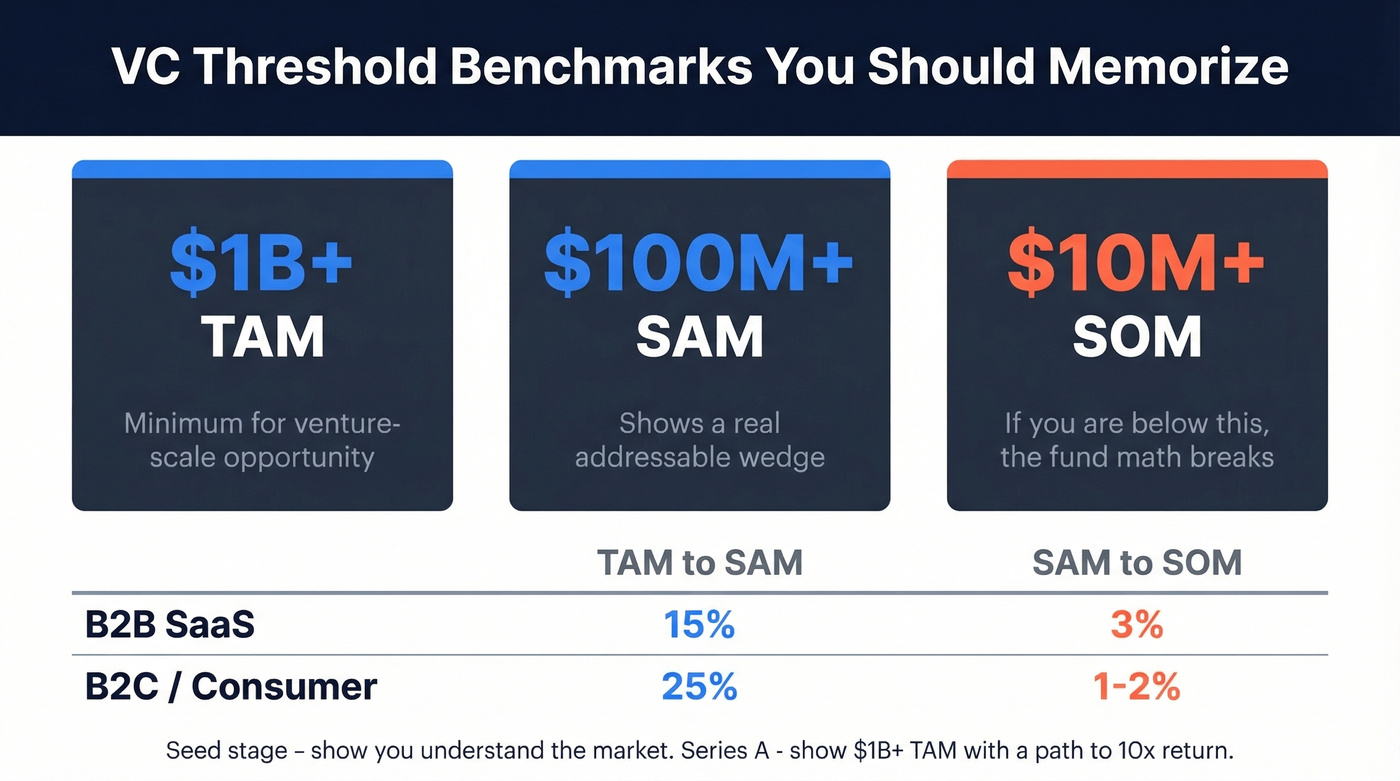
| B2B SaaS | 15% | 3% | Narrow segments, high ACV |
| B2C / Consumer | 25% | 1-2% | Broad reach, lower capture |
| Marketplace | Varies | 5-10% | Network effects compound |
VC thresholds worth memorizing: TAM > $1B, SAM > $100M, SOM > $10M for venture-scale opportunities. If your SOM doesn't clear $10M, the fund math doesn't work for most institutional investors.
What Investors Actually Look For
After reviewing 1,000+ pitch decks, the team at spectup found that the market sizing slide is "most consistently weak." The pattern is always the same: a giant TAM number, a hand-wave at SAM, and a SOM that's conveniently 1% of something enormous.
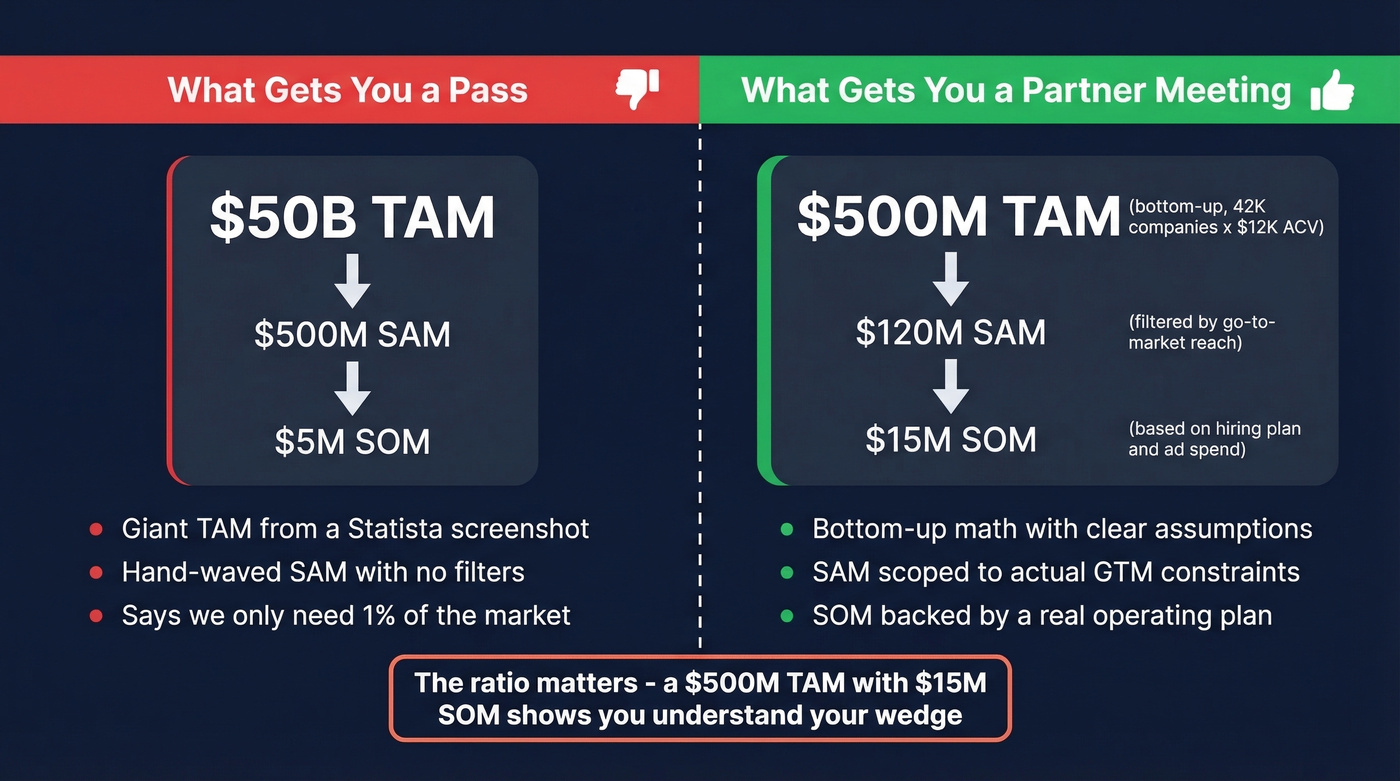
Never say "we only need 1% of the market." Investors call this the 1% fallacy, and it signals you haven't done the work. Getting 1% of a massive market is brutally hard, and saying it's easy tells an investor you don't understand distribution.
What actually matters is the ratio between TAM and SOM. A $50B TAM with a $5M SOM tells investors you're a rounding error in your own market. A $500M TAM with a $15M SOM tells them you understand your wedge and have a credible path to capturing it. That's the difference between a pass and a partner meeting.
Stage-specific expectations shift too. At seed, investors care more about whether you understand the market than whether your number is precise. By Series A, they want to see $1B+ TAM because the fund needs a path to a 10x return.
Bottom-up analysis is almost always more credible than top-down because it forces you to show your assumptions. In our experience, the founders who get funded aren't the ones with the biggest TAM - they're the ones who can walk through their assumptions without looking at their notes.
You just calculated how many companies fit your ICP. Now get their decision-makers' verified emails. Prospeo's 30+ search filters - including headcount, industry, funding, and technographics - let you turn your SAM into an actual prospect list with 98% email accuracy.
Stop sizing the market. Start reaching it.
Why Most Market Sizing Fails
The real failures aren't arithmetic - they're structural. We've seen founders nail the formulas and still produce numbers that fall apart under scrutiny.

The core mistake is conflating eligibility with accessibility. Eligibility asks "who could theoretically buy this?" Accessibility asks "who can realistically switch to us right now, given procurement cycles, vendor lock-in, switching costs, and budget timing?" Put this framework front and center on your market sizing slide - it's the single fastest way to demonstrate sophistication to an investor who's seen 50 pitches that week.
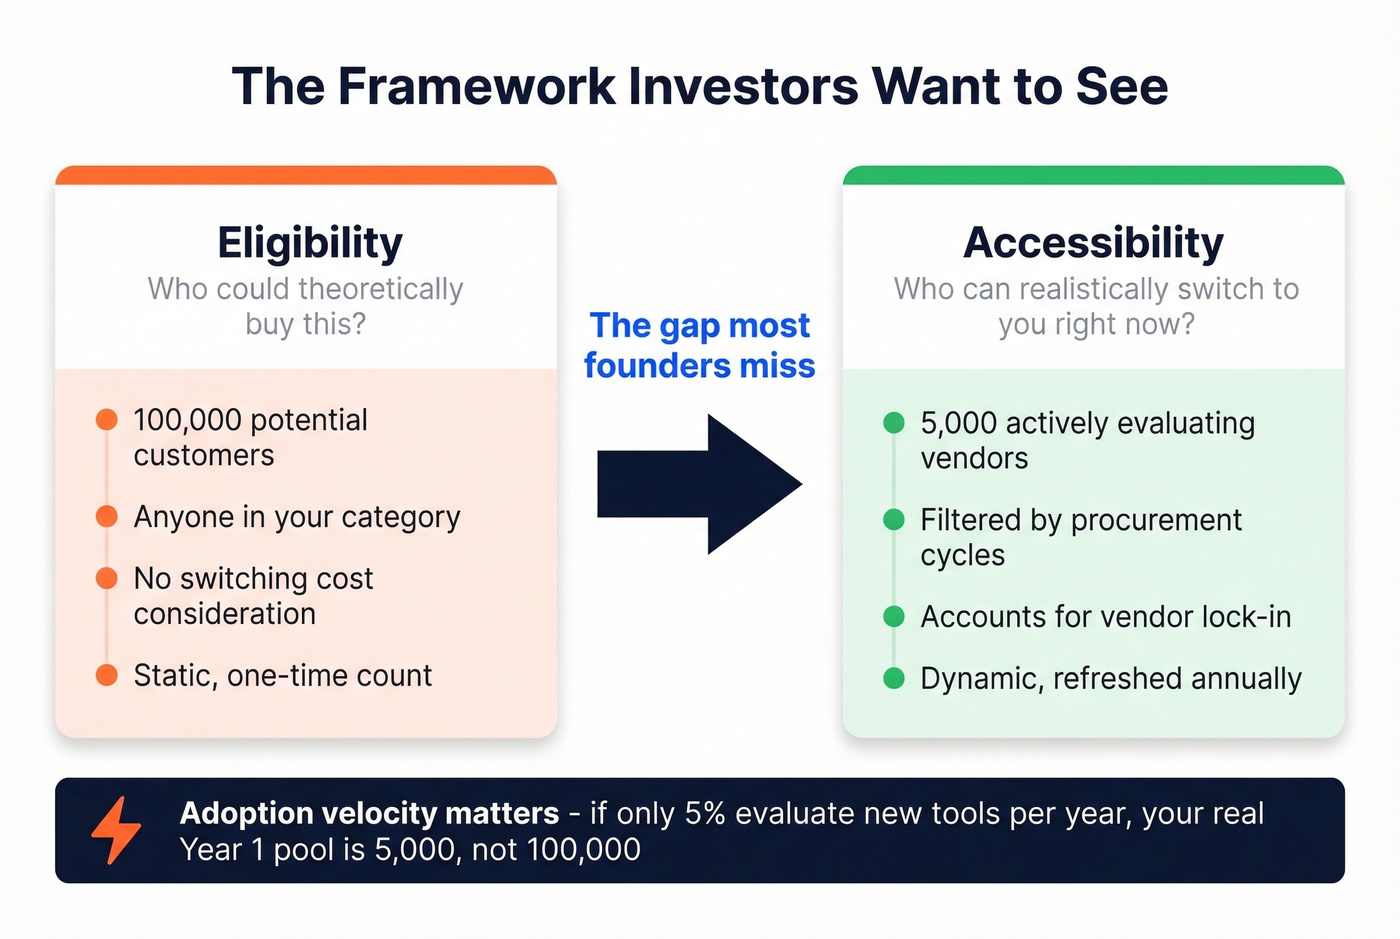
The missing variable in most models is adoption velocity - how fast your segment actually buys new tools. A market with 100,000 potential customers where only 5% evaluate new vendors per year means your real year-one addressable pool is 5,000, not 100,000. Static TAM models completely ignore this, and it's the biggest reason SOM projections miss.
Look, most founders don't need a more precise market sizing calculator. They need a more honest one. If you're selling sub-$10K deals to SMBs, your SOM is probably smaller than you think - and that's fine. A $5M SOM you can actually capture beats a $50M SOM that exists only in a spreadsheet. Investors fund conviction backed by math, not math designed to impress.
Once you've sized your market, the next step is operationalizing it. That means territory planning, resource allocation, and building actual prospect lists against your SAM. The calculation is the starting line, not the finish.
Where to Find Free TAM Data
You don't need an expensive Gartner report to build credible market sizing. These sources get you most of the way:
- US Census Bureau - businesses by industry, size, and state. Updated annually, runs a couple years behind, but still the gold standard for company counts.
- Bureau of Labor Statistics - roles by industry. Essential when your TAM is defined by job function, not company count.
- OECD / Statistics Canada - similar datasets for international markets.
- UN Data - population, trade indices, tourism, transport. Useful for consumer-facing TAMs.
- ITC Trade Map - import/export performance by country. Lists actual companies in trade flows.
- SEC filings - financial and operational data for public companies in your space. Competitor 10-Ks are underrated for market sizing.
- G2 - competitor reviews and category pages reveal customer segments, company sizes, and use cases that help you triangulate bottom-up counts.
For validating bottom-up TAM by counting actual companies matching your ICP, Prospeo's B2B database lets you search with 30+ filters including firmographic and technographics, headcount growth, funding, and revenue - so you can go from "we estimate 60,000 mid-market SaaS companies" to a filtered count with verified contacts attached.
Free TAM SAM SOM Calculators and Templates
| Tool | Format | Cost | Best For |
|---|---|---|---|
| PM Toolkit | Web calculator | Free | Quick estimates + benchmarks |
| HubSpot | Spreadsheet template | Free | Custom models in Sheets |
| Theory27 | Sheets + PowerPoint | Free | SaaS examples + deck slides |
| Nectar Group | Spreadsheet | Free | APAC-focused sizing |
| Equidam | Web calculator | Free tier | Valuation context |
Most standalone calculators are free. "Investor-ready" market research platforms run $20-200/month, but a well-built spreadsheet with clear assumptions beats a fancy tool every time. The calculator isn't the deliverable - your logic is.
Common Mistakes
Screenshotting Statista and calling it research. Investors want your math based on your customer segments, not a chart anyone can Google. As one commenter on r/startups put it, "Most market size slides are bullshit, and investors know it." The bar is showing your work, not citing someone else's.
Saying "we only need 1% of the market." This is the fastest way to lose credibility in a pitch. It tells the investor you've never thought about distribution costs, sales cycles, or competitive dynamics.
Using global TAM for a regional product. If you're selling in three countries, your TAM is three countries. We've watched founders lose deals over this one mistake more than any other.
Projecting >30% market share in an established market. Unless you're displacing a monopoly with a regulatory tailwind, this isn't realistic.
Using stale data. Update your market sizing annually. Two-year-old numbers signal poor preparation.
Being too conservative out of fear. If you're a solo founder with a limited marketing budget, be realistic - but don't sandbag. A defensible SOM that's slightly ambitious shows you understand growth levers. A SOM that's clearly deflated to seem "safe" just tells investors you don't believe in your own product.
Email-gating your calculator. One founder on r/Entrepreneurs reported zero completions after adding an email gate to a free TAM tool. Skip this if you're building any kind of free resource - friction before value kills everything.
If you want a deeper primer on the concepts behind the math, read our addressable market breakdown.
Bottom-up market sizing only works if you can count real companies that match your ICP. Prospeo gives you 300M+ profiles across every segment, filterable by company size, revenue, tech stack, and buyer intent - the same inputs that make your SOM defensible to investors.
Validate your TAM with real prospect data at $0.01 per lead.
FAQ
What's the difference between top-down and bottom-up market sizing?
Top-down starts with total industry data and narrows by percentages; bottom-up starts with your specific customer count and ACV. Investors trust bottom-up because it exposes your assumptions rather than hiding behind an analyst report. Use both - top-down for context, bottom-up for your pitch.
How do I define SAM for a global SaaS product?
Scope SAM to the countries where you'll actually run marketing and sales in the next 12-18 months, filtered by language, payment infrastructure, and regulatory access. "Available globally" isn't a SAM - it's a wish. Most seed-stage SaaS companies land on 2-5 countries for a defensible SAM.
How can I count companies that match my ICP without paying for Gartner?
Free government databases like the Census Bureau, BLS, and OECD give you market counts by industry and size. G2 category pages help triangulate competitor customer segments. For building actual prospect lists with verified contacts, Prospeo's B2B database covers 300M+ profiles with filters for industry, headcount, revenue, and technographics - free tier included, no email gate.
What's a realistic SOM for a seed-stage startup?
Plan for 1% of SAM in year one, 3% in year two, and 5% in year three. These benchmarks hold across most B2B SaaS categories. If your year-one SOM doesn't clear $5-10M, revisit your SAM definition or ACV. Seed investors care less about the exact number and more about whether your capture path makes sense.