How to Use Technographic Data for Lead Scoring (With a Ready-Made Scoring Matrix)
Your SDR just burned two hours working a list of 200 "high-fit" accounts. Forty-three already run a competitor's product on a multi-year contract. Another sixty don't use any technology that integrates with yours. That's wasted pipeline - and it happens because most scoring models ignore the single most predictive fit signal available: what technology a company actually runs.
Companies using lead scoring see 138% ROI versus 78% without it. Yet only about 44% of organizations score leads at all. The teams that layer tech stack signals into their model don't just score better - they route better, sell faster, and stop wasting cycles on accounts that were never going to close.
Every guide tells you to "use tech stack data." None of them hand you the actual model. This one does.
What You Need (Quick Version)
The signals that matter: 5-7 technographic criteria predict roughly 80% of conversions. The point-value matrix below covers complementary platforms, integration readiness, competitor installs, and recent tech adoption.
Where to get the data without a $30K contract: Prospeo at about $0.01/lead with a free tier, TheirStack at $59-$400/mo, and BuiltWith at $295-$995/mo cover the range from self-serve to deep website audits.
The one mistake that kills most models: stale data. If your technographic provider refreshes monthly or quarterly, your scores are outdated before sales even sees them.
Where Technographics Fits in Scoring
Lead scoring works best as a two-field system. One field captures intent - behavioral signals like demo requests, pricing page visits, and email engagement. The other captures fit - firmographic and technographic signals that tell you whether this account matches your ICP regardless of what they've clicked on.
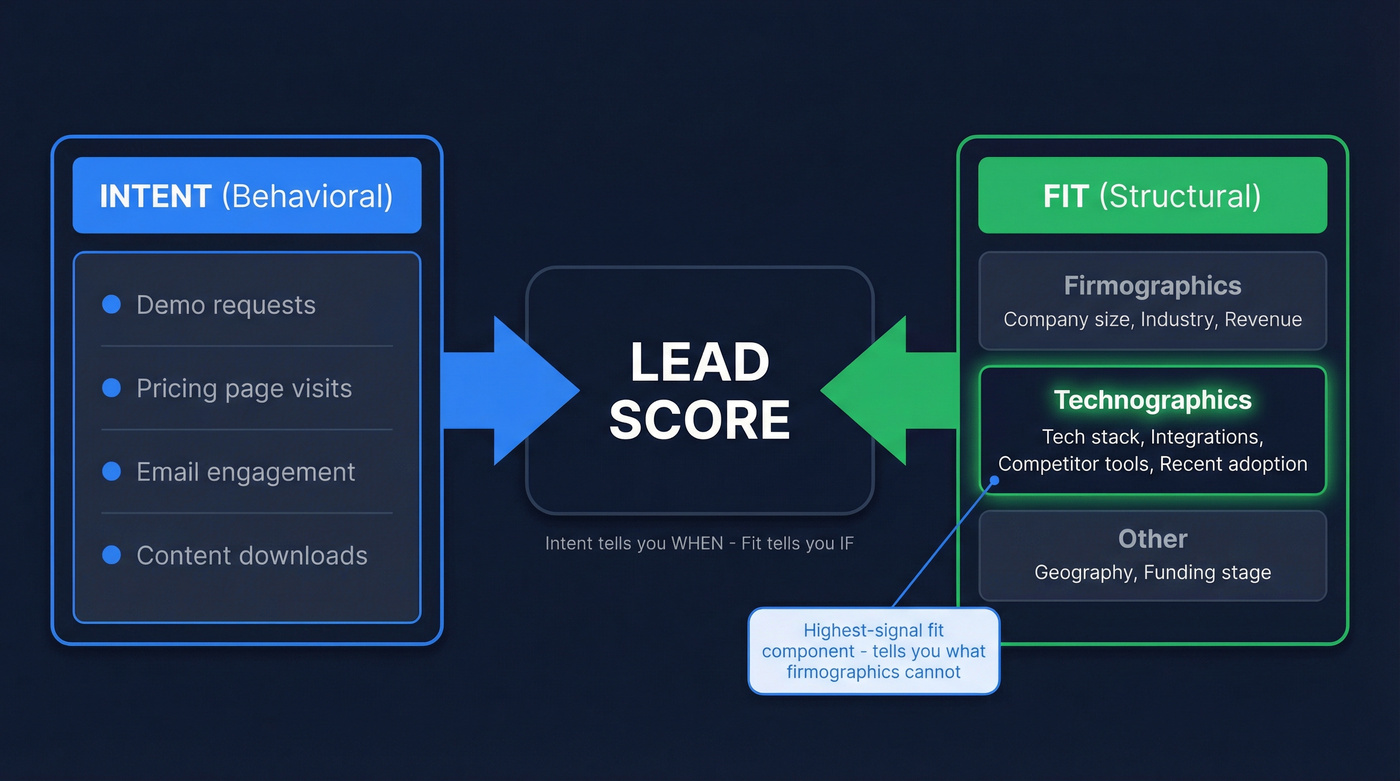
The RevOps playbook from RevBlack frames it cleanly: lead score equals intent, lead grade equals fit. Technographics is the highest-signal component of that fit dimension because it tells you something firmographics can't - whether your product actually plugs into what they already use.
The technographic data market hit $1.17B in 2025 and is growing at 12.5% CAGR through 2028. The average company now runs 100+ software applications. That stack complexity is a goldmine for scoring - if you know how to read it. When you combine buyer intent with technographic data, you get a model that captures both readiness and fit in a single view.
The Scoring Matrix
Most scoring guides give you generic examples like "+10 for C-level title" and call it a day. Traditional models overweight vanity metrics - email opens, generic content downloads - while ignoring structural signals that actually predict deals.
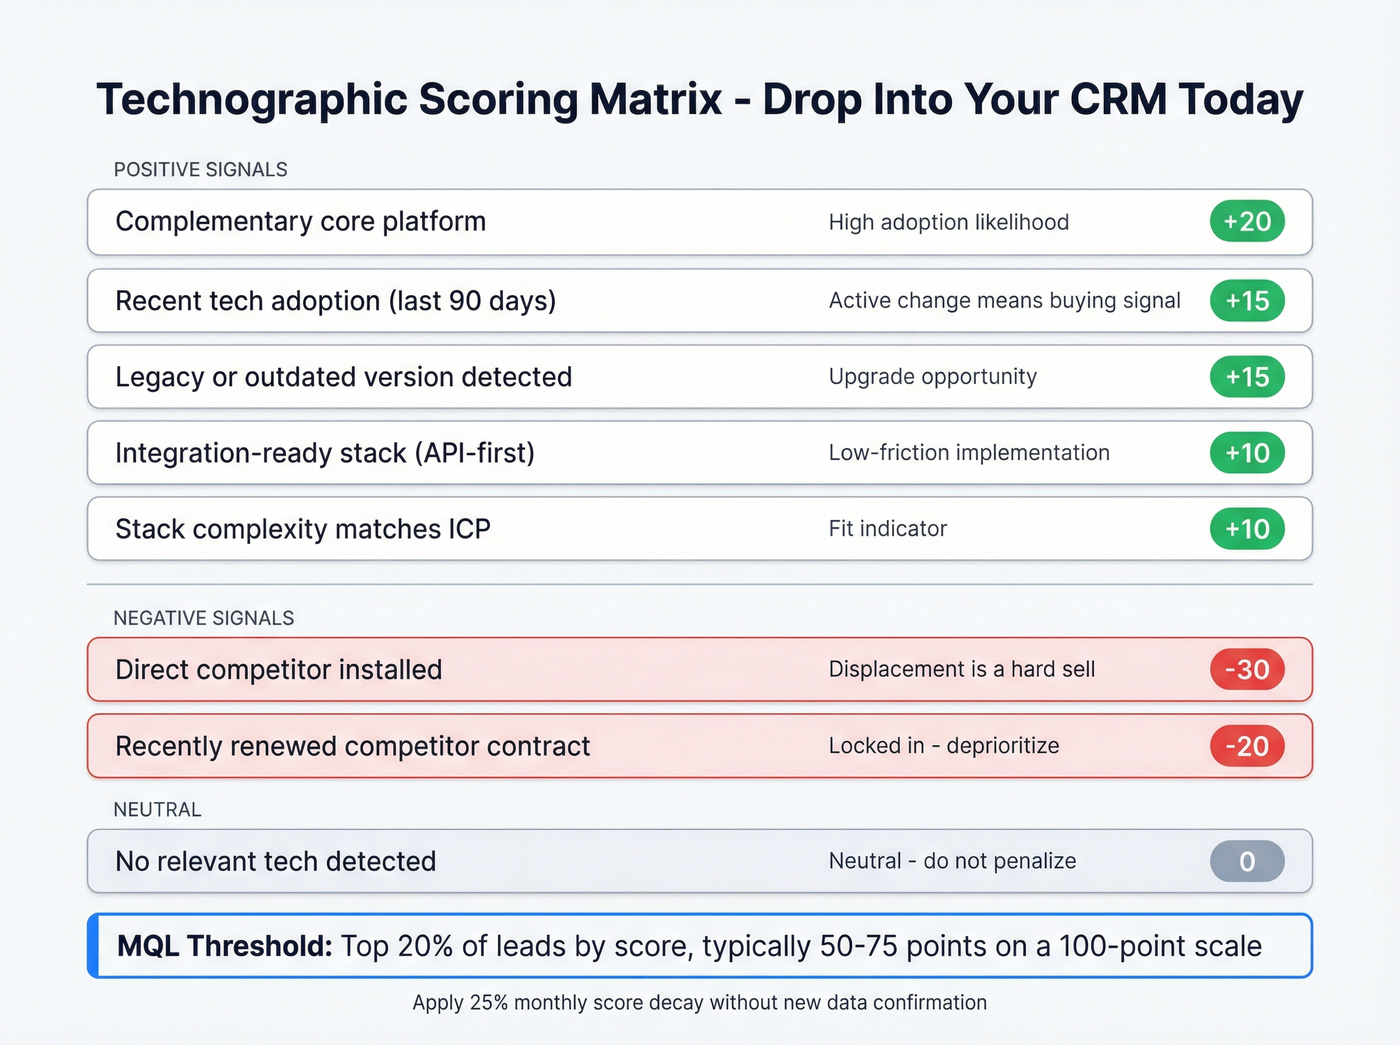
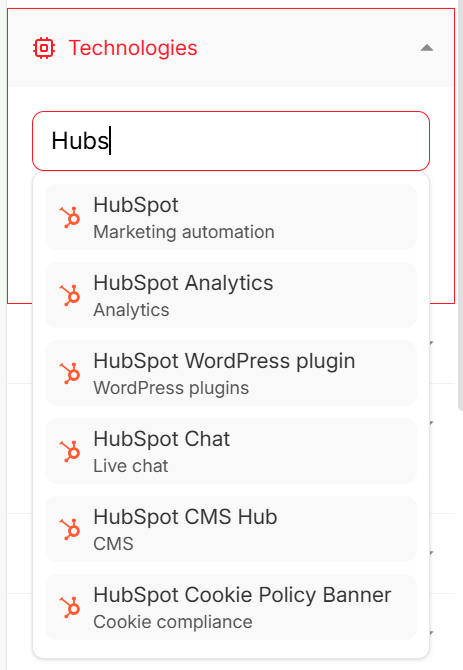
Here's a technographic scoring matrix you can drop into HubSpot, Salesforce, or Marketo today.
| Signal Category | Example | Points | Rationale |
|---|---|---|---|
| Complementary core platform | Uses your integration partner's CRM | +20 | High adoption likelihood |
| Integration-ready stack | API-first tools, webhook-capable | +10 | Low-friction implementation |
| Legacy/outdated version | Running deprecated software | +15 | Upgrade opportunity signal |
| Recent tech adoption | Added new tool in last 90 days | +15 | Active change = buying signal |
| Stack complexity matches ICP | Tech maturity aligns with your product | +10 | Fit indicator |
| Direct competitor installed | Uses rival product | -30 | Displacement is hard sell |
| Recently renewed competitor | Signed multi-year contract | -20 | Locked in, deprioritize |
| No relevant tech detected | Blank signal | 0 | Neutral - don't penalize |
The negative scoring rows are where most teams get this wrong. We've seen orgs spend months chasing accounts that had just signed two-year contracts with a competitor, burning SDR hours and morale in the process. A -30 for direct competitor installed and -20 for recent renewal would've routed those accounts to a nurture track instead of a fast-track queue. About 60% of software purchases are replacements - displacement opportunities are real, but only when the timing is right.
Set your MQL threshold at the top 20% of leads by score, typically 50-75 points on a 100-point scale. That range yields roughly 15-25% conversion rates from qualified leads to closed deals.
One critical operational detail: add score decay. Reduce technographic points by about 25% monthly without new activity or data confirmation. Technology stacks change fast - a signal from three months ago isn't the same signal today. Belkins, an outbound agency running HubSpot scoring for dozens of clients, reviews their model monthly and recalibrates, noting that "in SaaS, technographic data carries higher weight." That weight demands constant validation against actual conversion data.
Your scoring matrix is only as good as the data feeding it. Prospeo combines technographic filters with buyer intent signals across 300M+ profiles - refreshed every 7 days, not monthly. At ~$0.01/lead with a 92% API match rate, you can enrich your entire CRM and score by tech stack without a $30K contract.
Stop scoring leads on stale data. Build tech-scored lists in minutes.
Implementation in 6 Steps
1. Define your ICP's ideal tech stack. Pick 3-5 "must-have" technologies and 2-3 "red flag" technologies. Be specific. "Uses Salesforce Enterprise, adopted in the last 6 months" is a signal. "Uses a CRM" is noise.
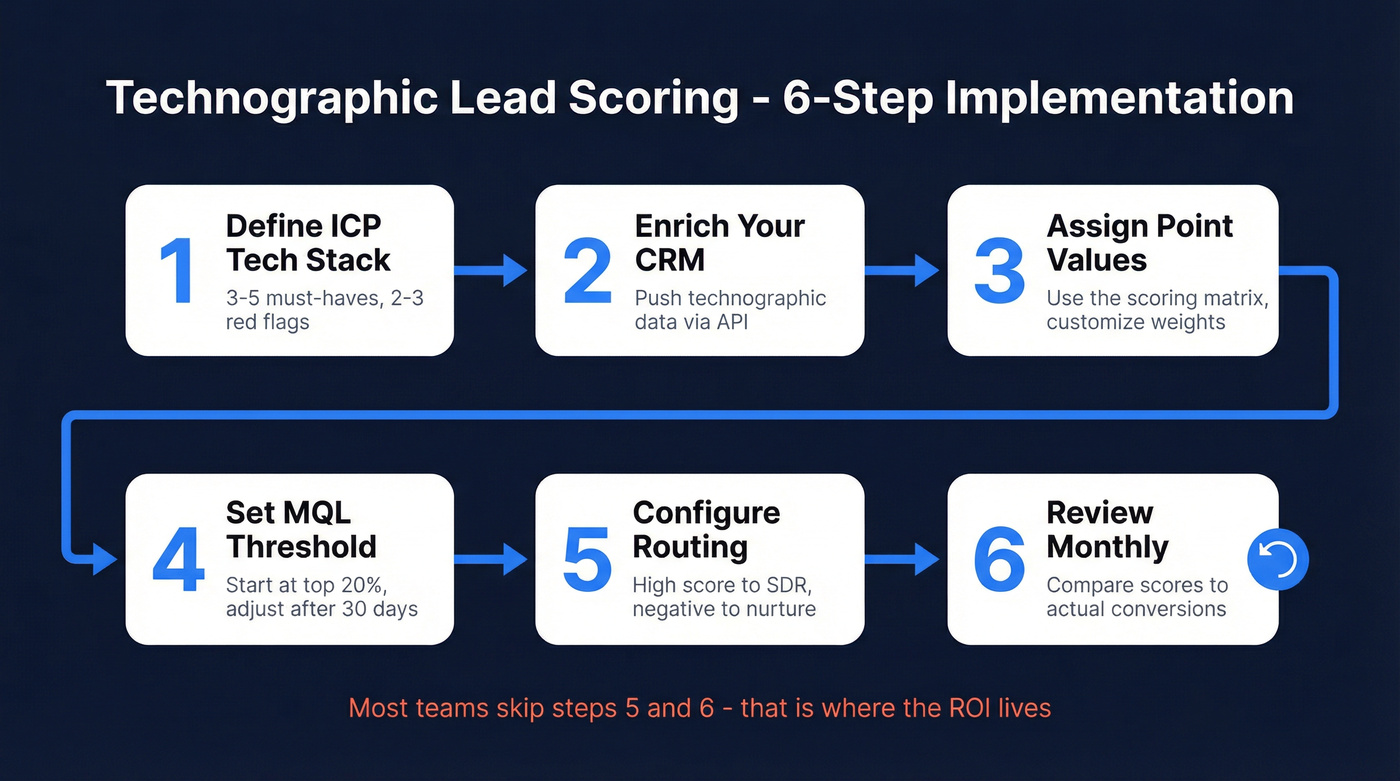
2. Enrich your CRM with technographic data. Prospeo's B2B database includes 30+ search filters covering technographics and intent signals, with a 92% API match rate for enrichment workflows. Push enriched records directly into HubSpot or Salesforce so scoring happens automatically.
3. Assign point values using the matrix above. Customize the weights for your product. If you're selling a Salesforce integration, "+20 for uses Salesforce" is obvious. If you're selling a Salesforce replacement, that same signal flips to "-30 for competitor installed."
4. Set your MQL threshold. Start at the top 20% of leads by technographic fit score. Tighten or loosen after 30 days of conversion data.
5. Configure routing rules. High-score leads go to SDR fast-track. Negative-score leads go to nurture or exclusion. Don't waste human attention on accounts your model already flagged as poor fit. (If you want a deeper ruleset, see negative scoring patterns that prevent wasted SDR cycles.)
6. Review and recalibrate monthly. Compare scores to actual conversion data. Are your +20 signals actually converting at higher rates? Are your -30 signals truly dead ends? Adjust weights based on what the data tells you, not what your gut says.
Technographic Data Providers Compared
Not all technographic data is equal. Website-scan tools tell you what's on the homepage - JavaScript libraries, analytics tags, marketing pixels. That's useful but shallow. Multi-signal platforms combine technographic detection with contact data, intent signals, and hiring patterns for a fuller picture.
| Provider | Coverage | Refresh | Pricing | Best For |
|---|---|---|---|---|
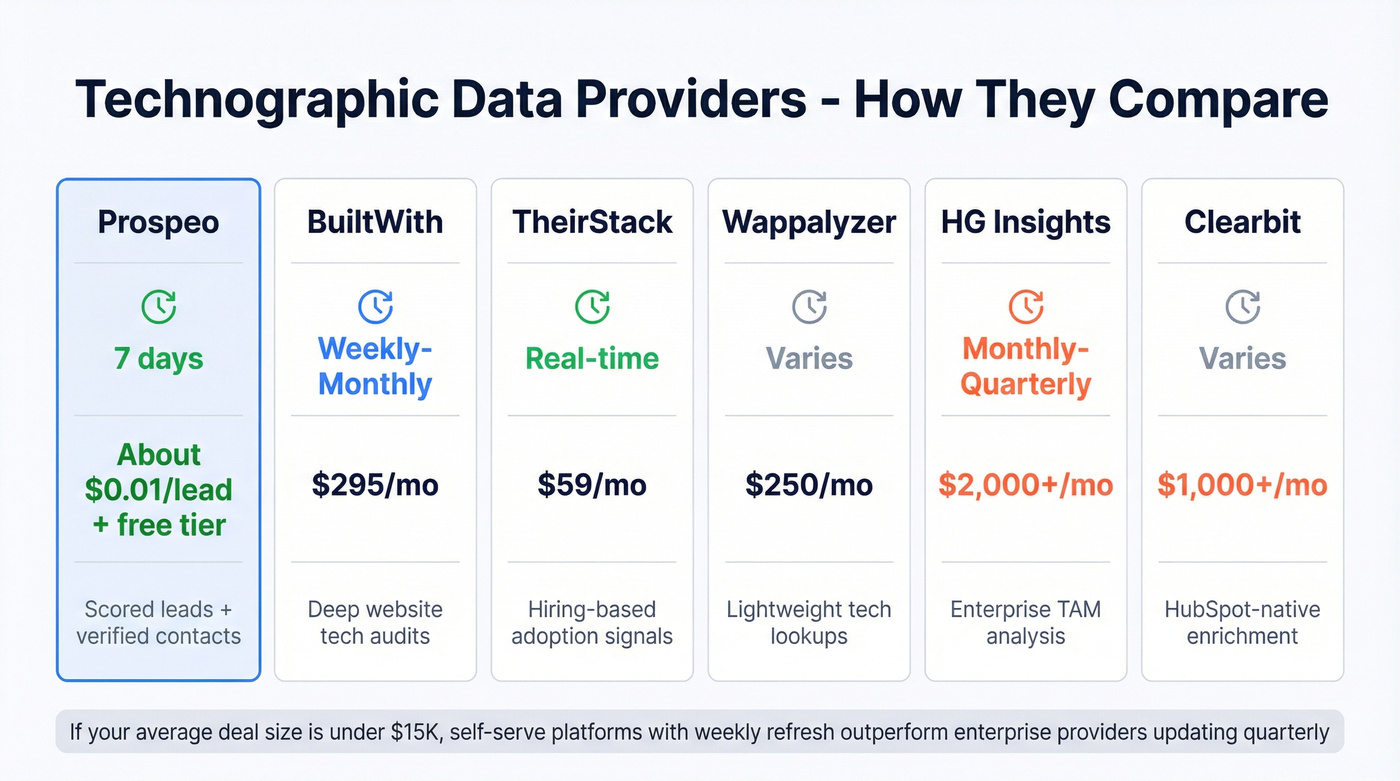
| Prospeo | Multi-signal, 30+ filters | 7 days | ~$0.01/lead, free tier | Scored leads + verified contacts |
| BuiltWith | Website detection, 100K+ techs | Weekly-monthly | $295-$995/mo | Deep website tech audits |
| TheirStack | Job-posting signals, 32K+ techs | Real-time | $59-$400/mo | Hiring-based adoption signals |
| Wappalyzer | Browser detection, 1,800+ techs | Varies | From $250/mo | Lightweight tech lookups |
| HG Insights | Enterprise install-base | Monthly-quarterly | ~$2,000-$5,000+/mo | Enterprise TAM analysis |
| Clearbit | Enrichment API, moderate | Varies | ~$1,000-$2,500+/mo | HubSpot-native enrichment |
The critical differentiator is what happens after detection. BuiltWith can tell you a company runs Marketo. Prospeo can tell you that plus give you the VP of Marketing's verified email at 98% accuracy and their verified mobile number from a database of 125M+ verified mobiles - along with in-market intent signals across 15,000 topics, all refreshed every 7 days. Your scoring model works with data from this week, not last quarter.
For teams that need deep frontend technology audits - tracking every JavaScript library and CDN configuration - BuiltWith's 100,000+ technology coverage is unmatched. For hiring-based adoption signals, TheirStack's job-posting analysis across 172M+ postings catches technology adoption early in the buying cycle.
Here's the thing: if your average deal size is under $15K, you don't need an enterprise technographic provider charging $2,000+/month. A self-serve platform with weekly refresh and verified contacts will outperform an expensive install-base database that updates quarterly and still makes you buy contact data separately. (If you're building this into an ABM motion, align provider choice with your ABM lead scoring rules and routing.)
The matrix above works best when technographic signals arrive pre-verified and ready for your CRM. Prospeo pushes enriched records with 50+ data points directly into HubSpot or Salesforce - including tech stack, intent data across 15,000 topics, and 98% accurate emails so your SDRs act on scores immediately.
Technographic scoring without verified contacts is just a spreadsheet exercise.
5 Mistakes That Kill Your Model
1. Scoring on stale data. A company can adopt and abandon a tool between quarterly refreshes. If your provider updates monthly or quarterly, your scores are fiction by the time sales acts on them.

2. Over-weighting generic signals. "Uses a CRM" tells you nothing. "Uses Salesforce Enterprise, adopted 3 months ago" tells you everything. Granularity is the difference between a useful model and an expensive guessing game.
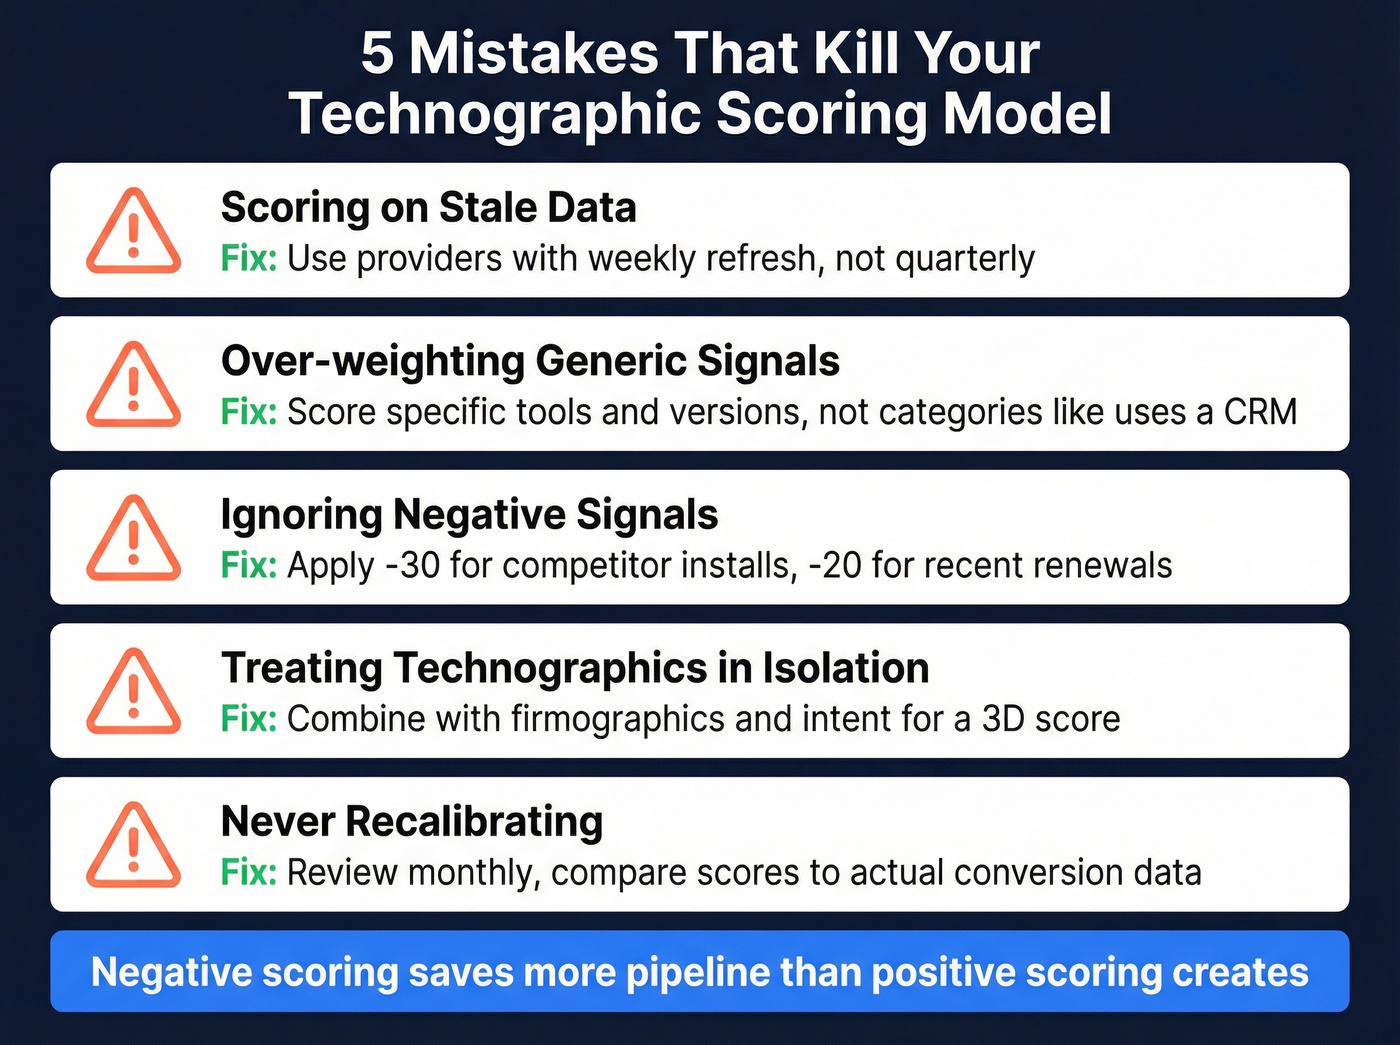
3. Ignoring negative signals. Most teams only score positively. They miss the accounts running competitor products on multi-year contracts - the ones that won't convert regardless of how many emails you send. Negative scoring saves more pipeline than positive scoring creates.
4. Treating technographics in isolation. Technographic fit without firmographic fit is incomplete. A 5-person startup running your ideal tech stack isn't the same opportunity as a 500-person company running it. Combine technographics with firmographics and intent for a three-dimensional score. Layering signals like recent tool adoption on top of firmographic filters surfaces accounts that are both a strong fit and actively in-market. (More on combining datasets: firmographic and technographic data.)
5. Never recalibrating. Your scoring model is a hypothesis. After 90 days, you'll have enough conversion data to know which signals predict deals and which are noise. Monthly review cadence is non-negotiable. Skip it and your model drifts further from reality every quarter. The consensus on r/sales and r/RevOps is the same - teams that set and forget their scoring models end up worse off than teams that never scored at all, because stale scores create false confidence.
Measuring the Impact
Here's how to know it's working. After 90 days, measure these benchmarks against your pre-scoring baseline.
MQL-to-SQL conversion should land in the 25-35% range for a healthy scoring model. High-alignment organizations - where technographic fit, firmographic fit, and intent all converge - hit 40-50%. Below 20% means your signals need recalibration. (If your handoffs are messy, tighten definitions and SLAs with an AI lead qualification workflow.)
Win rates tell the deeper story. Leads that score in the top tier on technographic fit should convert at 30-45%, well above the 20-30% baseline. B2B campaigns using technographic data see 28% higher conversion rates on average. If your top-score leads aren't meaningfully outperforming your average leads, your point weights are wrong - go back to step 6. (Also make sure your underlying enrichment isn’t drifting - use a CRM hygiene cadence to keep scoring inputs clean.)
Let's be honest: the first version of your model won't be perfect. Ours wasn't. But a rough model that gets recalibrated monthly beats a "perfect" model that sits untouched in a spreadsheet. Ship it, measure it, fix it.
FAQ
What is technographic data?
Technographic data describes the technologies a company uses - their CRM, marketing automation, cloud infrastructure, security tools, and development stack. It reveals what software a prospect has adopted, when they adopted it, and how their stack compares to your ideal customer profile. That makes it one of the strongest fit signals for B2B scoring models.
How is it different from firmographic data?
Firmographic data describes a company's structure - industry, size, revenue, location. Technographic data describes their technology stack. Both feed the "fit" dimension of lead scoring, but technographics tells you whether your product integrates with or replaces what they already use. Firmographics can't make that distinction.
How do you use technographic data for lead scoring?
Define 3-5 technologies your best customers use, then enrich your CRM with a provider that refreshes weekly. Assign positive points for complementary platforms and integration-ready stacks, negative points for competitor installs and recent renewals, and set your MQL threshold at the top 20% by score. Recalibrate monthly against conversion data.
What are technographic intent signals?
Technographic intent signals are technology-related changes - like adopting a new tool, upgrading a platform, or posting job listings for specific tech skills - that indicate a company is actively evaluating solutions. Unlike static stack snapshots, these signals capture momentum and timing, making them valuable for prioritizing accounts that are ready to buy now rather than someday.
What tools provide technographic data for scoring?
BuiltWith and Wappalyzer detect website technologies through browser-based scanning. TheirStack tracks adoption through job postings. HG Insights and Clearbit serve enterprise and HubSpot-native use cases. Prospeo combines technographic filtering with 98% verified emails, intent data across 15,000 topics, and a 7-day refresh cycle - starting with a free tier at about $0.01/lead.