Time Series Sales Forecasting: What Actually Works (and What Breaks)
A RevOps lead we know ran a forecasting project last quarter. Thousands of SKUs, 36 months of history, an XGBoost model with 15 engineered features. The model predicted a near-zero seller would move 400 units next month. The actual number? Two. That's what happens when you throw ML at time series sales forecasting without understanding the fundamentals.
What Time Series Analysis for Sales Forecasting Actually Is
Time series analysis uses historical, time-ordered data to predict future revenue or unit volume. Most sales time series break down into four components: trend - the long-term direction; seasonality - recurring patterns tied to calendar periods; cycles - longer economic or business fluctuations; and noise - the random variation you can't model away.
Use time series methods when you have consistent historical data at regular intervals. Don't use them when your product is brand new or when a market disruption has made history irrelevant. A handful of quarterly observations isn't enough either - use judgment-based or causal models instead.
What You Need (Quick Version)
- Start with ETS or ARIMA, not deep learning. Simple models are your baseline, and they're surprisingly hard to beat.
- Expect 25-40% MAPE at the SKU level - that's normal, not a failure.
- Use walk-forward validation, never a single train/test split.
- Don't use exogenous features you won't have at forecast time.
- Clean your pipeline data first. Garbage in, garbage out - no algorithm fixes bad inputs.
Which Model to Use (and When)
| Model | Min Data | Best For | Watch Out For |
|---|---|---|---|
| ETS | 24+ months | First baseline, interpretable | No exogenous variables |
| ARIMA / SARIMA | 24-36+ months (monthly) | Single series, autocorrelation | Assumes stationarity |
| LightGBM / XGBoost | 36+ months | Multi-series, exogenous features | Overfits sparse data |
| Prophet | 1-2+ years (daily is where it shines) | Daily data with holidays | Often underwhelming for monthly B2B |
| LSTM / Deep Learning | 1,000+ series | Large-scale, dedicated eng team | Massive overkill for most |
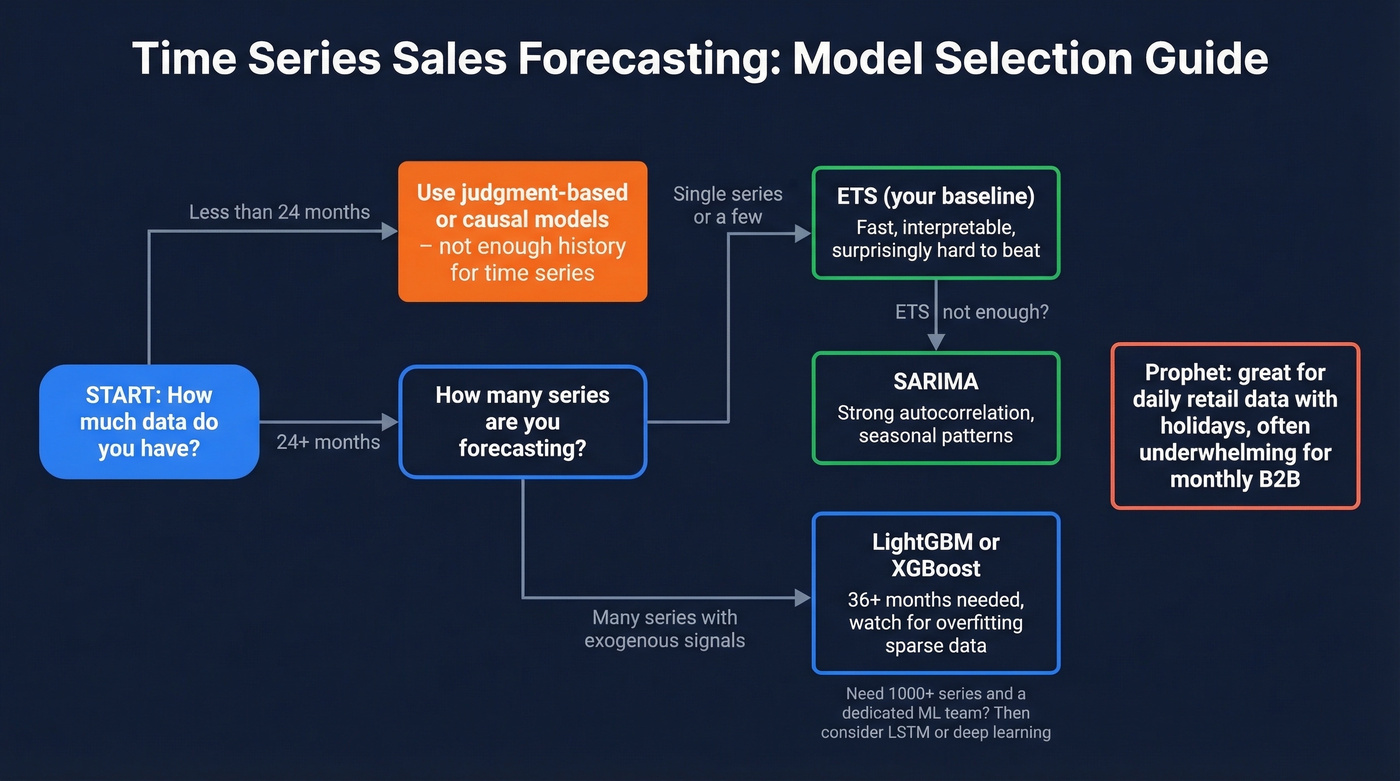
Start with ETS. Seriously. It's fast, interpretable, and gives you a baseline that's often hard to beat on most monthly B2B datasets. If ETS falls short, move to SARIMA for strong autocorrelation, or LightGBM when you have many series and genuinely useful exogenous signals. ARIMA sales forecasting remains a go-to for single-series problems because it explicitly models the autoregressive and moving-average structure most revenue data exhibits.
Prophet is the most over-recommended forecasting tool in existence. It's excellent for daily data with strong holiday effects - retail foot traffic, e-commerce transactions. For monthly B2B revenue with 36 data points? Mediocre.
LSTM and deep learning sit at the bottom of our ranking. Unless you have thousands of related series and a dedicated ML engineering team, you're adding complexity without adding accuracy. For an example of how people approach this in coursework, here's a Stanford CS229 retail sales forecasting project. Tools like TimeGPT are generating buzz, but for most B2B sales teams with limited series, they're a solution looking for a problem.
Here's the thing: a 2026 Deloitte survey of 1,854 executives found only 6% achieved AI ROI in under a year. If the biggest companies in the world can't make complex ML pay off quickly, your 50-person sales org probably shouldn't start there either. ETS first. Always.
What Goes Wrong in Practice
Sparse History and Intermittent Demand
The scenario from this Reddit thread is painfully common: thousands of MSKUs at the location level, only 36 monthly data points per SKU, roughly 50% zeros. The practitioner trained category-level XGBoost models with 15 engineered features and still got absurdly high predictions for near-zero sellers.
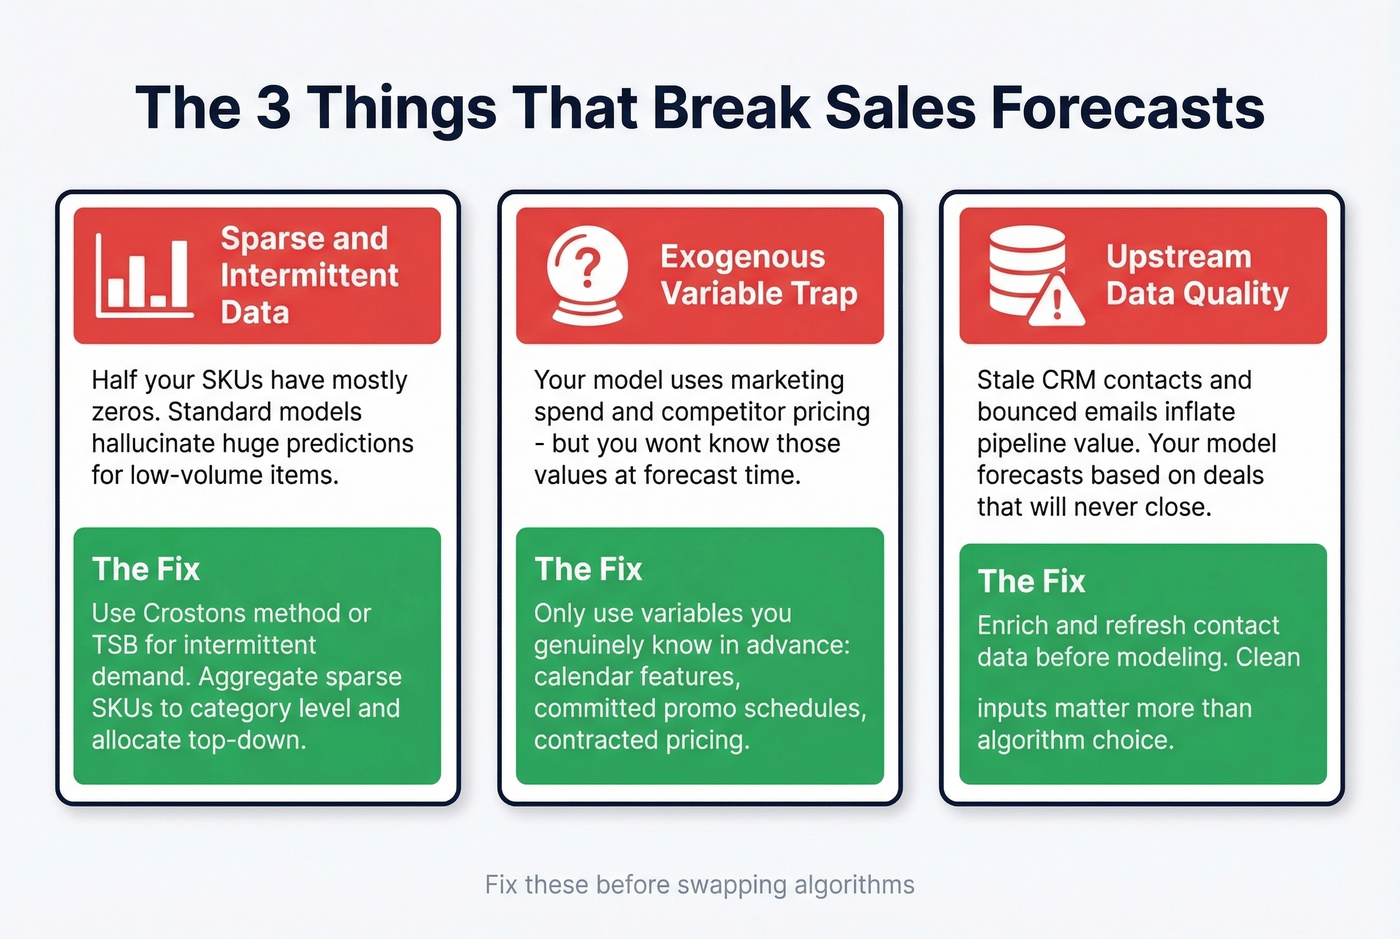
Standard models assume your series has signal to extract. When half your observations are zeros, there's barely any signal to find. For intermittent demand, use Croston's method or TSB (Teunter-Syntetos-Babou). Or aggregate sparse SKUs into category-level forecasts and allocate top-down - the consensus on r/datascience threads is that this approach works far more reliably than forcing granular models on noisy data.
The Exogenous Variable Trap
You build a model using marketing spend, economic indicators, and competitor pricing. It looks great in backtesting. Then you realize you don't know next quarter's marketing spend at forecast time.
The standard advice - "forecast the predictors too" - creates brittle multi-model dependency chains where errors compound. Only use exogenous variables you genuinely know in advance: calendar features, committed promotional schedules, contracted pricing. Sales activity metrics like email response rates or meeting-to-close ratios can work too, but only if they're reliably available at forecast time.
Upstream Data Quality
This one frustrates us more than any modeling problem. Pipeline-based revenue forecasts inherit every data quality issue in your CRM. Stale contacts, bounced emails, outdated job titles - they inflate pipeline value with deals that'll never close. Your model sees inflated pipeline and forecasts accordingly.
Before touching any model, preprocess your data: use z-score or IQR methods to flag outliers, interpolate missing values rather than dropping them, and apply log transforms to stabilize variance in skewed series. On the CRM side, cleaning contact data upstream makes a real difference - tools like Prospeo's enrichment API keep pipeline records current with a 7-day refresh cycle, so the numbers feeding your forecast reflect reality rather than decay.
If you’re evaluating vendors, it also helps to compare data enrichment services and set expectations on what “fresh” really means.
Garbage pipeline data is the fastest way to break a forecast. Prospeo's enrichment API refreshes your CRM contacts every 7 days - not the 6-week industry average - so the revenue numbers feeding your model reflect real pipeline, not decayed records with bounced emails and outdated job titles.
Fix your forecast inputs before you fix your forecast model.
How to Validate Without Fooling Yourself
A single train/test split is nearly worthless for time series. Use walk-forward validation: train on a window (say, 5 years), test on the next window (1 year), then roll forward and repeat. This mirrors real operations where models are retrained as new data arrives.
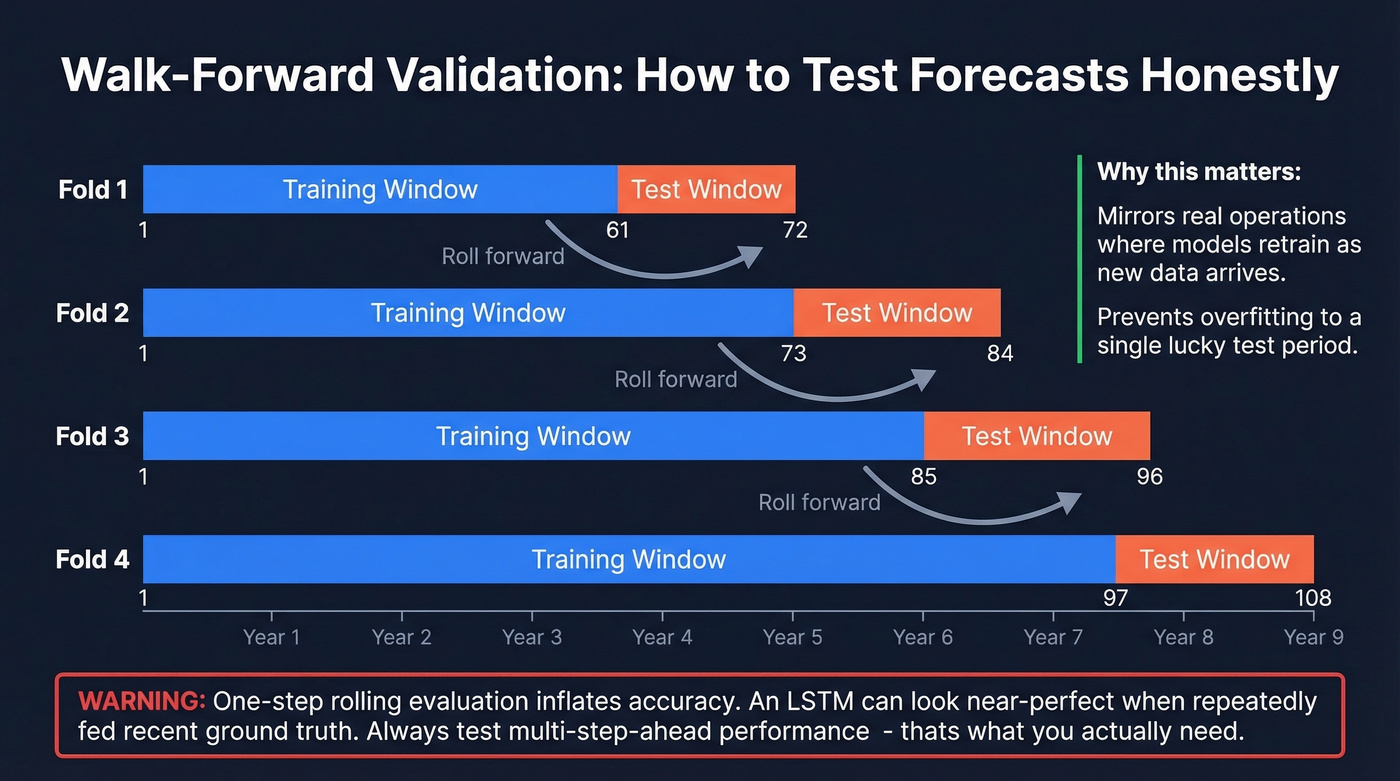
Watch out for one-step rolling evaluation - it's one of the biggest sources of inflated accuracy claims. An LSTM can look near-perfect under one-step rolling because it's repeatedly fed recent ground truth. Multi-step-ahead performance, which is what you actually need, degrades fast. A peer-reviewed analysis in the International Journal of Forecasting found that flawed evaluation setups routinely produce spurious conclusions.
Track these metrics together: MAPE for interpretability, WMAPE for volume-weighted perspective, RMSE for penalizing large errors, directional accuracy, and bias to catch systematic over- or under-prediction. No single metric tells the whole story.
If you’re tying forecasts back to execution, align them with sales operations metrics so the org doesn’t optimize the wrong number.
What Accuracy Should You Expect?
A 2012 survey of demand planning professionals found CPG companies average 39% WMAPE and chemicals companies average 36%. Those numbers shock people who've only seen aggregate forecasts.
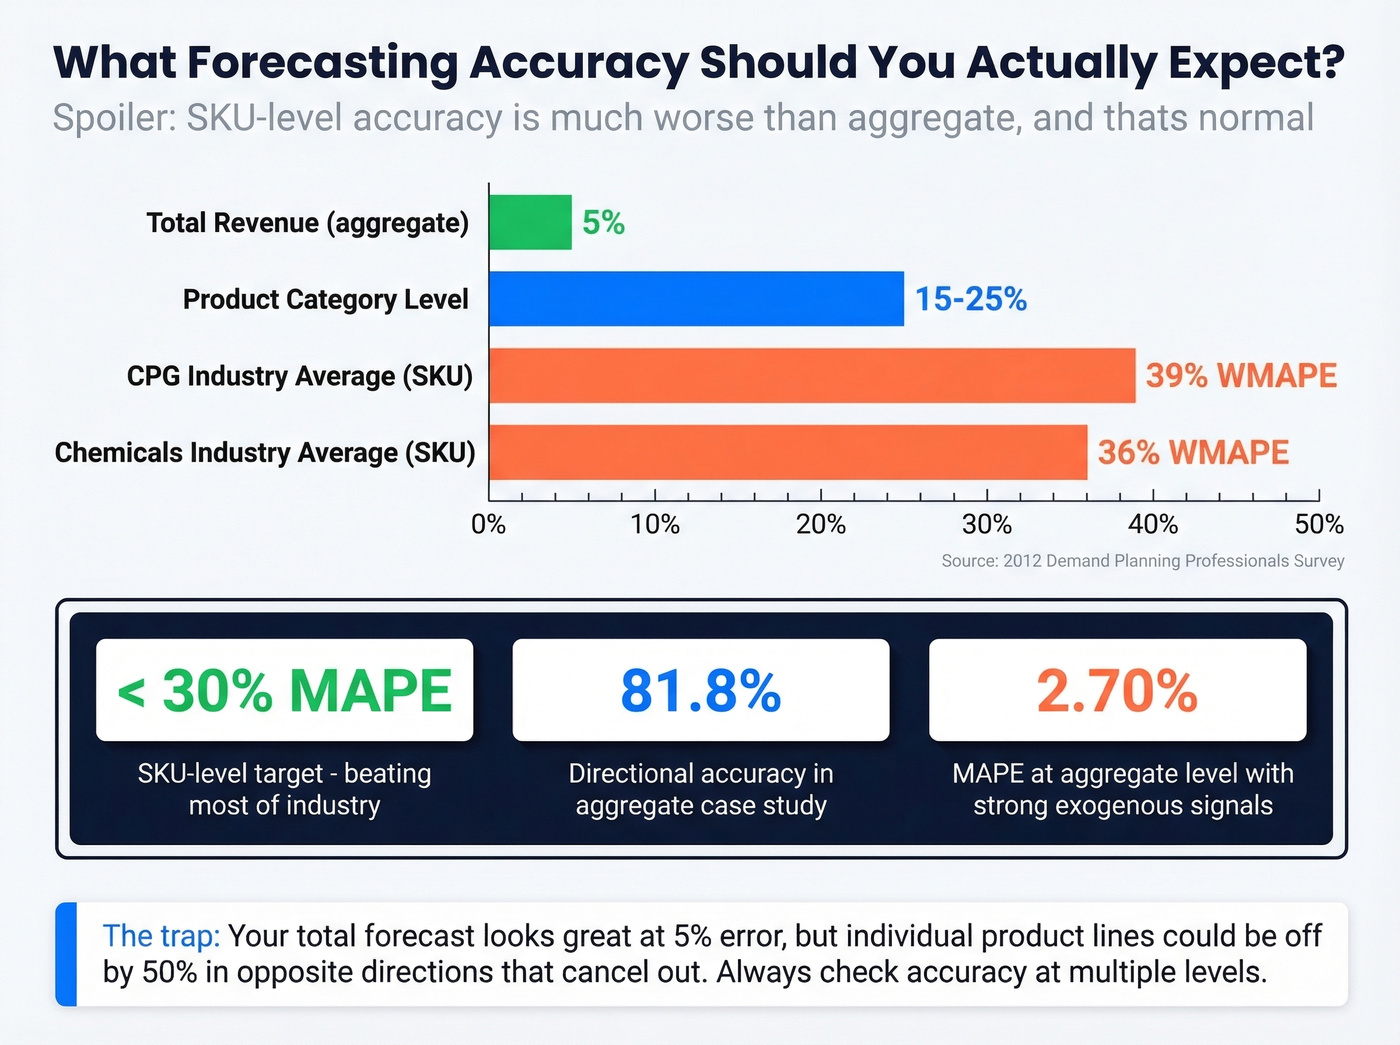
Your total revenue forecast might be within 5%, but individual product lines could be off by 50% in opposite directions that cancel out. One practical case study reported 2.70% MAPE and 81.8% directional accuracy - but at the aggregate transaction volume level with strong exogenous signals. Don't compare your SKU-level results to aggregate benchmarks. If your SKU-level MAPE is under 30%, you're beating most of the industry.
For RevOps teams, it’s also worth separating forecasting from goal-setting - see sales forecast vs sales goal to avoid “sandbagging by spreadsheet.”
Hierarchical Forecasting: The Upgrade Most Teams Skip
This is the single highest-ROI improvement most companies haven't tried.
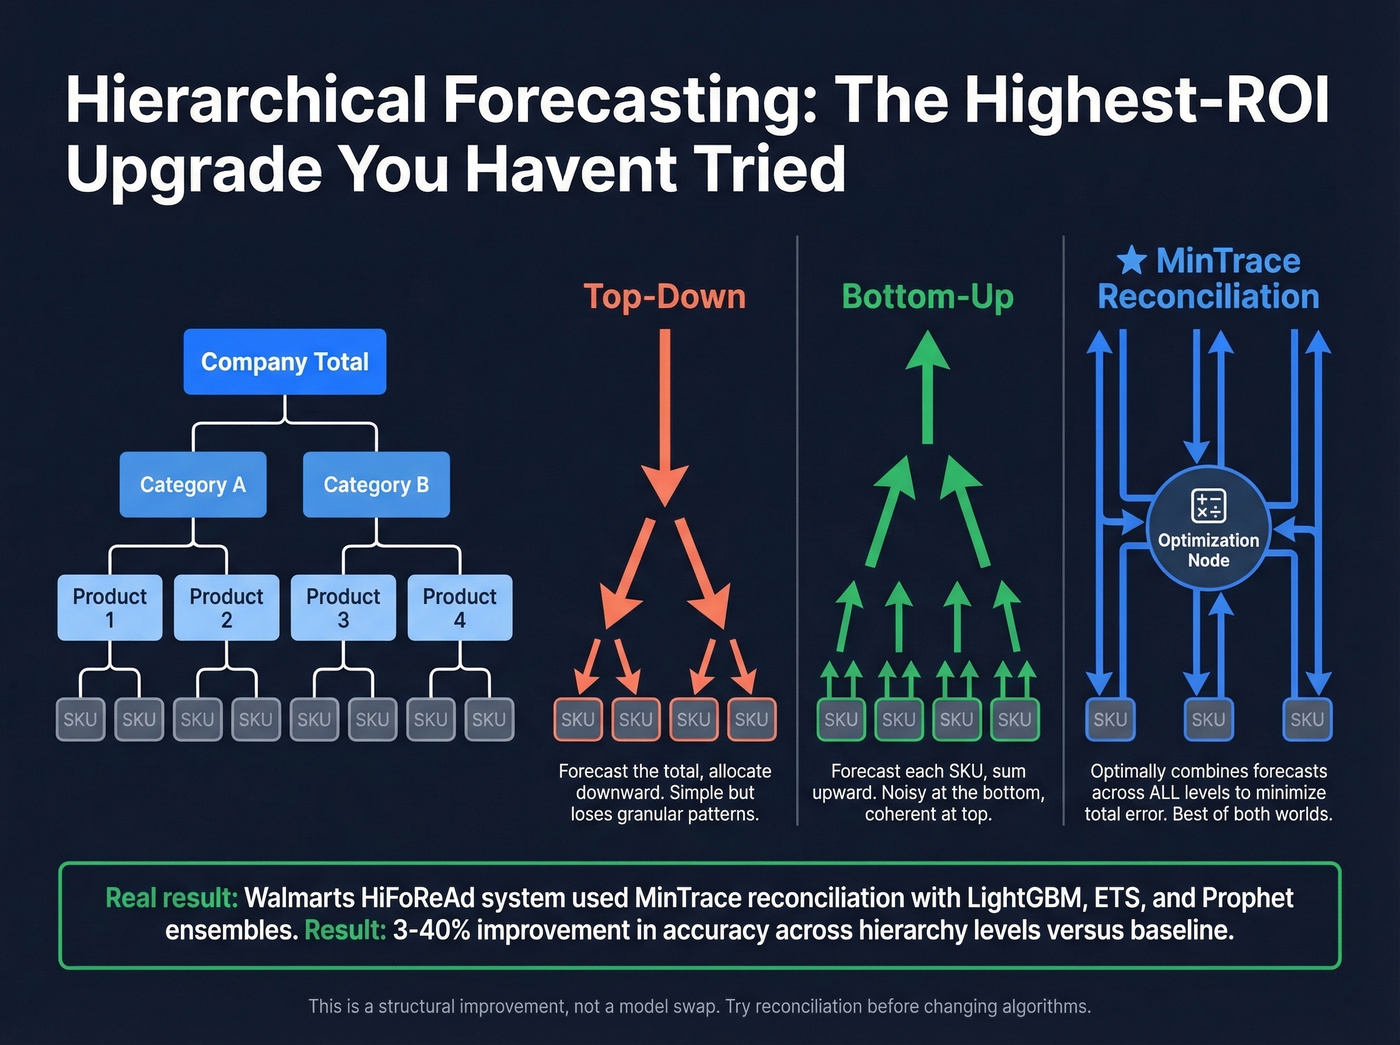
Instead of forecasting each SKU independently, hierarchical forecasting produces predictions at multiple levels - company, category, product, SKU - and reconciles them for coherence. Three approaches dominate: top-down forecasts the total and allocates downward, bottom-up forecasts each SKU and sums upward, and MinTrace reconciliation optimally combines forecasts across all levels to minimize overall error.
Walmart's Global Tech team published their Multi-Stage HiFoReAd system, ensembling base forecasts from LightGBM, MSTL+ETS, and Prophet, then applying reconciliation. They reported 3-40% APE improvement across hierarchy levels versus their baseline. That's a massive gain from a structural change, not a model change. If you're forecasting across dozens of product lines and haven't tried reconciliation, start there before swapping algorithms.
If you’re building this into a broader stack, compare sales forecasting solutions to see what’s native vs what you’ll need to custom-build.
Getting Started Checklist
- Audit CRM data quality. Enrich stale records before building any model - your forecast can't outperform your pipeline data.
- Collect 24-36 months of monthly history minimum.
- Start with an ETS baseline using
statsmodelsor Nixtla'sstatsforecast. - Add complexity only if the baseline fails. SARIMA next, then LightGBM.
- Validate with walk-forward, not a single split.
- Measure bias alongside accuracy. A forecast that's always 20% high is worse than one that's noisy but unbiased.
If you’re operationalizing this inside RevOps, the RevOps Manager playbook is a useful reference for ownership and process.
Let's be honest about what we've seen across dozens of RevOps teams: time series sales forecasting isn't about finding the fanciest algorithm. It's about clean data, honest validation, and choosing the simplest model that meets your accuracy threshold. Get those three right and you'll outperform most teams still chasing the next deep learning paper.
If you’re using forecasting to drive pipeline decisions, start by fixing sales pipeline challenges that distort the inputs.
No time series model can compensate for stale contacts inflating your pipeline value. Prospeo returns 50+ data points per contact at a 92% match rate, with 98% email accuracy and a 7-day refresh cycle. Your forecast deserves inputs that match reality.
Start with clean data - accurate forecasts follow.
FAQ
How much historical data do I need for sales forecasting?
You need a minimum of 24-36 months of monthly data for seasonal models like SARIMA. Weekly data typically requires 2+ years. With fewer than 50 data points, simpler methods like ETS often outperform complex models. Clean, consistent data matters more than sheer volume.
Is ARIMA or machine learning better for predicting sales?
For single-series forecasting with limited data, ARIMA and ETS match or beat ML in most benchmarks. LightGBM and XGBoost excel when you have many related series and strong exogenous signals. Deep learning rarely wins unless you have 1,000+ series and dedicated engineering resources. Decomposing trend, seasonality, and residuals before model selection matters far more than which algorithm you pick.
How do I handle products with zero or intermittent sales history?
Use Croston's method or TSB, designed specifically for series dominated by zeros. Or aggregate sparse SKUs into category-level forecasts and allocate top-down. Never force-fit ARIMA or Prophet on a series that's mostly zeros - you'll get the absurd predictions that haunt r/datascience threads.
How does CRM data quality affect revenue forecasts?
Pipeline-based forecasts inherit every data quality problem in your CRM. Stale contacts and bounced emails inflate pipeline value with deals that won't close. Verifying and enriching contact records before they reach your model ensures pipeline metrics reflect reality rather than decay - we've seen teams cut forecast error by double digits just by cleaning their inputs.