How to Calculate Total Available Market (With an Auditable Workflow)
Your cofounder wants to slap a $10B TAM on the pitch deck using a single Gartner screenshot and some back-of-napkin math. Investors will nod politely, then move on. If your total available market calculation can't be audited, it's not a TAM - it's a guess.
Let's build one that holds up.
What You Need (Quick Version)
Three priorities, in order:
- Define your ICP and unit of value. What do you sell (seats, API calls, GB), and who buys it? (If you need a starting point, use an Ideal Customer Profile template.)
- Build bottom-up TAM. Count target entities x price per entity. This is the number that matters.
- Reconcile with a top-down sanity check. Use the 3x rule - if top-down and bottom-up diverge by more than three times, your assumptions are broken.
Underscore VC puts it bluntly: the market size slide is commonly wasted when founders paste analyst numbers. Bottom-up shows you understand your customer. Top-down alone shows you can Google.
Three Methods, One Sentence Each
Top-down: Start with an industry report's total figure, then filter by segment, geography, and product fit. Bottom-up: Count potential customers, multiply by what they'd pay, build up. Value theory: Estimate willingness to pay based on the value you deliver, not current pricing norms.
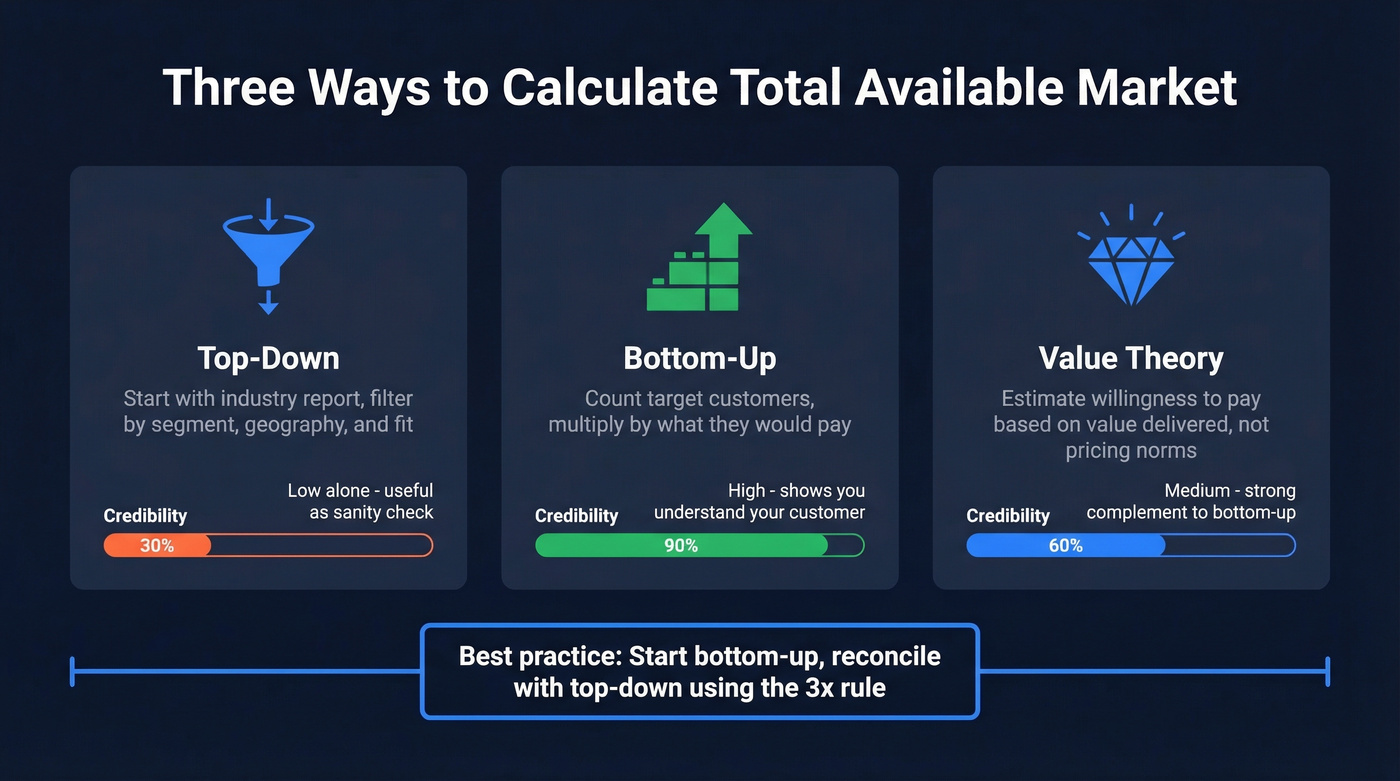
Top-down alone isn't a calculation. It's a citation. Every credible TAM sizing exercise starts bottom-up and uses top-down to triangulate.
The hardest step in any TAM calculation is getting a defensible entity count. Prospeo's B2B database gives you 300M+ profiles filterable by industry, headcount, funding stage, technographics, and 15,000 intent topics - so you can go from ICP definition to auditable account count without stitching together Census data and guesswork.
Turn your ICP filters into a live, exportable target account list.
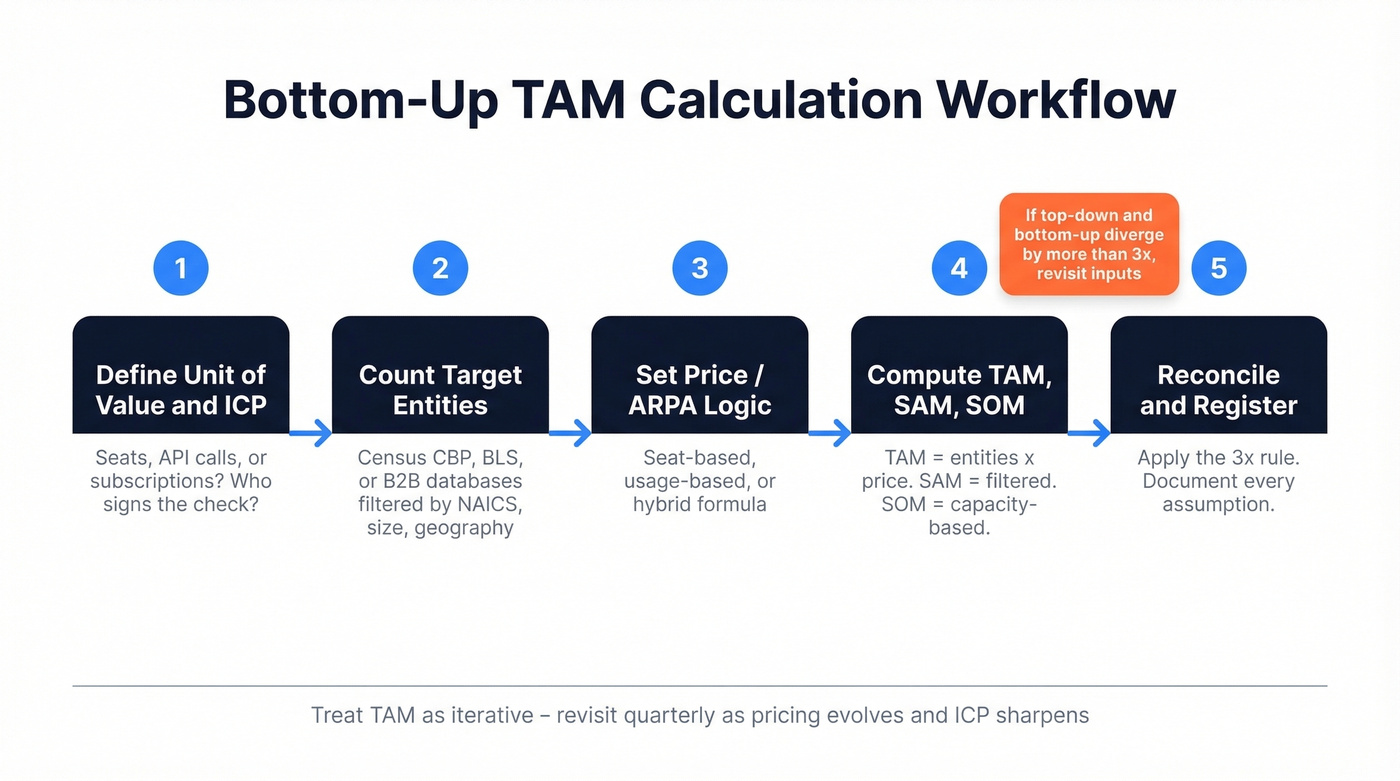
Step-by-Step TAM Workflow
Define Your Unit of Value and ICP
Start with what you actually sell - a seat, an API call, a monthly subscription with usage overages. This determines your pricing formula. Then define who buys it: firmographic filters (industry, headcount, revenue range) plus the role that signs the check.
A 50-person company with no VP of Engineering isn't buying your DevOps platform.
Count Your Target Entities
This is the step founders bring up constantly in practitioner discussions: for niche segments, "data is seemingly unavailable" is the common complaint. It's not. You just need to know where to look.
US Census County Business Patterns (CBP) gives establishment counts by NAICS code, employee size, and geography. BLS provides role counts by industry. SEC filings offer financial benchmarks for public companies. The workflow: pick your NAICS codes, pull establishment counts, filter by employee size band and geography, then map to your ICP. You'll have a defensible entity count in an afternoon.
For B2B companies that need to go deeper than Census data, Prospeo lets you filter 300M+ professional profiles by 30+ criteria - industry, headcount, funding stage, technographics, intent signals - turning the "count your target entities" step from a spreadsheet exercise into a live, filterable account universe you can export directly.

Think in micro-TAMs. Don't stop at one giant number. Segment your TAM by industry vertical, company size band, or use case. This tells you which slices to attack first and gives investors a prioritized capture story instead of a single monolithic figure.
Set Your Price / ARPA Logic
Three formulas cover most SaaS models:
- Seat-based: seats per account x price per seat x number of accounts
- Usage-based: units per account x price per unit x number of accounts
- Hybrid: (seats x $/seat + usage x $/unit) x number of accounts
A Monetizely study of 103 SaaS pricing pages found the median entry-level plan at $29/user/month. Hybrid models now account for 61% of SaaS pricing, and usage-based adoption has hit 43%. Enterprise ACV medians by seat count:
| Seat Band | Median ACV |
|---|---|
| Sub-100 | $47k |
| 100-500 | $156k |
| 500-1,000 | $412k |
| 1,000+ | $890k |
Use these as guardrails when your own pricing data is thin.
Compute TAM, Then SAM and SOM
TAM = full addressable count x full price. That's the theoretical ceiling - no company ever captures it. Some founders use "total attainable market" interchangeably with TAM, but the intent is the same: the maximum revenue opportunity if every qualified buyer purchased your product.
SAM narrows the frame by applying geographic constraints, segment focus, and distribution channel reach. SOM - the service obtainable market - is the only number that belongs in your operating plan.
Build SOM from capacity: SDRs x accounts per year x meeting conversion x win rate x ACV. A worked example from MirMeridian: 10,000 target companies, 2 SDRs each working 500 accounts/year, 20% meeting-to-opportunity rate, 25% win rate, $30k ACV = $1.5M SOM. That's honest. That's fundable.
Reconcile and Sanity-Check
Run your bottom-up number against a top-down estimate from Gartner, IDC, or Statista. In our experience, the 3x rule catches the vast majority of broken assumptions before they reach the pitch deck. If top-down and bottom-up diverge by more than 3x, revisit your entity count, pricing assumptions, or segment definition.
Triangulation isn't optional.
The other failure mode is underestimation: top-down approaches can miss disruptive products that change behavior or create entirely new categories. We've seen teams undercount their TAM by 5x because the Census data didn't capture a market segment that didn't exist three years ago.
Build an Assumption Register
Every input in your model should live in a table:
| Input | Value | Source | Date | Confidence | Sensitivity |
|---|---|---|---|---|---|
| Target accounts | 14,200 | Census CBP | 2024 | High | Medium |
| Avg seats/account | 12 | Internal data | 2026 | Medium | High |
| Price/seat/mo | $49 | Pricing page | 2026 | High | High |
Treat TAM as iterative. Revisit quarterly as pricing evolves and your ICP sharpens.
Total Available Market Example: B2B SaaS
You're building project management software for mid-market companies with 100-500 employees. Pull your NAICS codes and the 100-499 employee band from Census CBP, then map to your ICP. For this example, assume you end up with ~40,000 US establishments in-scope.
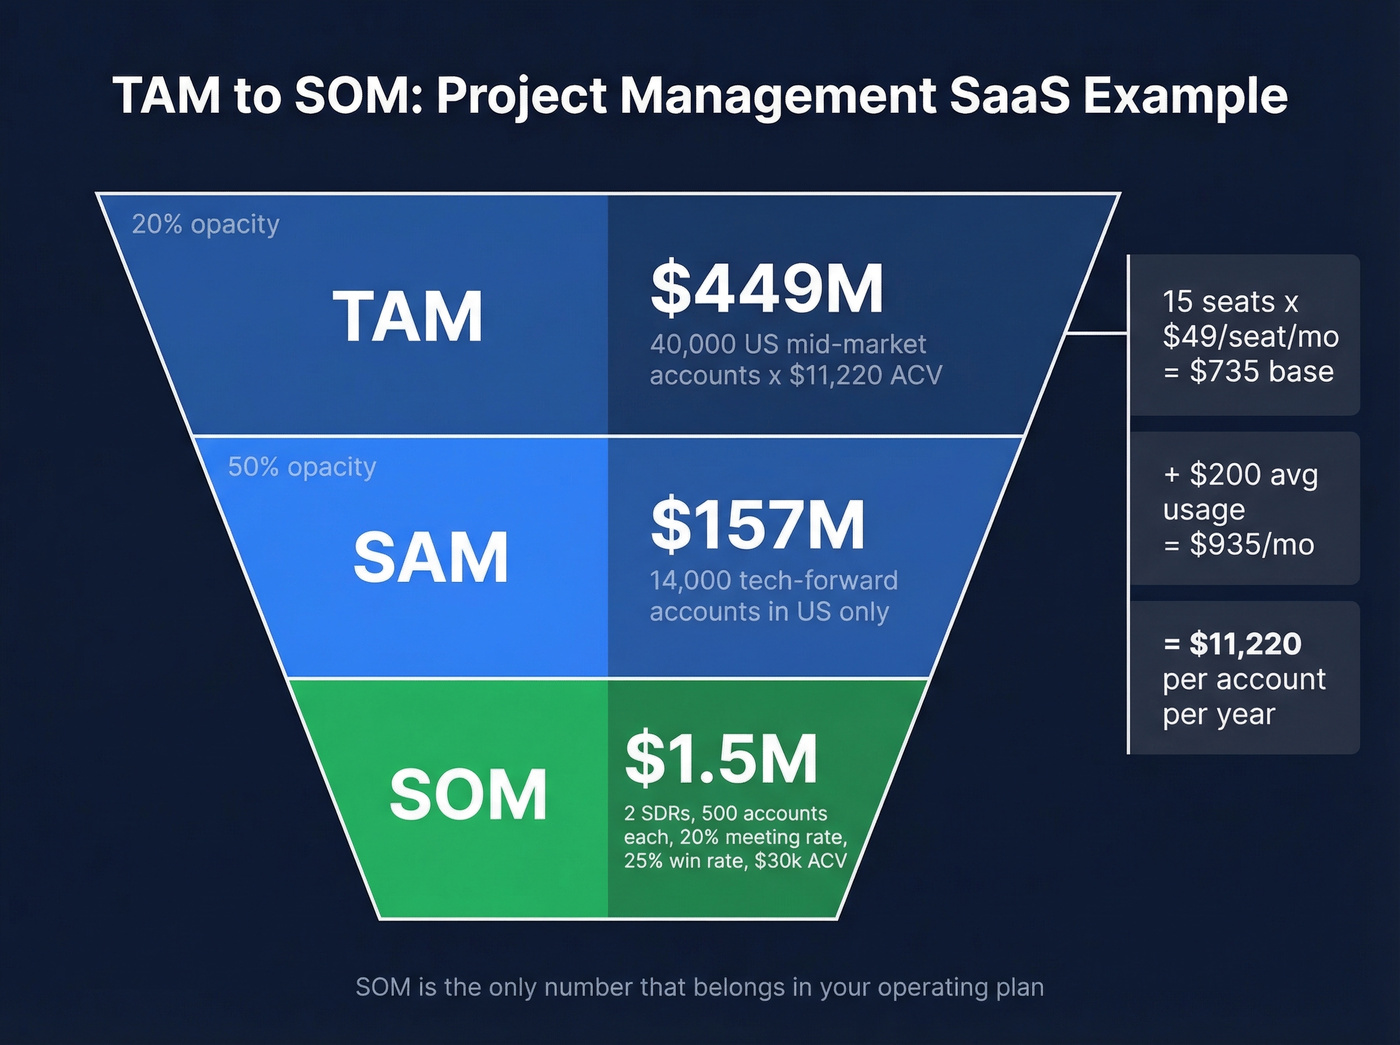
Hybrid pricing: 15 seats x $49/seat/month = $735 base + $200 average usage = $935/month per account, or ~$11,220/year.
TAM: 40,000 x $11,220 = ~$449M. SAM (US-only, tech-forward verticals): narrow to ~14,000 accounts and you get ~$157M. SOM (Year 1, capacity-based): $1.5M.
That's a story investors can audit. Notice how distributing your addressable market across TAM, SAM, and SOM tells a much clearer go-to-market narrative than a single headline number ever could. (If you want a deeper explainer, see our guide to addressable market.)
Common Mistakes
Here's the thing - we've reviewed dozens of pitch decks where the TAM slide was the weakest in the entire presentation. The same errors keep showing up:
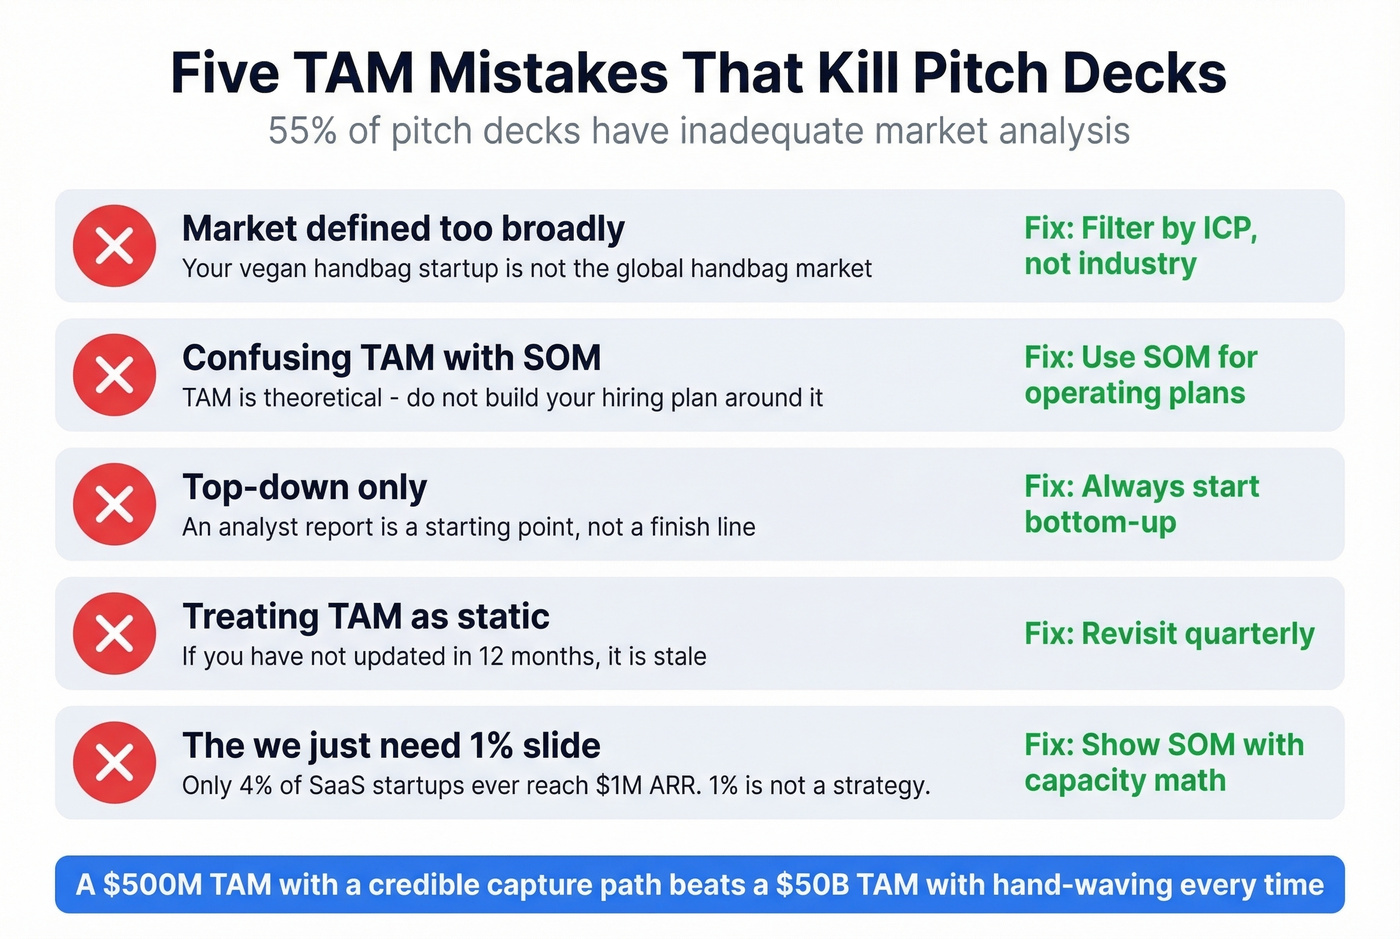
- Defining the market too broadly. Your luxury vegan handbag company doesn't get to claim the global handbag market.
- Confusing TAM with SAM or SOM. TAM is theoretical. Don't build your hiring plan around it.
- Relying solely on top-down. An analyst report is a starting point, not a finish line.
- Treating TAM as static. Markets shift with technology, regulation, and buyer behavior. If you haven't updated your TAM in 12 months, it's stale.
- The "we just need 1% of the market" slide. Only 4% of SaaS startups ever reach $1M ARR. Only 0.4% hit $10M. "Just 1%" isn't a strategy - it's a prayer.
Skip the "1% slide" entirely. Replace it with your SOM calculation and the capacity math behind it.
Presenting TAM in a Pitch Deck
A common SOM ramp heuristic: 1% of SAM in Year 1, 3% in Year 2, 5% in Year 3. Your SOM must reconcile with your financial model, headcount plan, and sales cycle length - across 82 decks reviewed by Whitepage Studio, 55% had inadequate market analysis. That's more than half of all founders failing the most basic investor diligence test.
A common SaaS investor benchmark: TAM north of $1B, with a $5-20B "sweet spot" for high-growth potential.
A $500M TAM with a credible 10% capture path beats a $50B TAM with hand-waving every time. Investors grade your logic, not your market size. (For the GTM side, pair this with sales deck storytelling and a clear go-to-market strategy.)
Your SOM calculation depends on reaching real buyers. Prospeo delivers 98% email accuracy and 125M+ verified mobile numbers with a 30% pickup rate - so the capacity model you build actually converts. Teams using Prospeo book 26% more meetings than ZoomInfo users.
Go from TAM spreadsheet to booked meetings without switching tools.
FAQ
What's the difference between TAM, SAM, and SOM?
TAM is total theoretical revenue if you had 100% market share - every possible buyer, everywhere. SAM is the segment you can actually serve given your product scope, geography, and channels. SOM is what you can realistically capture given sales capacity, competition, and go-to-market motion. Build your operating plan around SOM, not TAM.
Which method do investors prefer for TAM sizing?
Most VCs prefer bottom-up because it proves you understand your customer, your pricing, and your reachable segment. Top-down numbers from analyst reports are useful as sanity checks, not as your primary figure. Show your work - the process matters more than the output.
How do I validate my total available market calculation?
Run your bottom-up figure against at least one top-down estimate from Gartner, IDC, Statista, or McKinsey. Apply the 3x rule: if the two numbers diverge by more than three times, one of your inputs - entity count, pricing, or segment definition - is wrong. Triangulate, fix the gap, and document every assumption in a register so investors can audit your logic.
What tools help build a bottom-up entity count?
US Census CBP data gives establishment counts by NAICS code and employee size for free. For B2B-specific filtering with technographics, funding stage, and headcount growth, Prospeo's database covers 300M+ profiles with 30+ filters, letting you export a live account list instead of manually cross-referencing spreadsheets. Crunchbase and PitchBook are useful for startup-focused segments.