Total Serviceable Market: The Only Market-Sizing Metric That Matters
Every TAM article starts the same way: "$X billion opportunity." Then it buries the metric you actually need - SAM - under three paragraphs of definitions you already know. The total serviceable market is where strategy lives, where budgets get built, and where founders either earn investor trust or lose it. TAM is vanity. SAM is the number that tells you what you can actually go win.
And below SAM, there are two layers - ISOM and WISOM - that reveal why your real market can be 1,500x smaller than TAM.
Quick terminology note: "total serviceable market" is SAM. The acronym stays stable, but the middle word drifts - you'll see "serviceable addressable market" and "serviceable available market" depending on who's writing. Salesforce uses "serviceable available," HubSpot uses "serviceable addressable." Same concept. Don't let the naming trip you up.
The Three Layers at a Glance
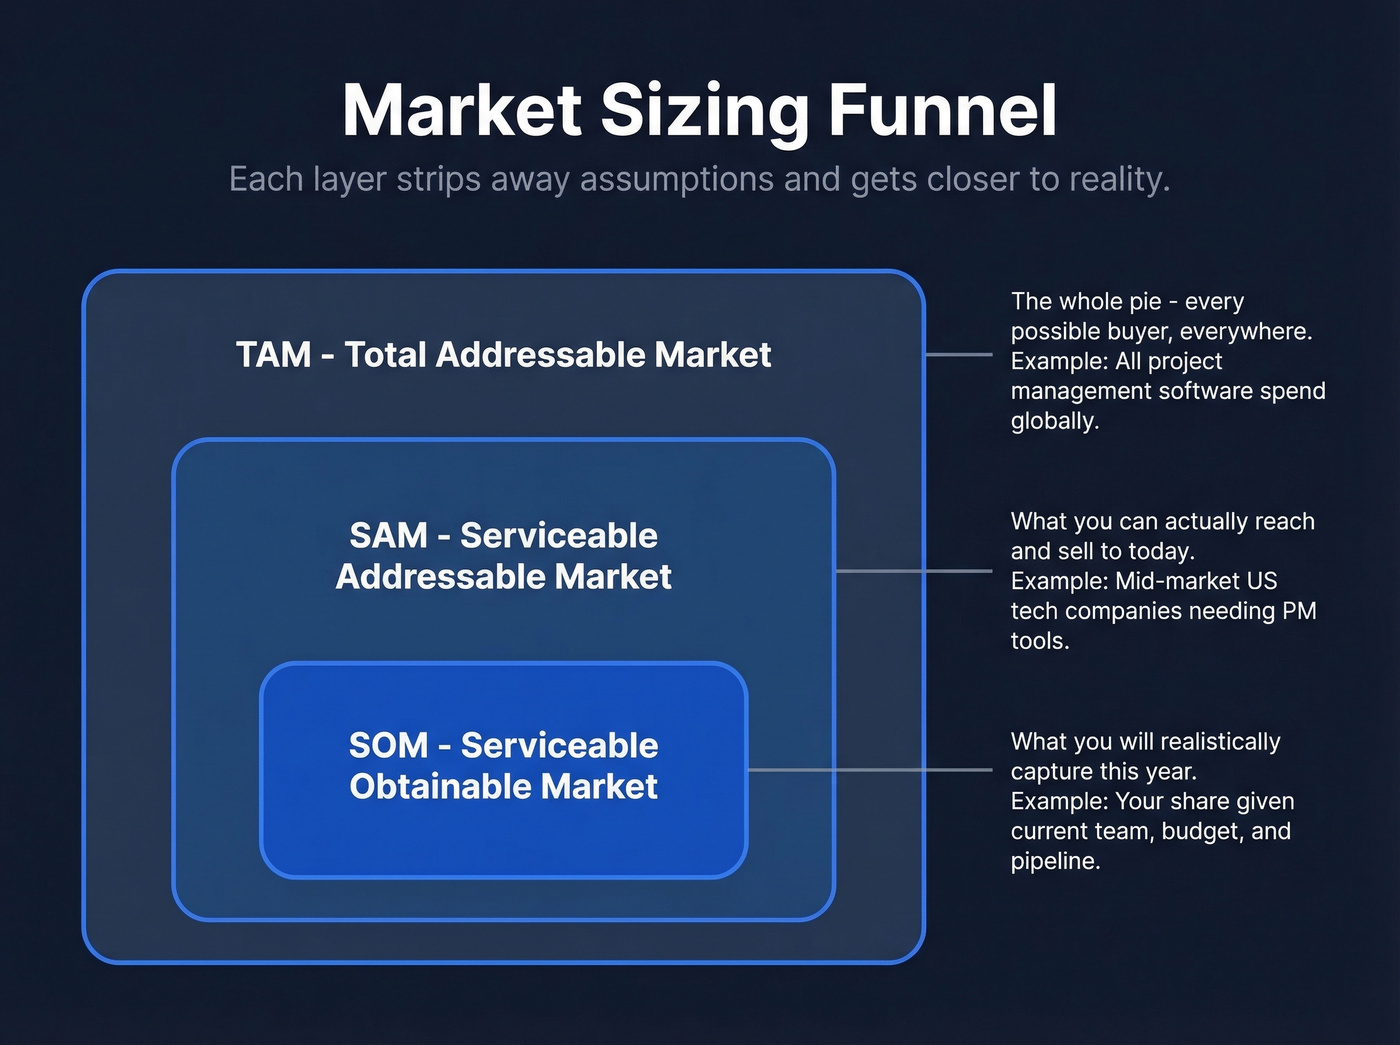
- TAM - total addressable market. The theoretical ceiling if you had zero competition and infinite resources.
- SAM - serviceable addressable/available market. The slice of TAM you can realistically reach and sell to today, given your geography, product, and go-to-market.
- SOM - serviceable obtainable market. What you can actually capture in a given timeframe.
Three calculation methods exist: top-down, bottom-up, and value-theory. The bottom-up method is the most reliable. Start with SAM, not TAM - it's the metric that drives real planning, real budgets, and real investor confidence.
TAM, SAM, and SOM Explained
Here's the full framework before we get to calculation methods.
| Metric | What It Answers | Example |
|---|---|---|
| TAM | How big is the whole pie? | All spend in your category, globally |
| SAM | How much can we reach? | Your category, in your geos + segments you can sell today |
| SOM | How much will we capture? | Your realistic share in a defined timeframe |
TAM is the theoretical maximum - every possible buyer, everywhere, regardless of whether you can actually sell to them. SAM narrows that to the portion relevant to your model, audience, and capabilities. SOM narrows further to what you'll realistically win given your current resources.
Scalepath offers useful operational tests for both layers. For SAM: "If this customer came to us organically, could we actually sell to them?" If yes, they're in your SAM. If they need enterprise features you haven't built or they're in a geography you don't cover, they belong in TAM, not SAM. For SOM: "Is this customer in our core target market, and do we have referenceable customers like them already?" If not, they're SAM but not SOM.
The funnel logic is simple: TAM → SAM → SOM. Each layer strips away assumptions and gets closer to reality. Most teams make the mistake of planning against TAM when they should be planning against SAM.
How to Calculate SAM
Top-Down
Start with an industry-level TAM number from a research firm like Gartner, IDC, or Statista, then apply filters to narrow it down. Geographic filter first - if you only sell in North America, cut the global number accordingly. Then segment by company size, industry vertical, and product capability.
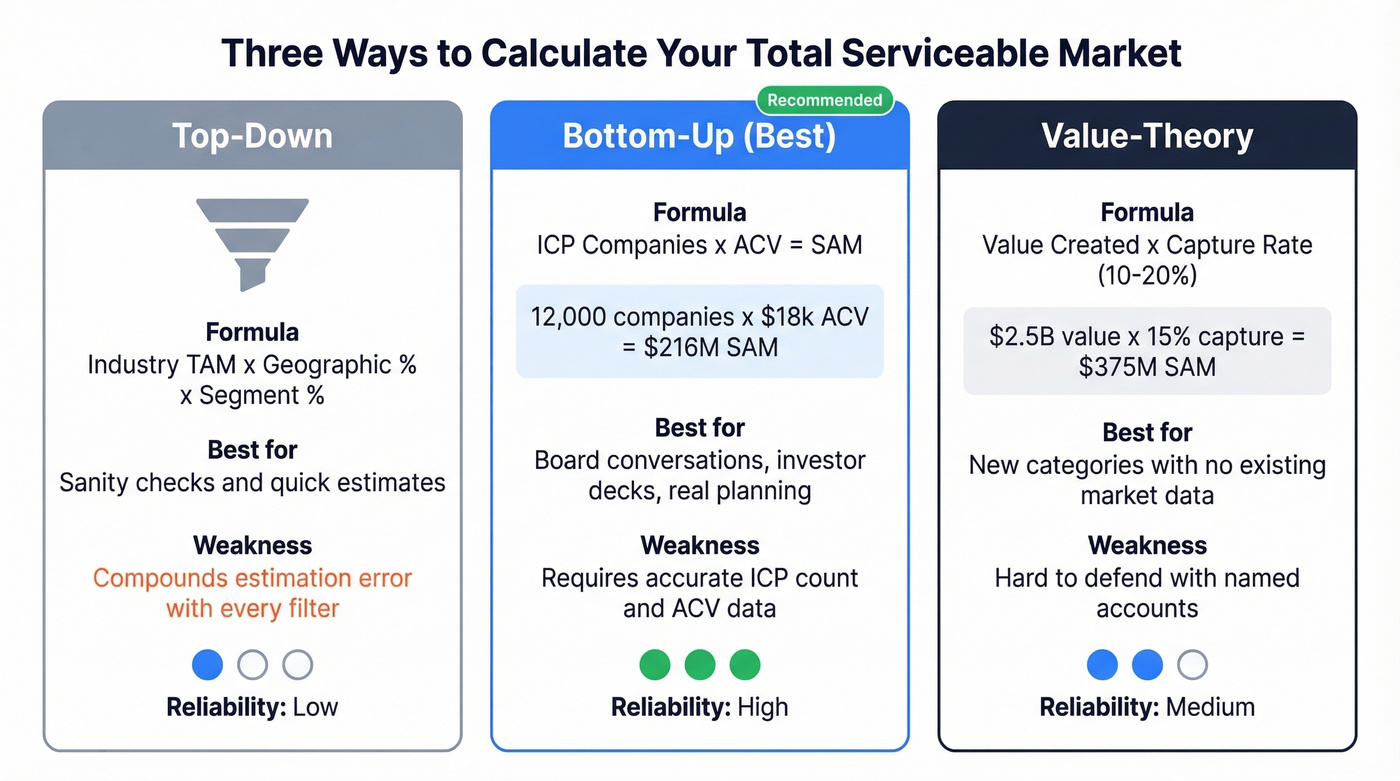
Here's the thing: this is the weakest method. Industry reports use broad definitions, assumptions skew reality, underlying data is hard to verify, and every filter you apply compounds estimation error. Markets also shift faster than reports get updated. Use top-down as a sanity check, not as your primary number. If your bottom-up estimate lands in a completely different universe than your top-down, one of your assumptions is broken.
Bottom-Up (Most Reliable)
This is the one that matters. Count the number of companies matching your ICP, then multiply by your average contract value.
The reframing that makes it real: instead of saying "$10B market," say "50,000 potential companies, 8,000 realistically reachable in three years, at $15k ACV - that's a $120M SAM." Suddenly you're talking about accounts you can name, not abstractions you can't touch.
The formula: ICP-matching companies x ACV = SAM. For a SaaS company selling project management software to mid-market tech companies in the US, that might look like 12,000 companies x $18,000/year = $216M SAM. We've found this method holds up best in board conversations because every input is auditable - someone can challenge your company count or your ACV, and you can defend both with data.
Value-Theory
Less common but powerful for new product categories where there's no existing market to size. Estimate the total value your product creates for customers, then apply a capture rate. Software typically captures 10-20% of the value it creates.
If your tool saves each customer $500k/year and there are 5,000 potential customers, the total value created is $2.5B. At a 15% capture rate, your SAM is roughly $375M. Best for genuinely novel products. Worst for pitching investors who want to see named accounts.
Beyond SOM: ISOM and WISOM
Most market-sizing guides stop at SOM. That's a mistake.
The consensus on r/FPandA introduced two layers that should be standard in every market-sizing model:
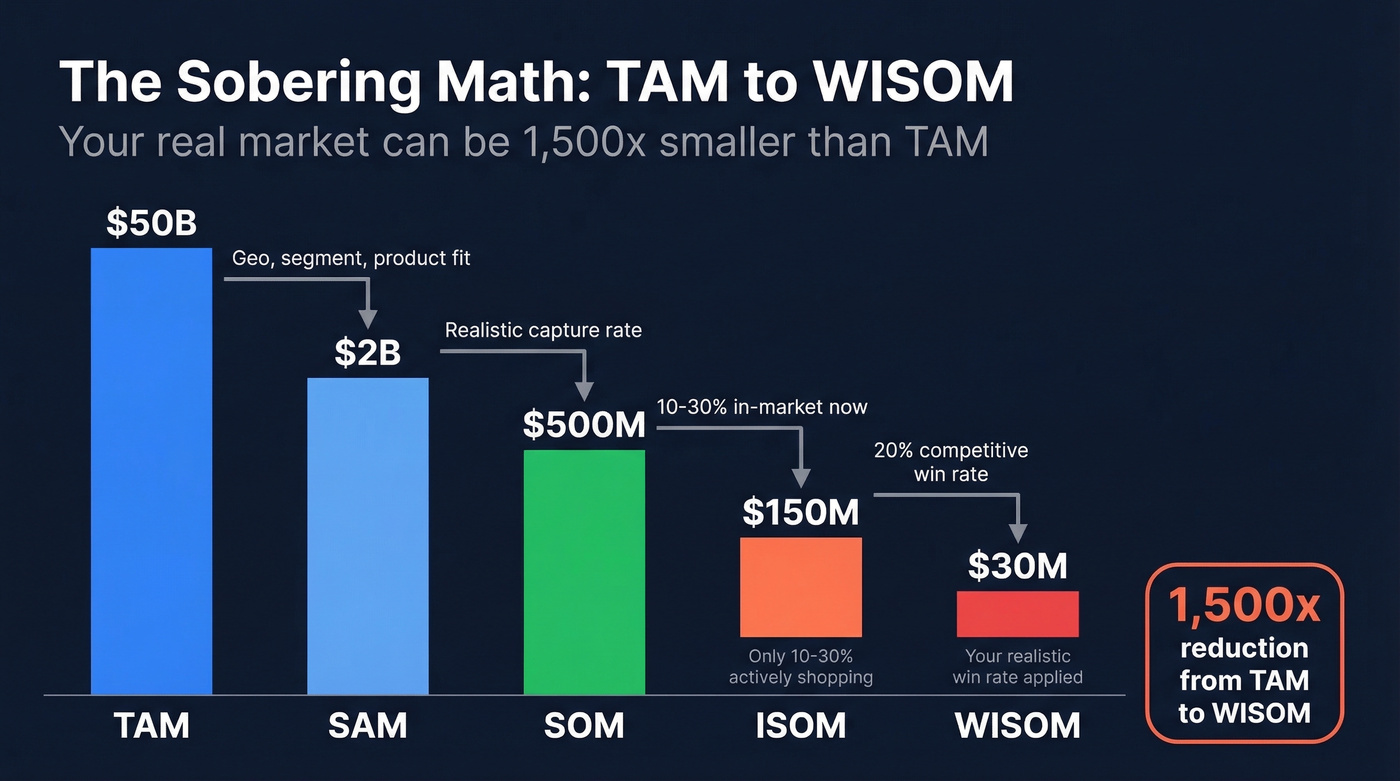
- ISOM (In-market SOM): Only 10-30% of your SOM is actively shopping in any given year. The rest are locked into contracts, not prioritizing the problem, or simply not buying right now.
- WISOM (Winnable ISOM): Apply your realistic win rate against competitors. If you win 20% of deals you compete in, that's your WISOM.
The math gets sobering fast. TAM $50B → SAM $2B → SOM $500M → ISOM $150M → WISOM $30M. That's 1,500x smaller than TAM. In one FP&A leader's account, planning against "1% of TAM" led to missing targets by 40-60% because the plan had no relationship to how many buyers were actually in-market and winnable.
If your financial model starts with "1% of a $50B market," you're building a fantasy, not a forecast.
Your SAM is only useful if you can name the accounts in it. Prospeo's B2B database lets you filter 300M+ profiles by industry, headcount growth, funding stage, tech stack, and 15,000 Bombora intent topics - so you go from a $180M SAM number to a ranked list of in-market buyers.
Stop sizing your market on a spreadsheet. Start building it as a prospect list.
B2B SaaS Example - SAM to Prospect List
You've done the math. You know your SAM is $180M across 10,000 ICP-matching companies. Now what?
For early-stage SaaS, expect to penetrate 1-5% of SAM in the first year. Growth-stage companies with established GTM motions hit 5-15%. Here's the full funnel for a concrete example:
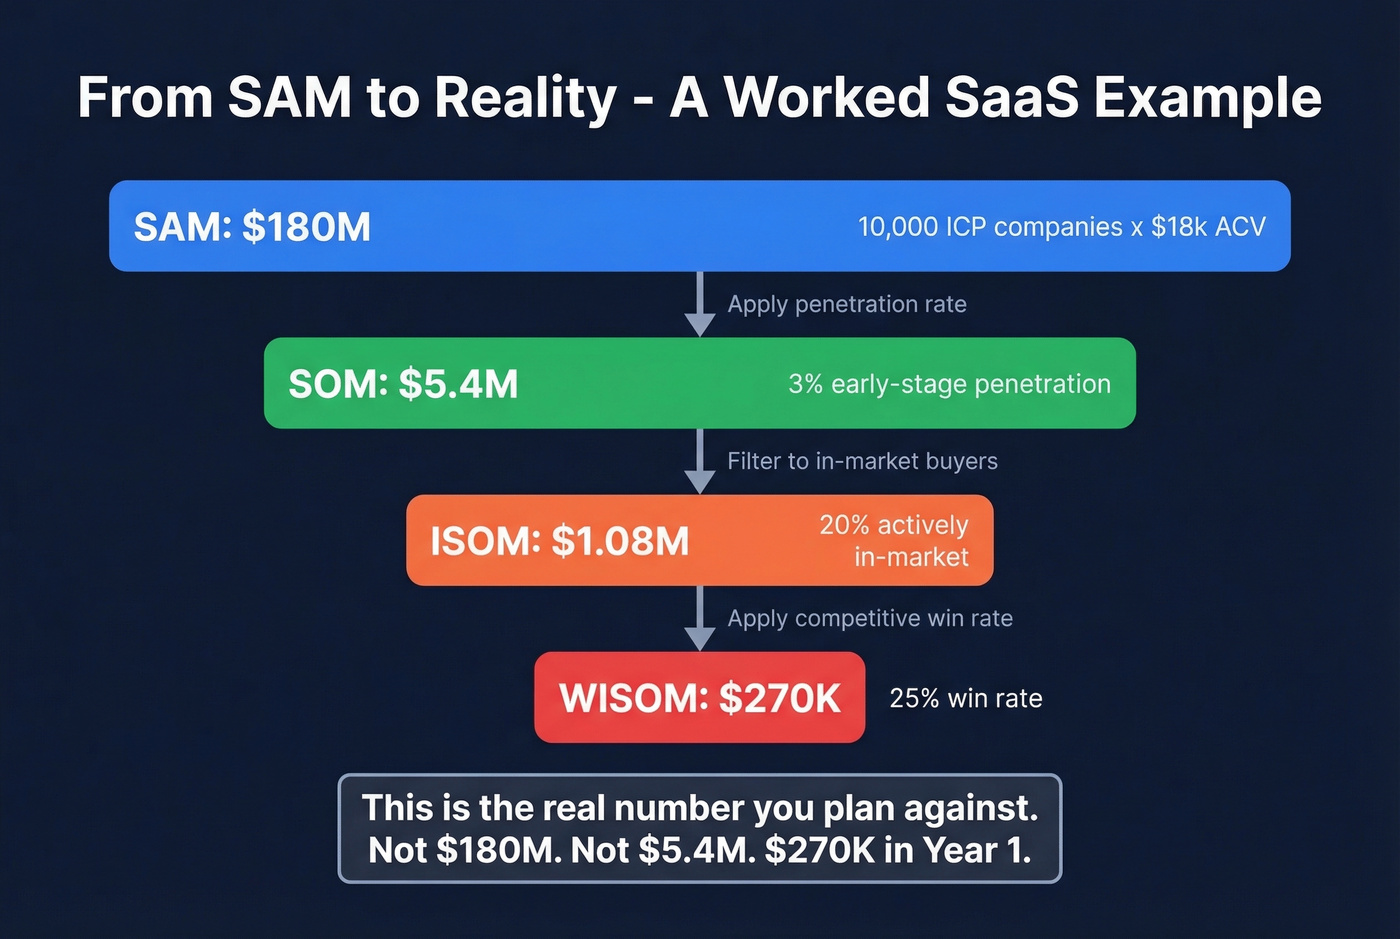
- 10,000 ICP companies x $18k ACV = $180M SAM
- At 3% early-stage penetration = $5.4M SOM
- At 20% in-market = $1.08M ISOM
- At a 25% win rate = $270K WISOM in Year 1
That's the real number you're planning against. Not $180M. Not even $5.4M. $270K.
The operational workflow: define ICP criteria - industry, company size, headcount growth, funding stage, tech stack - then count matching accounts, multiply by ACV, and layer intent data to estimate ISOM. Prospeo's B2B database lets you filter 300M+ profiles by these exact criteria, including buyer intent across 15,000 Bombora topics. That intent layer connects directly to ISOM: instead of blasting your entire SAM, you identify the 10-30% actively in-market.

ISOM is the layer that separates real pipeline from wishful thinking. Prospeo's intent data tracks 15,000 topics to surface the 10-30% of your SOM actively in-market right now - with 98% verified emails attached. At $0.01 per email, sizing and reaching your winnable market costs less than one analyst report.
Find who's actually buying, not just who theoretically could.
Validating Your Numbers
Never present a single number. Present a range.
The best validation heuristic we've found: run both top-down and bottom-up calculations independently. If they align within roughly 15%, your assumptions are solid. If they're off by 3x or more, dig into which filters or multipliers are driving the gap.
Build three scenarios - best case, mid case, worst case - by varying your key assumptions: price point, conversion rate, addressable geography, and competitive intensity. Sensitivity analysis on these inputs shows which assumptions your model is most fragile to. If changing your ACV estimate by 20% swings your SAM dramatically, that's the assumption you need to validate hardest.
Document everything. Assumptions decay, markets shift, and the model needs revisiting at least annually.
What Investors Actually Want
Let's be honest about the gap. You're building your Series A deck and the market-size slide says "$8B TAM." The partner says, "Great. Now show me how you get to $5M ARR."
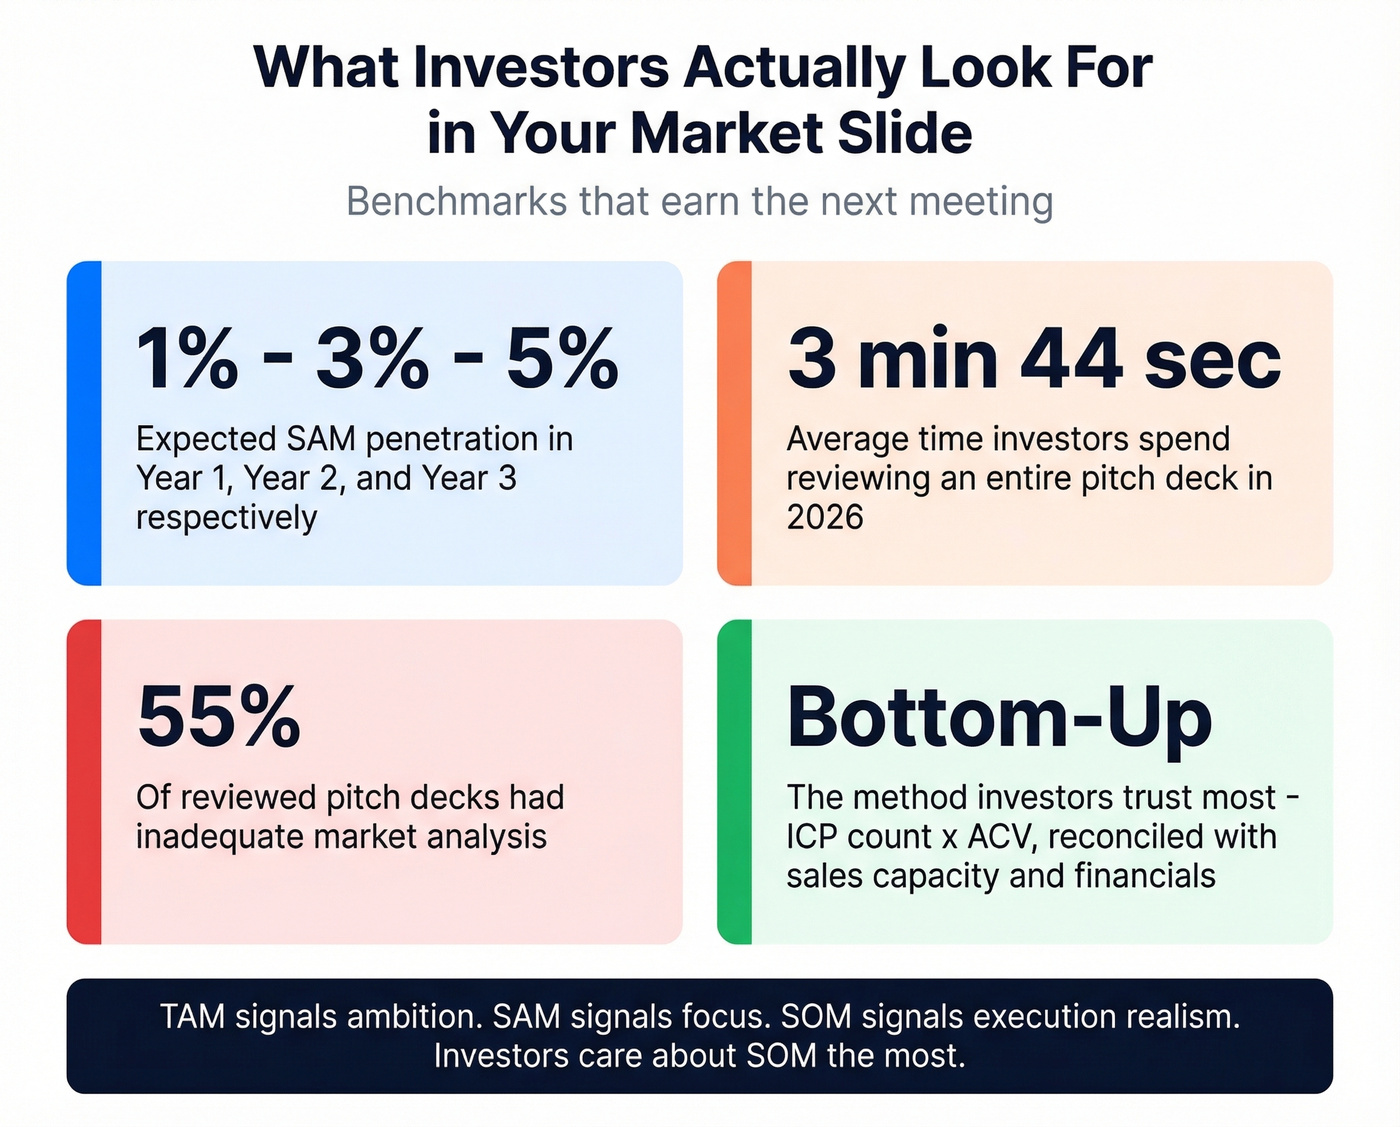
Investors use TAM, SAM, and SOM as a filtering framework: TAM signals ambition, SAM signals strategic focus, SOM signals execution realism. They care about SOM the most because it's the number you're actually accountable to. A clear progression from total addressable market to serviceable market to SOM shows you understand your competitive landscape, not just your opportunity.
The benchmarks investors expect: 1% of SAM in Year 1, 3% in Year 2, 5% in Year 3. If your SOM projection implies 15% penetration in Year 1 with a 5-person sales team, you've lost the room. In 2026 analyses, investors spend an average of 3 minutes and 44 seconds on an entire pitch deck, and 55% of reviewed decks had inadequate market analysis. Bottom-up math with a credible penetration path - built from sales capacity, reps x quota x deal size, and reconciled with financials - is what earns the next meeting.
If your deal sizes are sub-$10k, you probably don't need a $50B TAM slide at all. Investors at that price point care about velocity and unit economics, not market ceiling. Show them your SAM, your conversion funnel, and your payback period. That's the whole story.
Market-Sizing Mistakes That Kill Credibility
TAM inflation. Including enterprise buyers you can't access, assuming global reach while selling in two countries, ignoring competition entirely. We've seen decks claim a $30B TAM for a product that only works in English-speaking markets with Salesforce installed - that's not a $30B opportunity, it's a $2B one at best.
"1% of TAM" thinking. It sounds conservative. It's actually lazy. WISOM can be 1,500x smaller than TAM.
Static sizing. Treating your SAM as a fixed number instead of a living model guarantees it'll be wrong within a year. Skip this mistake by scheduling quarterly reviews tied to pipeline data.
No bottom-up validation. If you can't name accounts, you can't defend the number.
Outdated data sources. A 2021 industry report doesn't reflect a 2026 market. Refresh your inputs or your model is fiction.
Free Data Sources for Market Sizing
Not every sizing exercise requires an expensive analyst subscription. Free sources cover more ground than most teams realize.
| Source | What It Covers | Cost |
|---|---|---|
| U.S. Census Bureau | Business counts by NAICS, size, geo | Free |
| Bureau of Labor Statistics | Employment, wages, industry trends | Free |
| Eurostat | EU business demographics | Free |
| World Bank | Global economic indicators | Free |
| SEC EDGAR | Public company filings, revenue | Free |
| Statista | Industry reports, forecasts | Free tier + paid |
| IBISWorld | Industry reports, sizing | Paid (varies) |
| Gartner / Forrester / IDC | Tech market forecasts | Paid (enterprise) |
Paid reports are best reserved for validating assumptions rather than building them from scratch.
To turn sizing into execution, connect your model to lead scoring and a repeatable lead generation workflow, then pressure-test it against sales pipeline benchmarks and sales conversion rate assumptions.
FAQ
Is total serviceable market the same as SAM?
Yes. "Total serviceable market" is a common long-form name for SAM. The acronym is stable across publishers; only the middle word varies. Whether you see "addressable" or "available," it's the same concept - the portion of TAM you can realistically reach and sell to.
What's a realistic SAM-to-TAM ratio?
There's no universal benchmark, but if your SAM exceeds 50% of TAM, you've likely defined TAM too narrowly or SAM too generously. Most B2B SaaS companies land between 5-30% depending on geographic scope and segment specificity. The tighter your ICP filters, the smaller - and more useful - the ratio becomes.
How often should I re-size my market?
At minimum annually, or whenever you launch a new product, enter a new geography, or see a major competitive shift. Market sizing is a living model, not a one-time slide.
What's the best approach for calculating SAM?
The bottom-up method is the most defensible. Count ICP-matching companies using a B2B database, multiply by your average contract value, and validate against a top-down estimate. If both numbers converge within 15%, your assumptions are likely sound. Ground every input in observable data - named accounts, verified pricing, and realistic geographic scope - rather than relying on analyst projections alone.