Sales Trend Analysis: What It Is, How to Do It, and Why Most Teams Get It Wrong
Four in five sales and finance leaders missed a quarterly forecast in the past year, per a 2024 Xactly survey of 400 professionals. Forecasts routinely miss by 10% or more - and a ±10-20% quarterly swing is common. The root cause? Two-thirds of respondents cited an inability to access historical CRM data. That's the gap sales trend analysis fills. It's how you stop being surprised.
What Sales Trend Analysis Actually Is
Sales trend analysis is a statistical approach to identifying patterns and directional changes in your sales data over time. It's not reporting, and it's not forecasting. Reporting tells you what happened. Trend analysis tells you what's changing. Forecasting takes those changes and predicts what comes next.
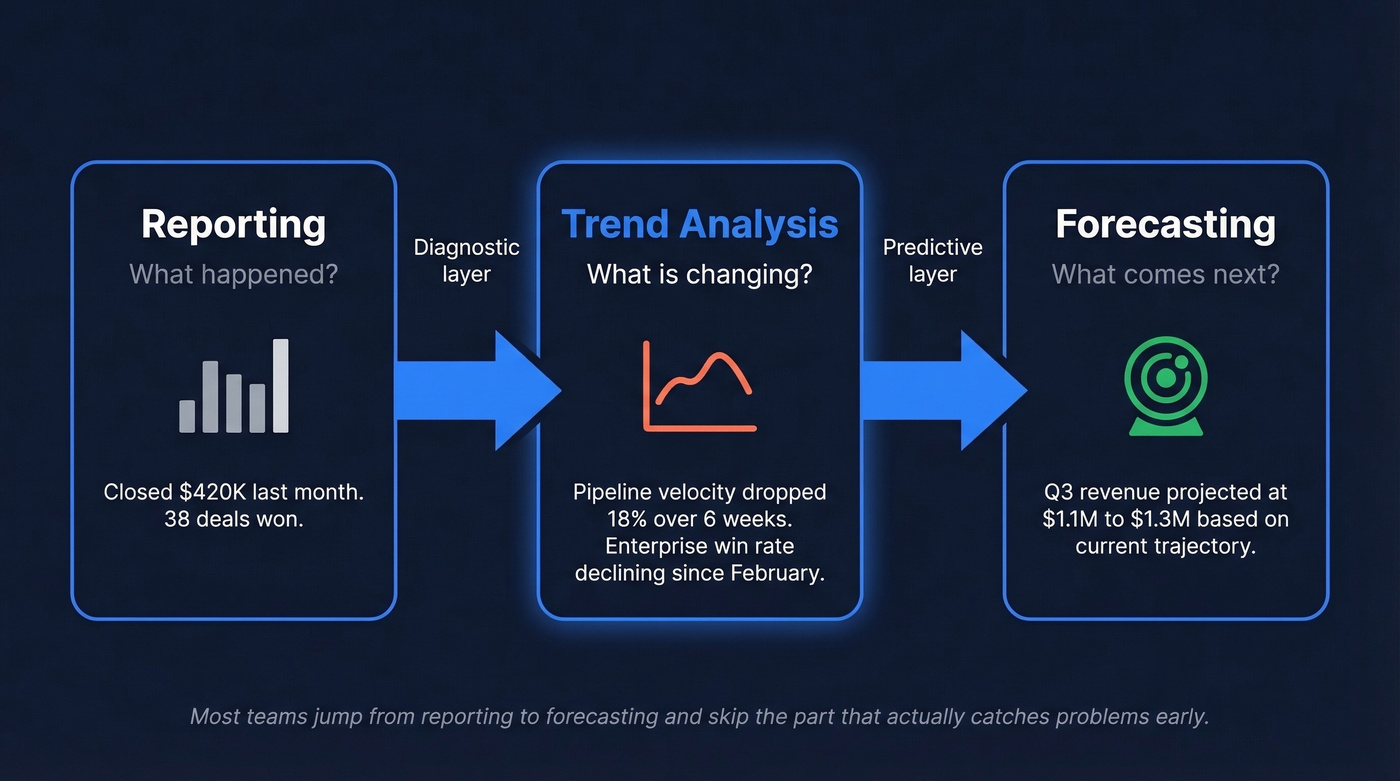
Think of it as the diagnostic layer - the thing that tells you pipeline velocity is decaying three weeks before the forecast model catches it. The trend surfaces the signal; the forecast translates it into a number your CFO can plan around.
What You Need This Week
You don't need a revenue intelligence platform to start. You need three things:
- A weekly KPI trend dashboard - even a Google Sheet works
- A segmentation baseline - separate SMB from mid-market from enterprise so averages don't hide collapses
- A rolling 3-month moving average plus YoY comparisons - this smooths noise and reveals real direction
Here's the contrarian take: a segmented moving average catches most revenue problems earlier than any fancy predictive tool. We've seen teams spend six figures on forecasting software and still miss the quarter because they never segmented their pipeline. Start simple.
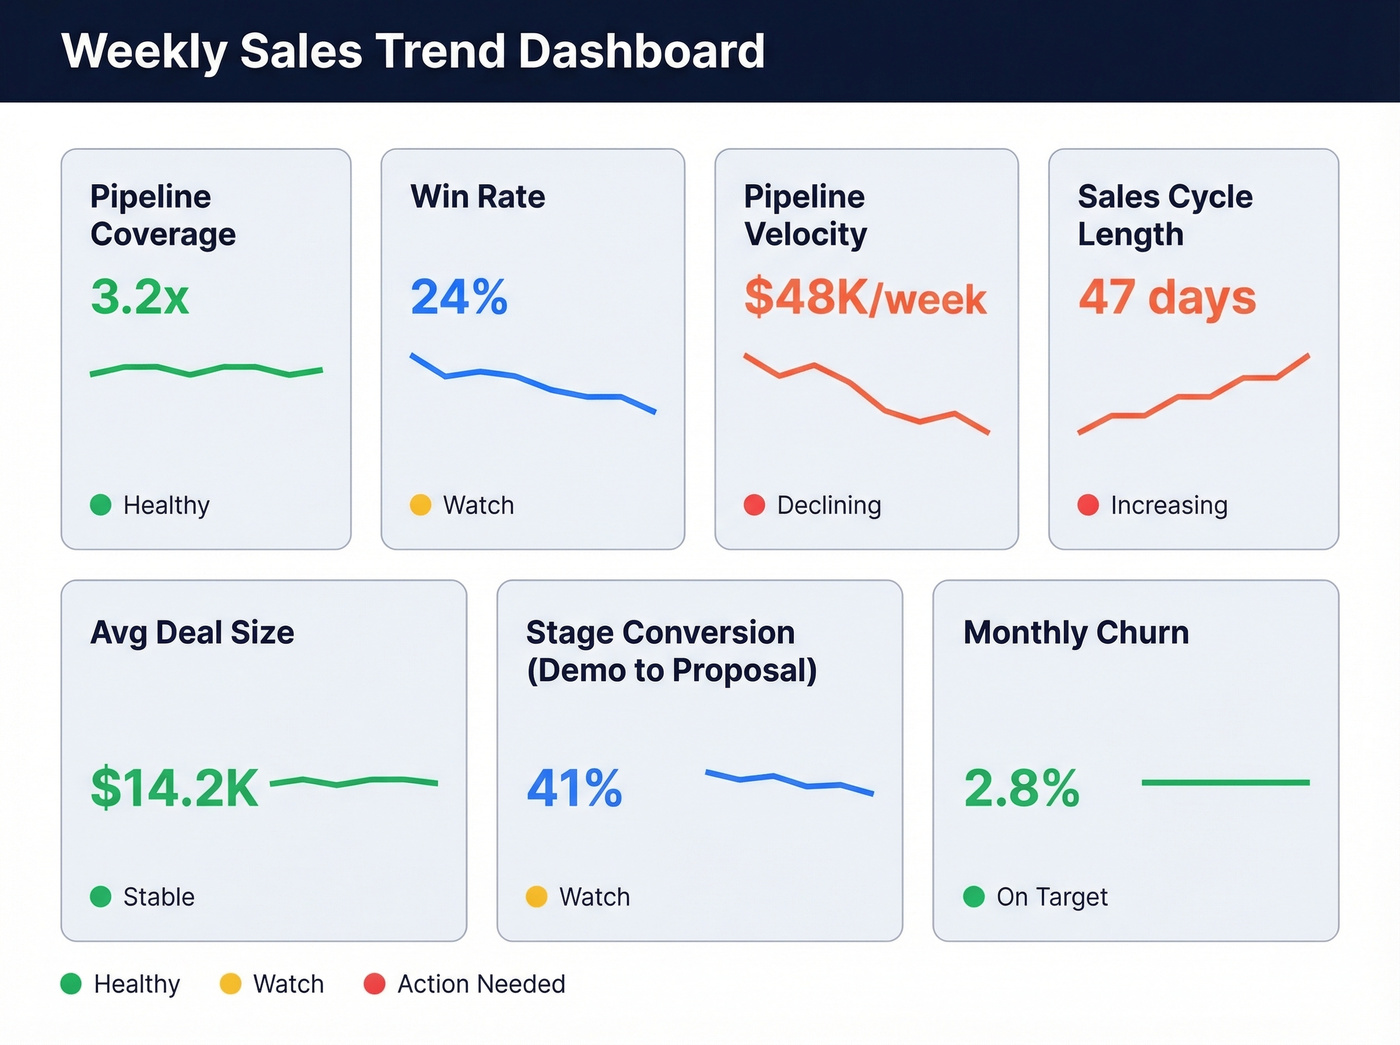
KPIs to Trend Every Week
Focus on 5-7 metrics that actually predict revenue outcomes, organized across revenue, funnel, activity, pipeline, retention, and efficiency categories. Make sure sales and marketing agree on shared attribution definitions first - disagreements here corrupt every downstream trend.
| KPI | What It Tells You | Benchmark |
|---|---|---|
| Pipeline coverage | Enough fuel? | Most teams need at least 3x |
| Win rate | Closing efficiency | 20-30% B2B typical |
| Pipeline velocity | Speed of revenue | Flag big week-to-week shifts |
| Sales cycle length | Deal complexity trend | Varies widely by segment |
| Average deal size | Expansion or contraction | Flag ±15% QoQ shift |
| Stage conversion | Where deals stall | Flag sudden drops at any stage |
| Retention / churn | Post-sale health | Flag churn increases |
With buying groups now averaging 6-10 stakeholders per deal, stage conversion and cycle length deserve extra attention. When those trend upward together, your deals are getting harder to close - and you need to know that before it hits the number.
Step-by-Step Guide in Excel
You don't need Tableau for this. Excel handles the basics in ten minutes.
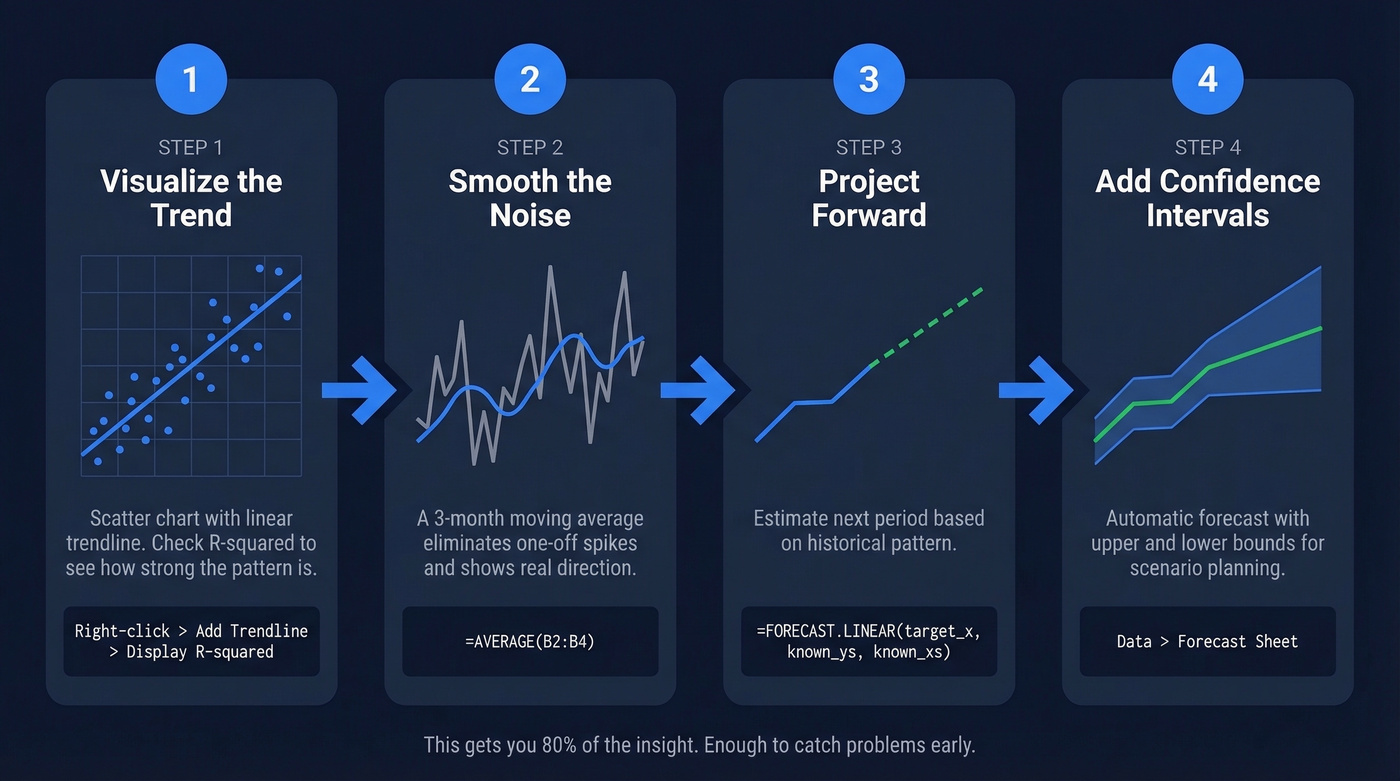
1. Visualize the trend. Insert a scatter chart with your monthly data. Right-click the data series, add a trendline (linear), and check "Display R-squared" to see how strong the pattern is.
2. Smooth the noise. Create a 3-month moving average column: =AVERAGE(B2:B4). Drag it down. This eliminates one-off spikes and shows real direction.
3. Project forward. Use =FORECAST.LINEAR(target_x, known_y's, known_x's) to estimate next period's value based on the historical pattern.
4. Add confidence intervals. Data → Forecast Sheet gives you an automatic forecast with upper and lower bounds for scenario planning.
In our experience, teams outgrow Excel within a quarter once they start trending weekly. That's fine. Excel gets you 80% of the insight, and that's enough to catch problems early. Some teams borrow technical indicators like Bollinger Bands from finance for detecting revenue volatility, but a simple moving average with segmentation catches most problems faster.
Stale CRM data doesn't just hurt outbound - it corrupts every trend you track. Prospeo enriches your CRM with 50+ data points per contact at a 92% match rate, refreshed every 7 days. That means your pipeline velocity, win rates, and stage conversions reflect reality, not data decay.
Fix your inputs before you trend them. Start with clean data.
Seasonality Breaks Forecasts
If you aren't adjusting for seasonality, your "growth" might just be a calendar effect. Shopify brands generated $11.5B during BFCM 2024, up 24% YoY. That's not a trend - it's a season. Confusing the two is how teams over-hire in Q1 based on a Q4 sugar high.
Choose comparison windows carefully. Week-over-week works for short sales cycles. Month-over-month suits mid-market B2B. Year-over-year is essential for any business with seasonal patterns. Mix the wrong window with the wrong cycle, and you'll chase ghosts in the data.
Mistakes That Make Your Analysis Lie
Most teams try to explain a missed quarter with end-of-quarter reporting - which is exactly why the same surprises repeat.
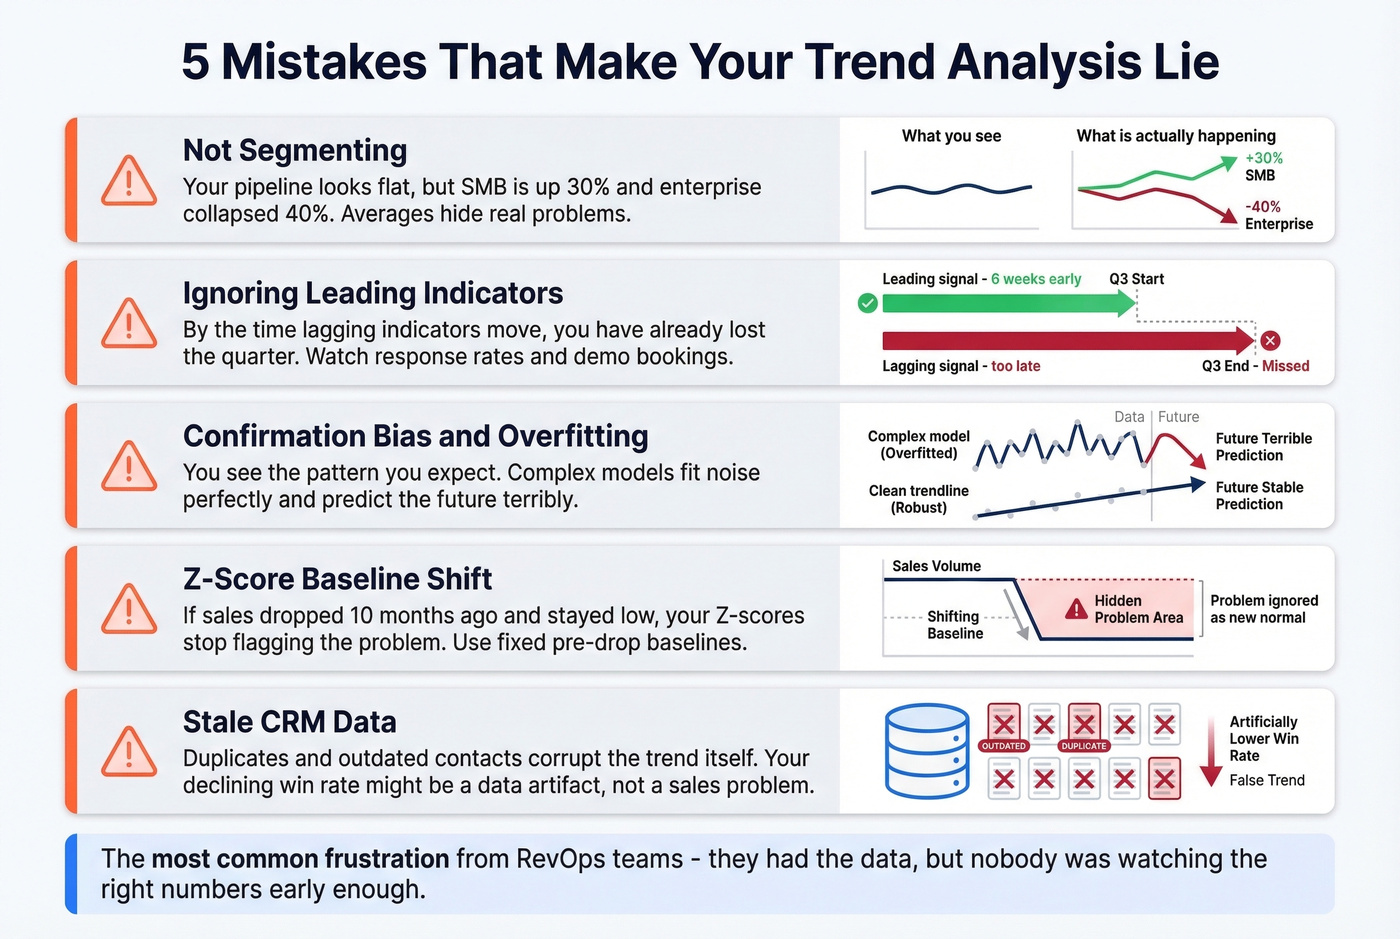
Not segmenting. Your pipeline looks flat, but SMB is up 30% and enterprise collapsed 40%. Averages hide this. Always segment by deal size, region, or customer category before drawing conclusions.
Ignoring leading indicators. Response rates, demo bookings, and follow-up time are upstream signals. By the time lagging indicators move, you've already lost the quarter. This is the single most common frustration we hear from RevOps teams - they had the data, but nobody was watching the right numbers early enough.
Confirmation bias and overfitting. You see the pattern you expect. Complex models fit historical noise perfectly and predict the future terribly. Keep it simple, and challenge your own interpretation.
Z-score baseline shift. If sales dropped 10 months ago and stayed low, your Z-scores stop flagging the problem because the lower level becomes the "new normal." The consensus on r/analytics echoes this - use fixed pre-drop baselines or segmented comparison periods instead.
Stale CRM data. Duplicate records, outdated contacts, and missing fields don't just hurt outbound. They corrupt the trend itself. Your "declining win rate" might actually be a data artifact from bad enrichment. This is where most teams underinvest, and it's the easiest problem to fix.
Benefits of Sales Trend Analysis
When done right, the benefits compound across every revenue function.
Earlier problem detection. A weekly trending cadence catches pipeline decay 6-8 weeks before it craters the quarter, giving leadership time to intervene rather than react. That's the difference between a course correction and a fire drill.
Smarter resource allocation. Knowing which segments are accelerating and which are stalling lets you shift headcount, ad spend, and enablement effort before the budget cycle forces your hand.
More credible forecasts. Trend-informed forecasts carry tighter confidence intervals, which builds trust with the board and reduces the sandbagging that plagues bottom-up roll-ups. Let's be honest - nobody trusts a forecast built on vibes and rep gut-feel. Trends give you the receipts.
Alignment across teams. When sales, marketing, and finance look at the same trending dashboard, attribution arguments shrink and planning conversations get productive.
Keep Your Inputs Clean
Trend analysis breaks when your underlying contact and account data is stale, duplicated, or missing key fields. The "trend" you're analyzing becomes a data artifact - not a market signal.
Prospeo, for example, maintains 98% email accuracy on a 7-day refresh cycle versus the six-week industry average. Connect it to Salesforce or HubSpot, and it enriches records with 50+ data points at a 92% match rate - clean inputs in, reliable trends out.

Tools by Maturity Stage
| Stage | Tool Category | Example | Starting Price |
|---|---|---|---|
| Early | Spreadsheets | Excel / Google Sheets | Free |
| Mid | CRM reports | Salesforce, Pipedrive | ~$14-25+/user/mo |
| Data quality | Enrichment + verification | Prospeo | Free tier; ~$0.01/email |
| Growth | BI platforms | Tableau, Zoho Analytics | ~$15-24+/mo |
| Enterprise | Revenue intelligence | Clari, Gong | Typically $30-100k+/year |
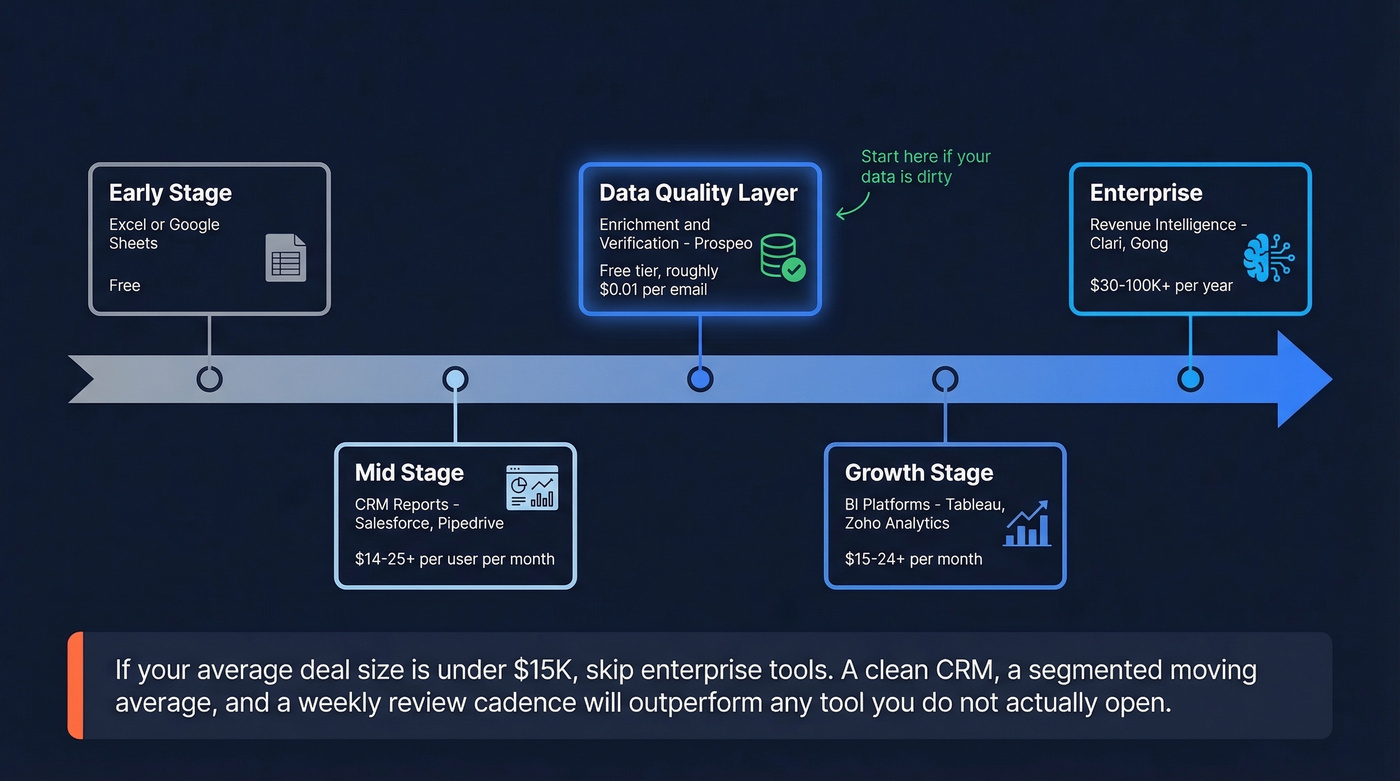
For teams whose average deal size is under $15k, skip Clari-level revenue intelligence. A clean CRM, a segmented moving average, and a weekly review cadence will outperform any tool you don't actually open.
The article above flags stale contacts and duplicates as the silent killer of trend analysis. Prospeo's 5-step verification and 7-day refresh cycle eliminate the data artifacts that make your declining win rate look like a sales problem when it's actually a data problem. At $0.01 per email, cleaning your pipeline costs less than one bad forecast.
Stop trending bad data. Get 98% accurate contacts for a penny each.
FAQ
What's the difference between trend analysis and forecasting?
Trend analysis identifies patterns in historical data - growth, decline, seasonality. Forecasting uses those patterns to predict specific future numbers. Trend analysis is the input; forecasting is the output. Getting the diagnostic layer right first makes every downstream forecast more reliable.
How often should you review sales trends?
Weekly for pipeline and activity KPIs, monthly for revenue and segmentation shifts, quarterly for strategic patterns like seasonality. A weekly cadence catches problems 6-8 weeks before they crater the quarter - enough lead time to actually intervene.