The B2B Conversion Funnel: 2026 Benchmarks, Math, and How to Fix Yours
Most B2B conversion funnel content gives you a diagram and no numbers. Here are the numbers - stage-by-stage benchmarks, the compounding math that turns small lifts into doubled revenue, and a diagnostic framework to find the leaks you're not seeing.
Your Funnel Starts Before "Awareness"
92% of buyers already have a vendor in mind before they enter your funnel. The winning vendor sits on the buyer's "Day One shortlist" 95% of the time, and buyers don't contact sellers until they're 61% of the way through a 10.1-month average buying cycle.
So your funnel doesn't start at "awareness." It starts at whether you showed up in the buyer's mental shortlist before they ever hit your website.
What You Actually Need to Know
- Your funnel has 6 measurable stages. If you can't name your conversion rate at each one, start there.
- The biggest bottleneck for most B2B orgs is MQL-to-SQL - 15-21% in sales-pipeline definitions, 39-42% in marketing-funnel definitions. The gap reflects different stage criteria, but either way, fix this first.
- Pipeline velocity is the single metric that tells you if your funnel is healthy. Track it weekly. (If you need a broader scorecard, use a pipeline health framework.)
- Data quality is Stage Zero. If your emails bounce at 5%+, deliverability breaks and downstream performance collapses. Use email bounce rate benchmarks to set your thresholds.
Why the Linear Model Fails
The traditional TOFU-MOFU-BOFU model assumes buyers move through your stages in order. They don't.
A Gartner survey of 646 B2B buyers found 67% prefer a rep-free buying experience, 45% used AI during a recent purchase, and 73% actively avoid suppliers who send irrelevant outreach. Buying committees of 5-13 stakeholders - each with different priorities and timelines - make the neat linear funnel collapse further.
The funnel still matters as a measurement framework. It just doesn't describe how buyers actually buy.
The 6 Stages Explained
- Visitor - anonymous traffic from any channel
- Lead - known contact who's exchanged information
- MQL - meets behavioral and firmographic thresholds set by marketing
- SQL - sales has accepted and validated the lead
- Opportunity - active deal with defined next steps
- Closed Won - signed contract, revenue recognized
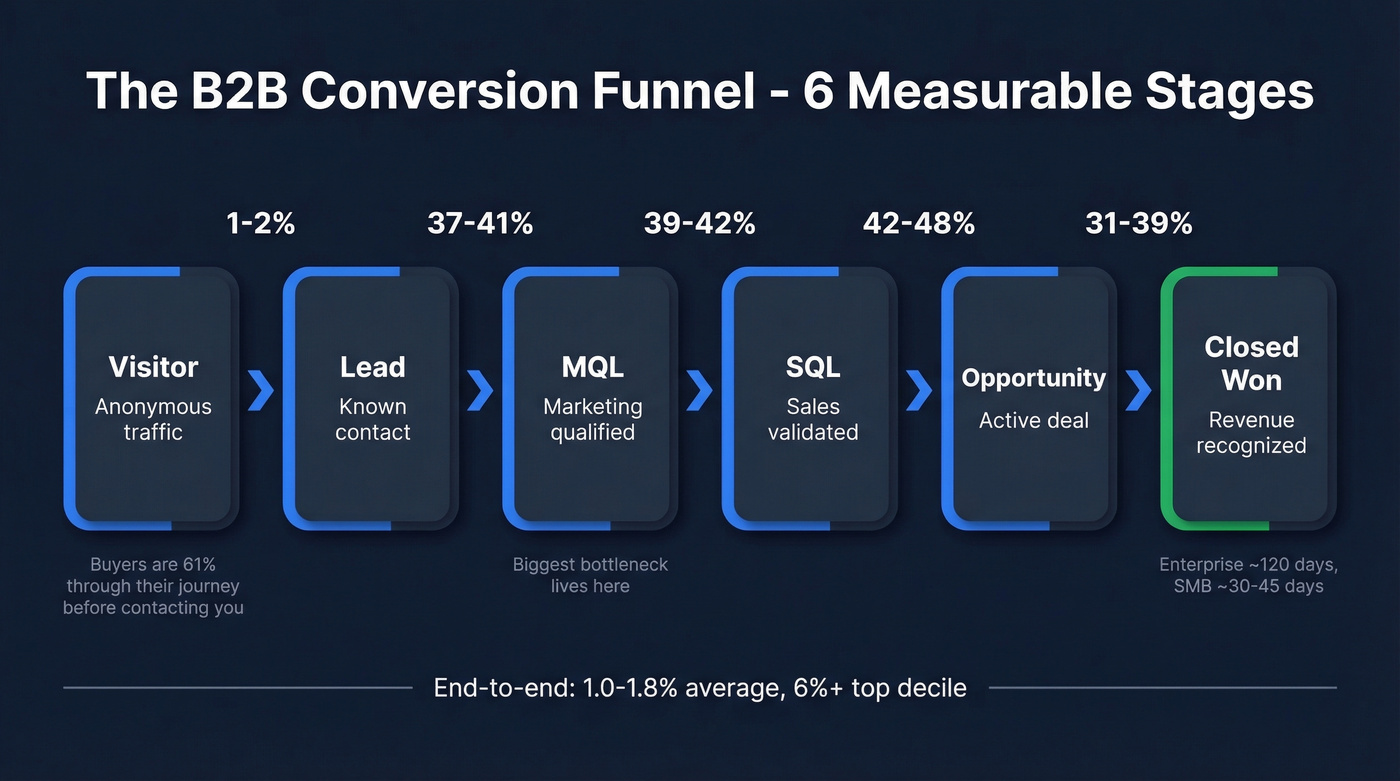
Some orgs add a seventh stage - Expansion - tracking upsell and NRR post-close. Others split this into separate marketing, sales, and customer success funnels when stage definitions differ between teams. Enterprise opportunity-to-close averages roughly 120 days; SMB cycles run 30-45 days.
Bad data is the silent funnel killer. If your emails bounce above 4%, every conversion rate downstream collapses - MQL-to-SQL, SQL-to-Opp, all of it. Prospeo's 5-step verification delivers 98% email accuracy at $0.01/email, refreshed every 7 days. That's how teams like Snyk cut bounce rates from 35% to under 5% and grew AE-sourced pipeline 180%.
Stop optimizing a funnel that's leaking at the data layer.
2026 Benchmarks by Stage
These numbers draw from compiled 2026 benchmark data and skew SaaS and mid-market. Your mileage will vary by vertical, deal size, and channel mix, but they're the best baseline we've found.
| Stage | Average | Top 10% | Bottom 25% |
|---|---|---|---|
| Visitor-to-Lead | 1.0-2.0% | 8-15% | <0.7% |
| Lead-to-MQL | 37-41% | 50%+ | <25% |
| MQL-to-SQL | 39-42% | 55% | <20% |
| SQL-to-Opp | 42-48% | 55% | <30% |
| Opp-to-Close | 31-39% | 44% | <20% |
| End-to-end | 1.0-1.8% | 6%+ | <0.3% |
Rates vary by company size - SMB converts visitors at 2.3% with a 46% close rate, while enterprise converts at 0.7% with a 31% close rate. They also vary by vertical: HR Tech sees 3-6% visitor-to-lead while Cybersecurity runs 1-2%. And by channel: SEO leads convert at 2.1% visitor-to-lead with 51% MQL-to-SQL - the highest quality channel - while PPC converts at 0.7% visitor-to-lead with only 26% MQL-to-SQL.
Seasonality swings are real too. January runs +12-18% above average; December drops 10-25%.
Small Lifts Compound Into Big Revenue
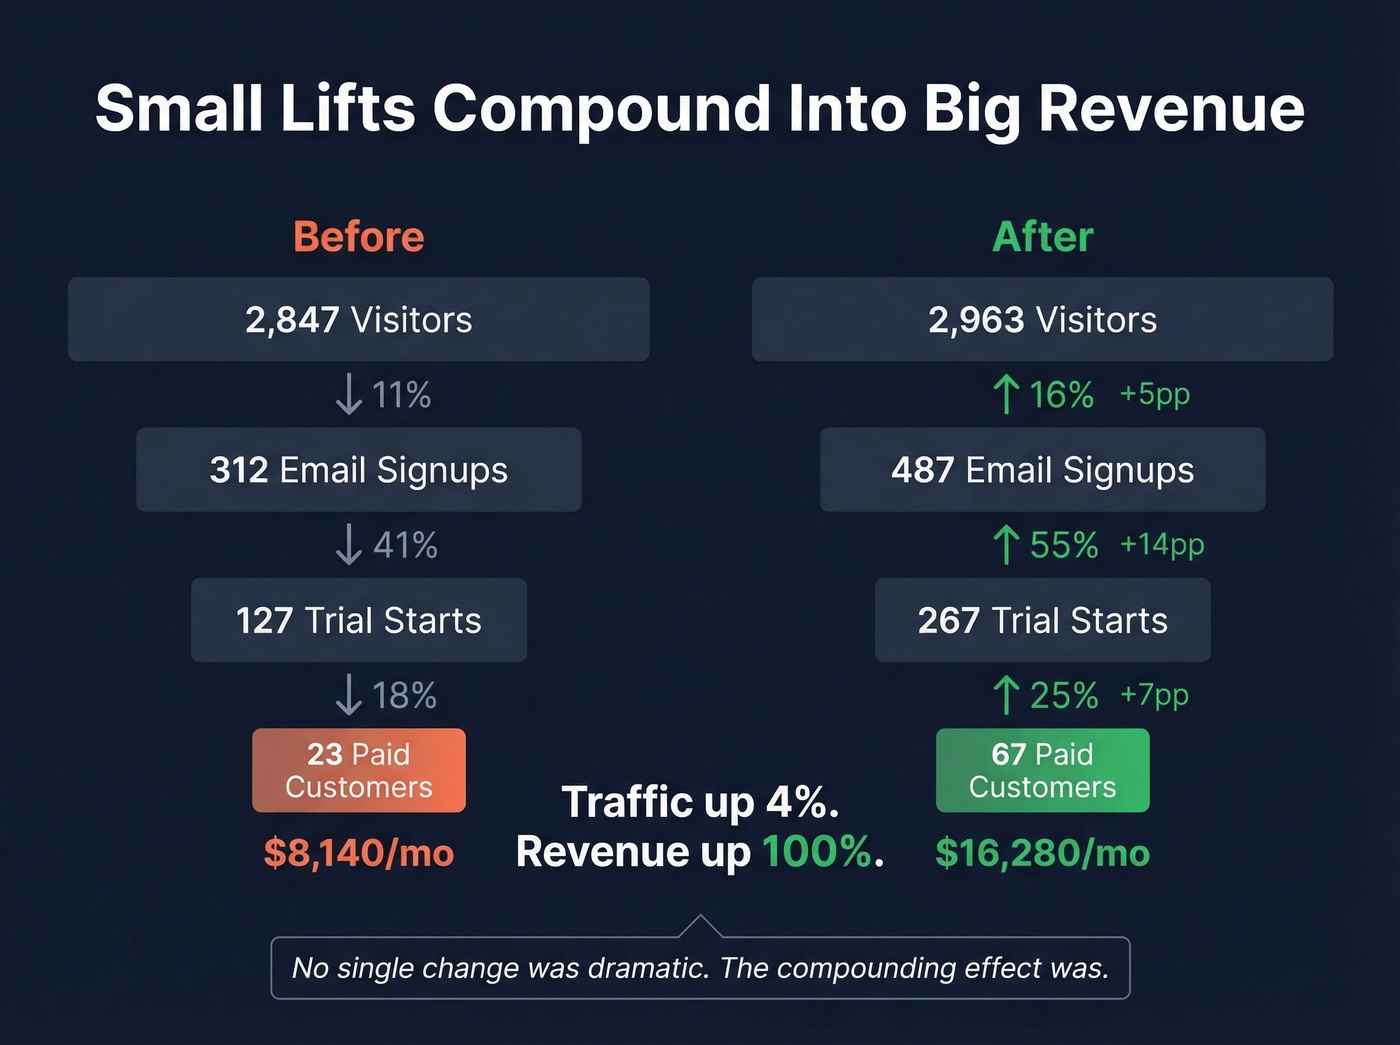
Here's the thing: most teams obsess over traffic when the real gains sit mid-funnel. A Reddit poster shared their before/after funnel numbers - modest improvements at each stage that doubled monthly revenue.
If you want a second set of reference points, compare against the average B2B lead conversion rate benchmarks.
| Metric | Before | After |
|---|---|---|
| Visitors | 2,847 | 2,963 |
| Email signups | 312 (11%) | 487 (16%) |
| Trial starts | 127 (41%) | 267 (55%) |
| Paid customers | 23 (18%) | 67 (25%) |
| Monthly revenue | $8,140 | $16,280 |
Traffic barely changed. The visitor-to-signup lift came from rewriting the value prop and adding testimonials. The signup-to-trial jump came from expanding the email sequence from 3 to 7 emails over 10 days. The trial-to-paid improvement came from guided onboarding and proactive outreach.
No single change was dramatic. The compounding effect was.
Pipeline Velocity: The Health Check
Pipeline velocity is the one number that tells you whether your funnel is producing revenue at the rate you need:
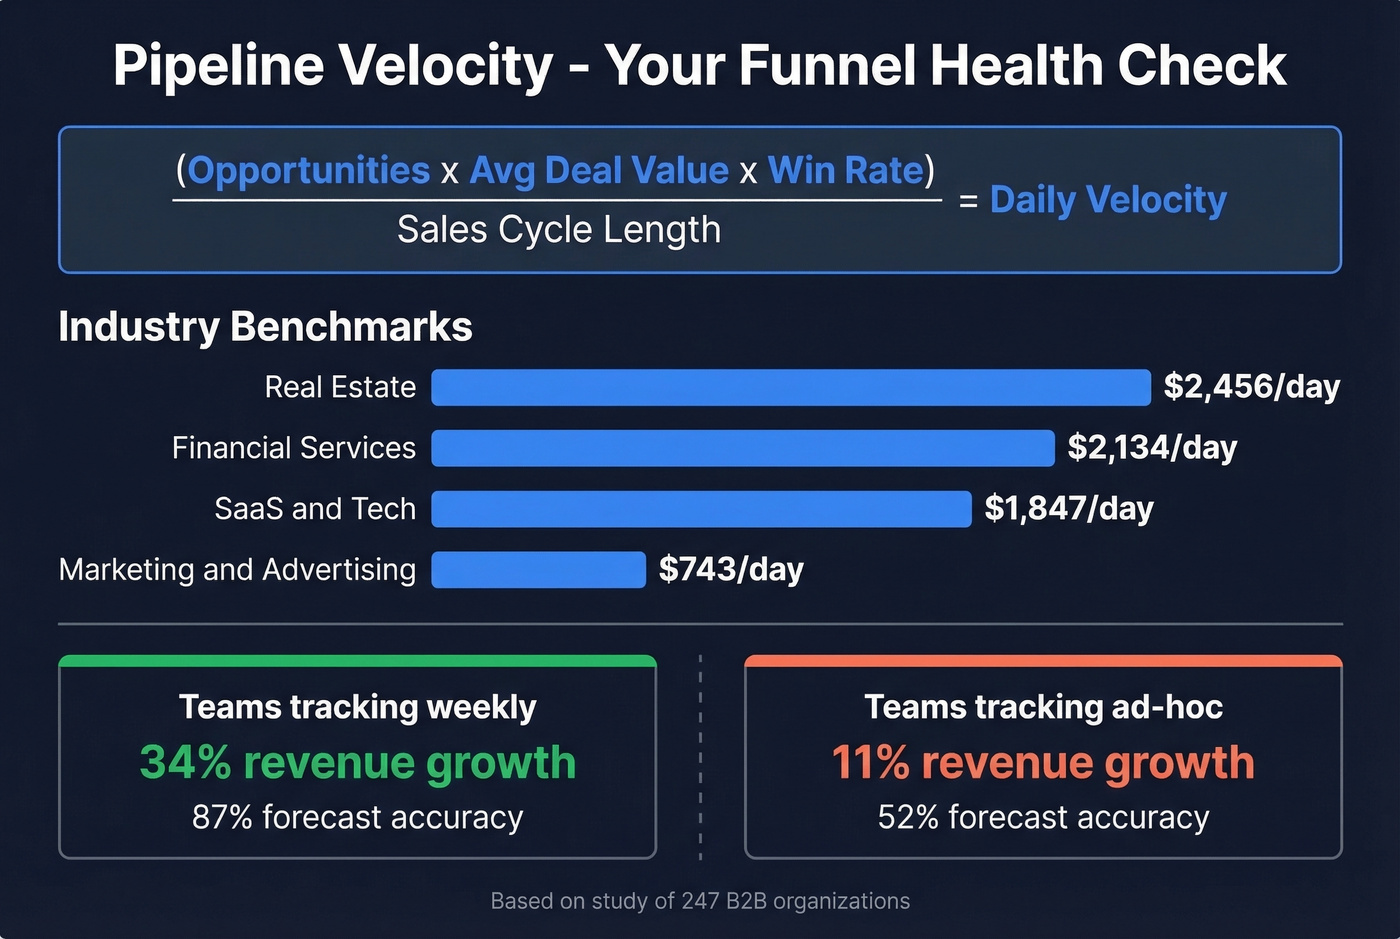
(Opportunities x Avg Deal Value x Win Rate) / Sales Cycle Length = Daily Pipeline Velocity
A study of 247 B2B organizations benchmarked velocity by industry:
| Industry | Daily Velocity |
|---|---|
| SaaS & Tech | $1,847/day |
| Financial Services | $2,134/day |
| Real Estate | $2,456/day |
| Marketing & Advertising | $743/day |
In our experience, tracking frequency matters as much as the metric itself. Teams that track velocity weekly see 34% revenue growth and 87% forecast accuracy. Teams tracking ad-hoc? 11% growth and 52% accuracy. Same metric, wildly different outcomes based on discipline alone.
If you want to operationalize this, pair velocity with sales operations metrics so you can see which lever is actually moving.
Diagnosing a Broken Funnel
When conversion rates drop, most teams start tweaking landing page copy. That's usually the wrong place to look.
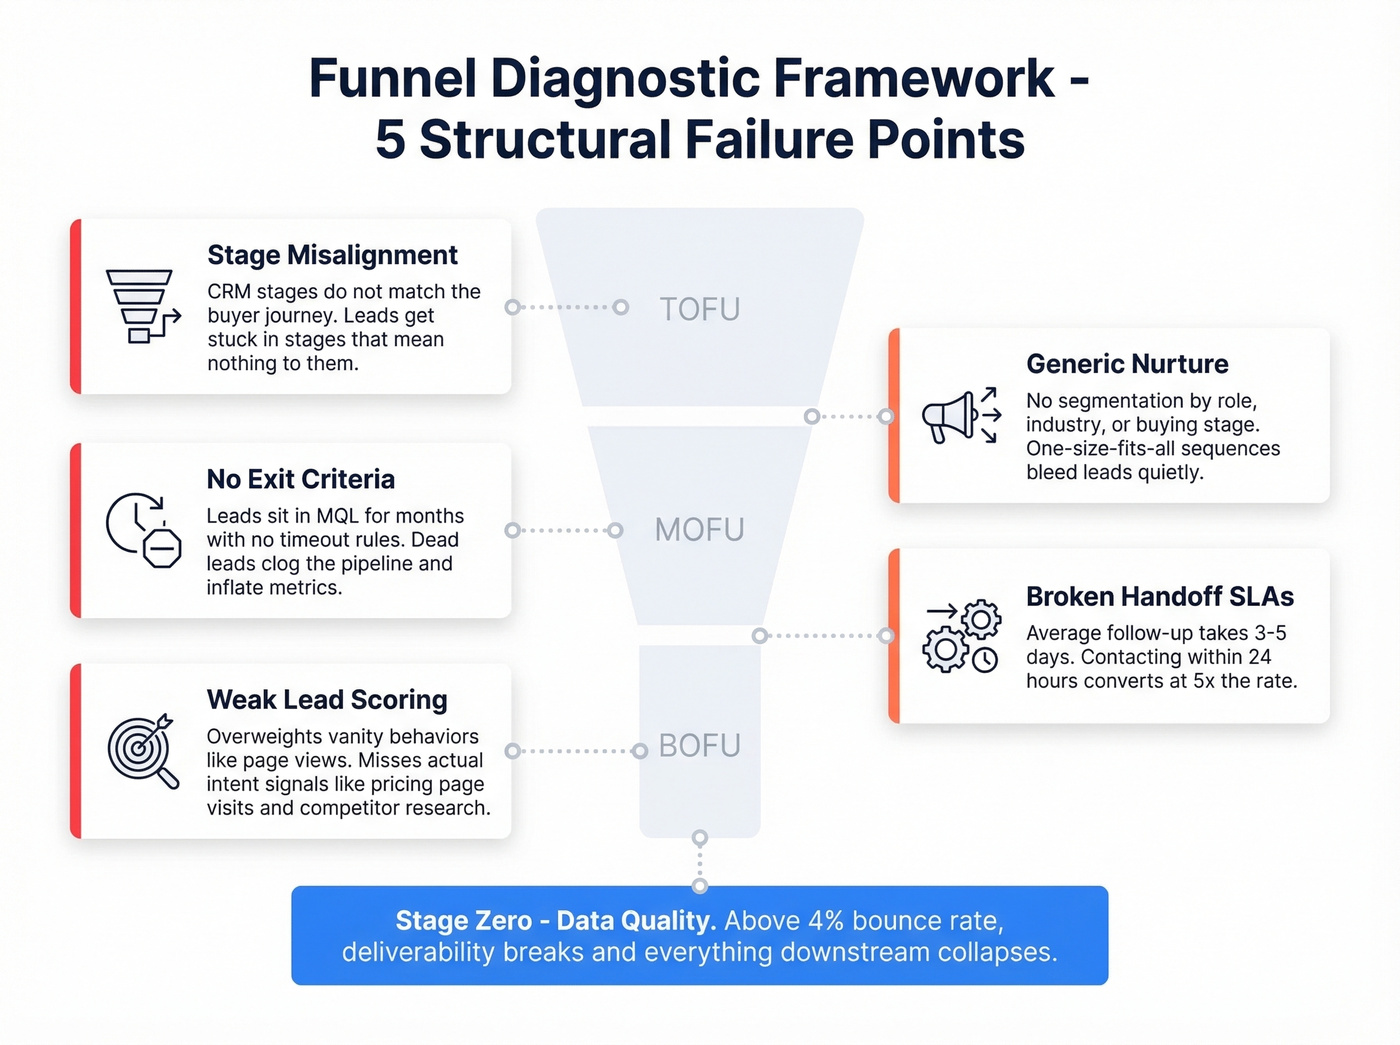
The real failure points are structural. Stage-to-stage misalignment means your CRM stages don't match the buyer's actual journey. Generic nurture sequences with no segmentation by role, industry, or buying stage bleed leads quietly. Leads sit in "MQL" for months with no exit criteria or timeout rules. And broken handoff SLAs - where most teams take 3-5 days to follow up - kill deals that contacting within 24 hours would convert at 5x the rate. Weak lead scoring that overweights vanity behaviors over actual intent signals rounds out the usual suspects.
We've seen teams miss even simpler problems. One r/b2bmarketing thread described a demo CTA invisible on mobile - fixing it lifted conversion from 2.3% to 5.8%. Another team found via scroll-depth analysis that 24% of visitors reached testimonials but only 14% reached pricing. The layout was killing deals before sales ever got involved.
And then there's data quality - the problem nobody debugs until it's too late. Above roughly 4% bounce, deliverability and sender reputation start to suffer, nurture sequences stop reaching inboxes, and mid-funnel starves. Bad contact data compounds just as powerfully as good conversion rates, except in the wrong direction. Prospeo maintains 98% email accuracy on a 7-day refresh cycle, which keeps sender reputation intact and nurture sequences landing where they should. (If you're troubleshooting the root cause, start with an email deliverability guide and then work on how to improve sender reputation.)
Let's be honest: if you're running outbound or nurture campaigns on stale data, you're not just losing leads - you're actively damaging your domain. Skip the funnel optimization playbook entirely until your bounce rate is under 4%.
If you're rebuilding the top of funnel, use a structured lead generation workflow so you can measure each handoff cleanly.
Pipeline velocity depends on reaching real buyers fast. Prospeo gives you 300M+ verified profiles with 30+ filters - buyer intent, job changes, headcount growth - so you fill mid-funnel with SQLs, not dead leads. Teams using Prospeo book 26% more meetings than ZoomInfo users and 35% more than Apollo.
Turn small conversion lifts into compounding revenue with data that actually connects.
FAQ
What's the difference between a conversion funnel and a sales funnel?
A conversion funnel tracks the full journey from anonymous visitor to closed deal across both marketing and sales. A sales funnel starts at the handoff point - typically SQL - and tracks only the pipeline stages that sales owns. The distinction matters because most leaks happen at the marketing-to-sales boundary, and if you're only measuring the sales funnel, you'll never see them.
What's a good end-to-end B2B conversion rate?
Visitor-to-close averages 1.0-1.8% across B2B SaaS, with top-decile performers hitting 6%+. SEO-sourced leads convert highest end-to-end; paid channels typically underperform by 40-50% on MQL-to-SQL quality.
How do you improve funnel conversion without more traffic?
Optimize stage-by-stage. A 5% improvement at each of four stages can double revenue, as the compounding example above shows. Start with your biggest bottleneck (usually MQL-to-SQL), fix data quality issues that starve mid-funnel, and keep bounce rates under 4% so nurture sequences actually reach inboxes. That's where the real gains hide.