BDR Metrics: What to Track in 2026 (+ Benchmarks)
A RevOps lead we work with pulled up her team's dashboard last quarter - 14 KPIs, all green. Then her top BDR quit, and pipeline cratered by 40% in three weeks. Every activity metric looked fine. The problem wasn't effort; it was that nobody was tracking the BDR metrics that actually predict revenue.
Across 262 BDRs surveyed by 6sense, the average rep hits just 88% of quota. That gap between "busy" and "productive" is where most programs bleed out.
The Three Metrics That Actually Matter
If you track nothing else, track these:
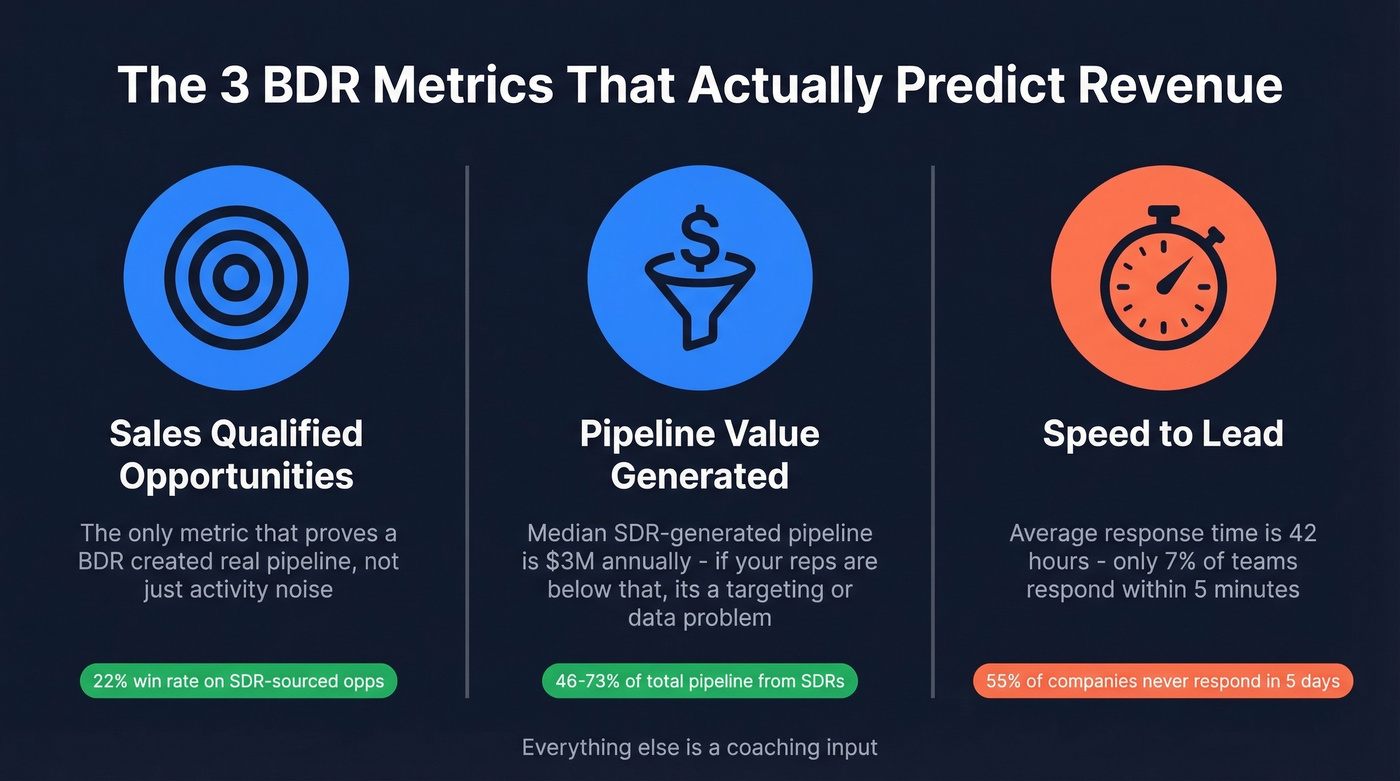
- Sales Qualified Opportunities (SQOs): The only metric that proves a BDR created real pipeline, not just activity noise.
- Pipeline Value Generated: Median SDR-generated pipeline is $3M annually. If your reps are below that, the problem isn't effort - it's targeting or data quality. Tracking pipeline per rep lets you isolate individual contribution from team-level averages that hide underperformance.
- Speed-to-Lead: Only 7% of teams respond within 5 minutes. Average response time? 42 hours. This is the single easiest metric to improve, and it compounds everything downstream.
Everything else is a coaching input. Here's the full framework.
Outcome Metrics (Compensate on These)
These are the only metrics that should touch a BDR's paycheck. SQOs and pipeline generated are the closest proxy to revenue contribution without waiting for a 6-month sales cycle to close.
Pipeline Coverage Ratio = Total Pipeline / Revenue Quota. You want 4x minimum. If your BDR team is generating $2M against a $500K target, you're at 4x - healthy. Below 3x, you're flying blind and hoping deals close at rates they historically don't.
SDR-sourced opportunities carry a 22% win rate, and SDRs generate 46-73% of total pipeline depending on your ACV. Those numbers make the case for investing in BDR programs. But only if you're measuring outcomes, not busywork.
Efficiency Metrics (Optimize These)
Efficiency metrics tell you where the machine is leaking. They're diagnostic, not compensatory.
Lead-to-Opportunity Conversion Rate = (Qualified Opps / Total Leads) x 100. Running at 5% is typical. Below 3%, something's broken - either targeting, messaging, or data quality. We've seen teams jump from 3% to 7% just by tightening their ICP definition and cleaning their contact database.
Contact-to-Meeting Rate = (Meetings Booked / Prospects Engaged) x 100. This is where you spot reps who have great conversations but can't close the ask.
Speed-to-lead deserves its own line. The average B2B response time is 42 hours, and 55% of companies never respond within 5 business days. Responding within 5 minutes dramatically increases conversion. Almost nobody does it.
The benchmark for show rate is 80%. Below that, your reps are booking meetings that don't happen, which inflates their numbers and wastes AE time.
One more efficiency metric most teams miss: handoff quality. 74% of BDRs hand off as Opportunities rather than Leads, which is the cleanest handoff for AE adoption. If your BDRs are passing raw leads, you're creating friction that kills conversion downstream.
Activities Per Day (Coach - Never Compensate)
Here's the thing: stop tracking dials per day as a performance metric.
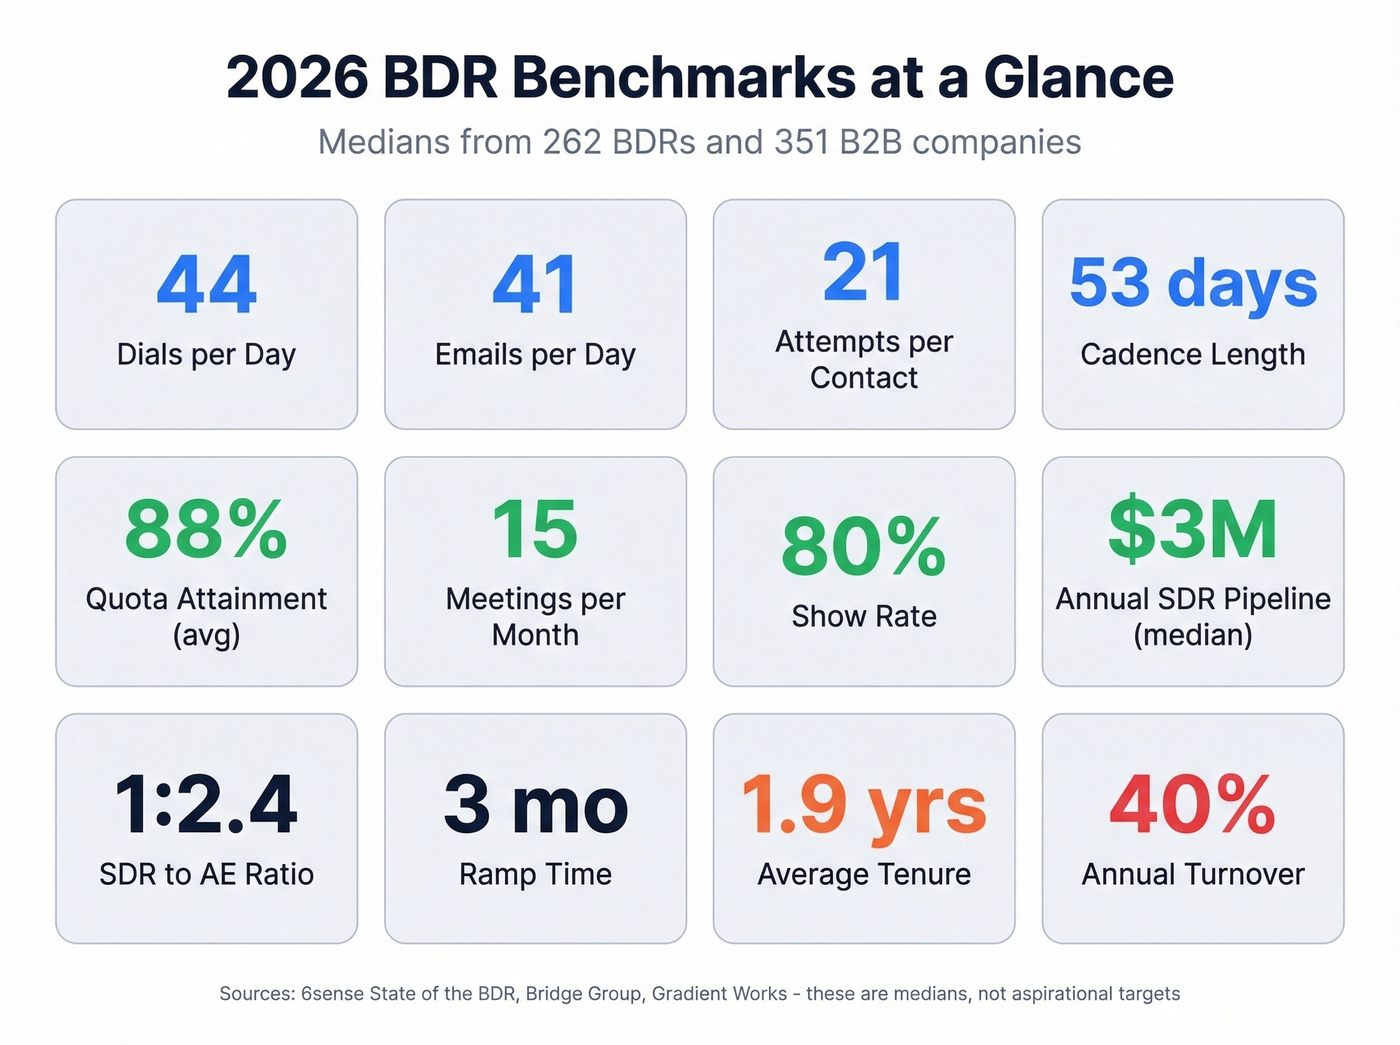
Across 351 B2B companies in Bridge Group's study, average daily activities land at 44 dials and 41 emails. The average cadence runs 21 attempts per contact over 53 days, across 9 individuals per account - that's roughly 189 total touches per account. It takes 18+ dials to get a single connect, and callback rates sit below 1%. Cold email reply rates hover at 1-5%.
These numbers are useful for capacity planning and coaching conversations. They're terrible for compensation. The moment you pay reps per dial, you get exactly what you incentivize - volume without intent.
If you need a cleaner way to define and audit rep effort, start with sales activities that map to pipeline stages.
2026 Benchmark Table
Consolidated benchmarks from the 6sense BDR study (262 BDRs), Bridge Group (351 companies), and Gradient Works:
| Metric | Benchmark |
|---|---|
| Quota attainment | 88% avg |
| Dials/day | 44 |
| Emails/day | 41 |
| Attempts/contact | 21 |
| Attempts/opportunity | ~189 |
| Cadence length | 53 days |
| Contacts/account | 9 |
| Dials to connect | 18+ |
| Cold email reply | 1-5% |
| Meetings/month | 15 |
| Show rate | 80% |
| SDR pipeline (annual) | $3M median |
| SDR:AE ratio | 1:2.4 |
| Ramp time | 3 months |
| Tenure | 1.9 years |
| Annual turnover | 40% |
These aren't aspirational targets - they're medians. Your top performers should be well above these lines, and your bottom quartile will be well below.
If you want to pressure-test these numbers against your broader funnel, align them with your funnel metrics and pipeline health view.
You just read that teams jump from 3% to 7% lead-to-opportunity conversion by cleaning their contact database. Prospeo delivers 98% email accuracy with a 7-day refresh cycle - so your BDRs stop wasting dials on dead numbers and bounced emails. At $0.01 per email, fixing data quality costs less than one lost meeting.
Stop bleeding pipeline to bad data. Start with 75 free verified emails.
The Support Gap
The most actionable data point in the 6sense report has nothing to do with dials or emails. Supported BDRs hit 95% quota attainment. Unsupported ones hit 80%. That 15-point gap has held for four consecutive years.
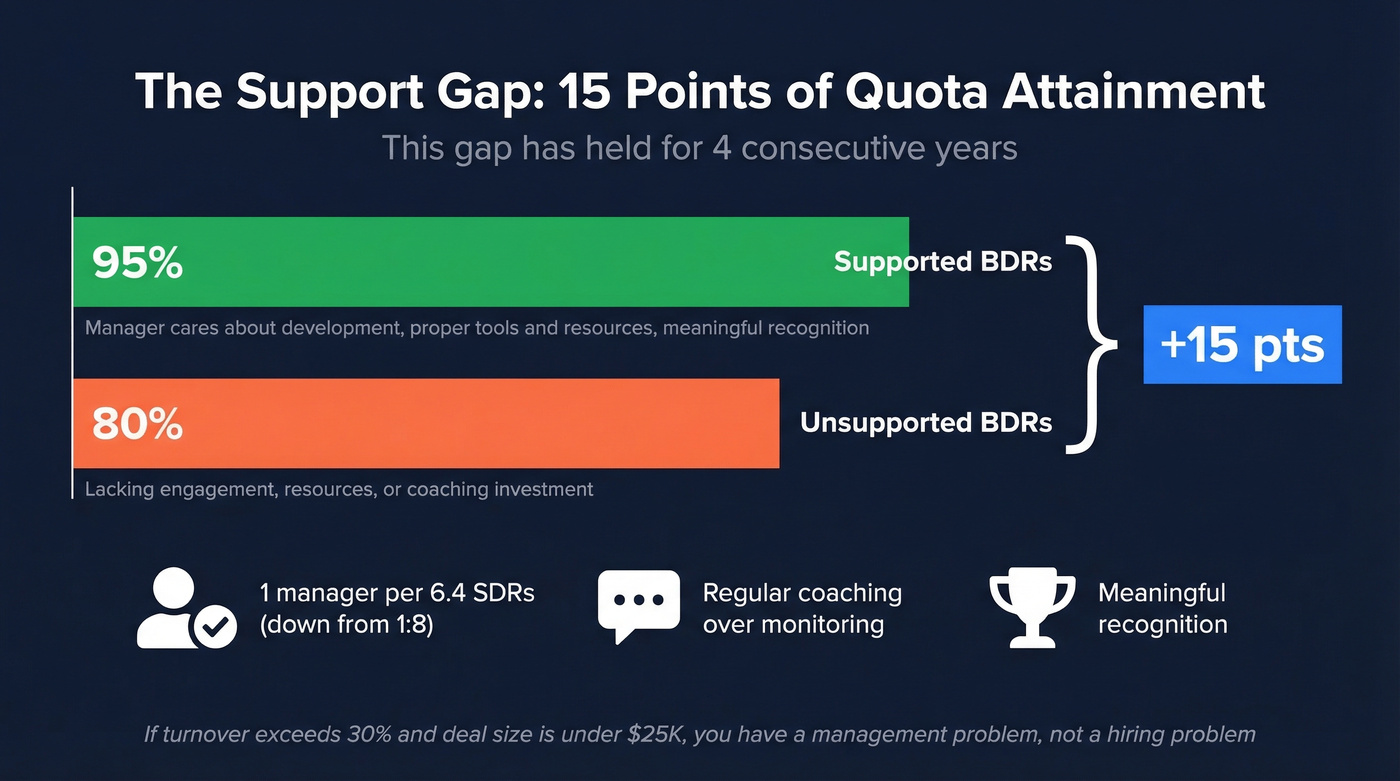
"Supported" doesn't mean micromanaged. 6sense measures it through engagement items - whether reps feel their manager cares about their development, whether they have the tools and resources to do their job, whether they received meaningful recognition recently. The current median is one manager per 6.4 SDRs, tighter than the 1:8 ratio from a few years ago. That shift reflects a hard truth: coaching matters more than monitoring.
If your average deal size is under $25K and turnover exceeds 30%, you don't have a hiring problem. You have a management problem. Fix the support gap before you touch a single dashboard metric.
Tying Metrics to Comp
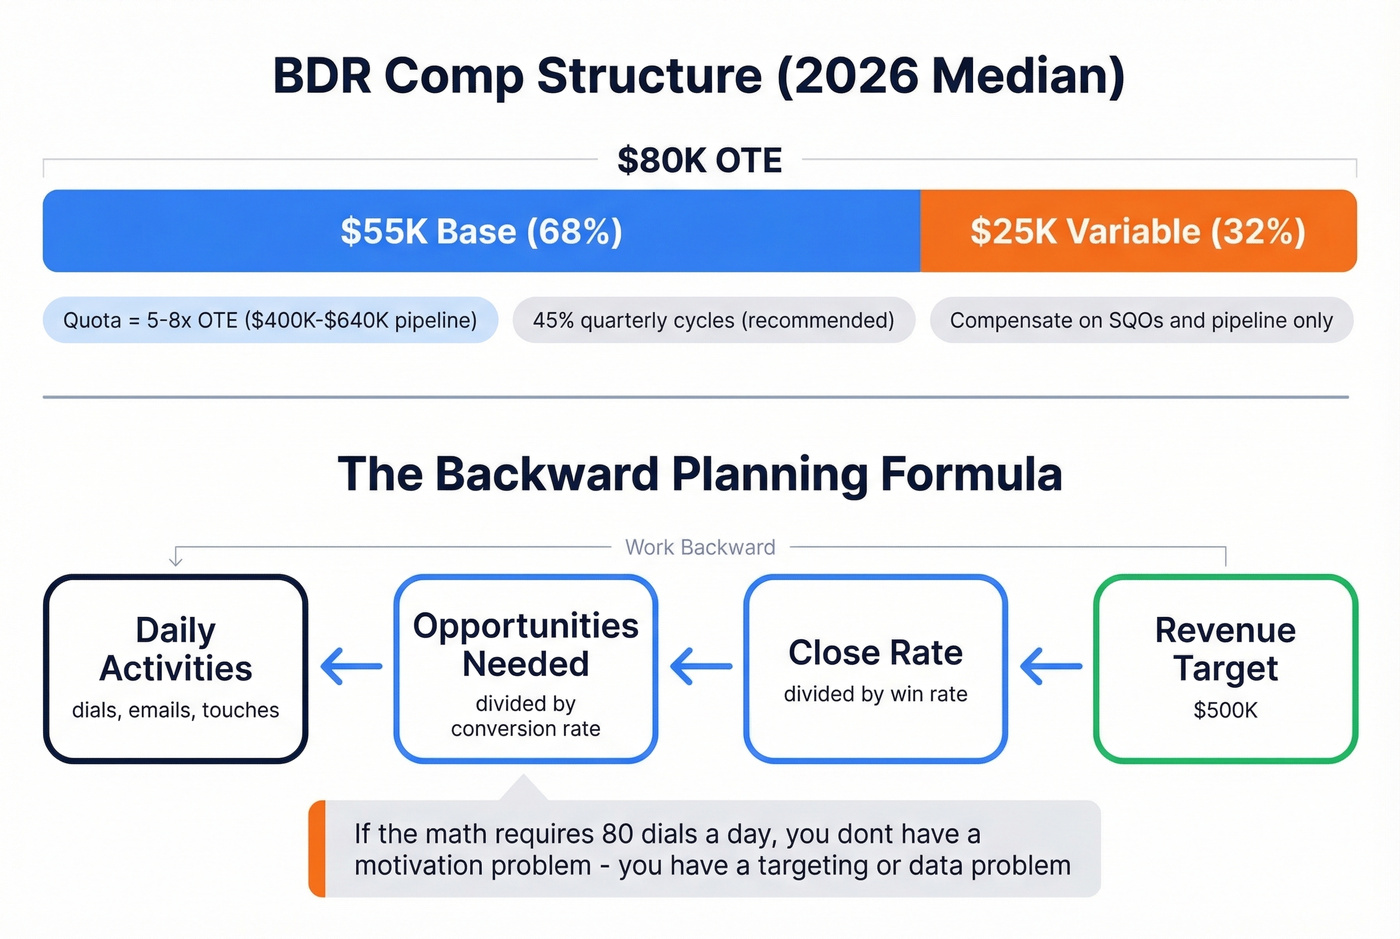
The median BDR earns $55K base, $80K OTE, with a 68:32 base-to-variable split. QuotaPath's guidance suggests setting quota at 5-8x OTE, which means an $80K OTE rep should carry $400-640K in pipeline responsibility. Quota cycles split roughly 45% quarterly, 25% annual, 25% monthly, with the rest on custom structures. We've seen quarterly work best for most teams - it's long enough to smooth out bad weeks but short enough to keep urgency high.
If you need to sanity-check OTE math across roles, use an OTE framework before you lock comp bands.
BDR Drivers and Ratios
The backward-planning formula every manager should run:
Activity x Conversion Rate = Opportunities x Close Rate = Revenue.
Start with the revenue target and work backward to daily activity. If the math requires 80 dials a day, you don't have a motivation problem - you have a targeting or data problem. Compensate on SQOs and pipeline value. Never on activity volume. Full stop.
Metrics That Backfire
If your reps know how to game a metric, it's not a metric - it's a game.
This is how you get 40% annual turnover. You build a system that rewards theater over outcomes, burn out the honest reps, and retain the ones who've learned to optimize for the wrong thing. The "KPI soup" problem - tracking 14 metrics and none of them explaining why pipeline is down - is a symptom of the same disease. More dashboards don't fix misaligned incentives. The consensus on r/sales backs this up: reps consistently complain about being measured on activity volume when their actual output is strong.
If you're rebuilding the system, anchor it in sales operations metrics instead of vanity KPIs.
The Data Quality Multiplier
The 6sense benchmark report found that contact data is the #1 resource BDRs request. Not better tools, not more training - data.
Bad data means bounced emails, which inflates "sent" numbers, which creates false activity metrics, which makes your entire dashboard unreliable. Look at what happened at Snyk: bounce rates dropped from 35% to under 5% after switching data providers, and AE-sourced pipeline jumped 180%. If your bounce rate is above 5%, you're not measuring BDR performance - you're measuring how bad your contact data is.
Prospeo delivers 98% verified email accuracy on a 7-day data refresh cycle, which means your activity metrics reflect actual rep effort rather than data decay. The 125M+ verified mobile numbers carry a 30% pickup rate. When your connect rate metric improves overnight after switching data sources, it wasn't your reps who changed - it was the numbers they were dialing.
If you want the benchmarks and fixes for this, track your email bounce rate and follow an email deliverability checklist.

Contact data is the #1 resource BDRs request - not tools, not training. Prospeo gives your reps 300M+ verified profiles with 125M+ direct dials (30% pickup rate) and 30+ filters for intent, technographics, and headcount growth. Teams using Prospeo book 35% more meetings than Apollo users.
Give your BDRs the data they're actually asking for.
AI-Era Metrics Worth Adding
60% of BDRs already use AI tools. AI responds in under a minute versus the 42-hour human average. AI-assisted qualified leads cost roughly $39 versus $262 for purely human-sourced ones, and hybrid teams see a 35% productivity boost. But human SDRs still hit a 71% show rate versus 52% for AI, and the revenue gap is wider - $147K human versus $56K AI over the same period.
If you're evaluating tooling, start with a shortlist of SDR tools and generative AI sales tools that map to your workflow.
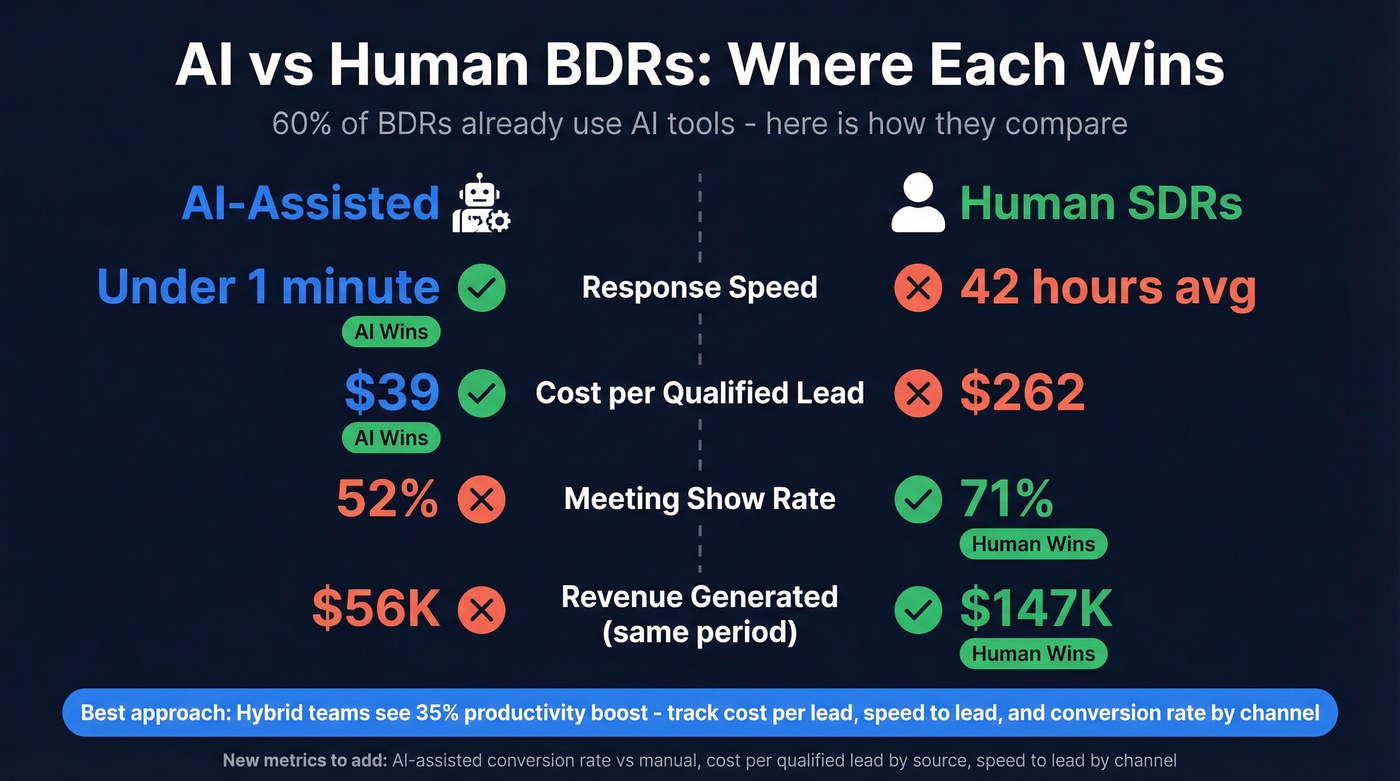
The new metrics for your dashboard: cost per qualified lead broken out by AI-assisted vs. manual, speed-to-lead by channel, and AI-assisted conversion rate versus manual. These won't replace SQOs and pipeline - they'll help you understand where AI amplifies your team and where it falls short.
FAQ
What's the difference between BDR and SDR metrics?
Functionally identical in most orgs. BDRs focus on outbound - 85% per the 6sense benchmark - while SDRs handle inbound or allbound motions. The core metrics (SQOs, pipeline generated, conversion rates) are the same regardless of title. Don't overthink the naming convention.
How many meetings booked per week is good?
The benchmark is 15 meetings per month, roughly 3-4 per week with an 80% show rate. Adjust downward for enterprise motions with longer cycles and higher deal values, and upward for SMB or velocity sales where volume matters more than individual deal size.
How do I improve BDR connect rates?
Start with data quality - if your phone numbers are wrong, more dials won't help. Then optimize call timing and cadence sequencing to maximize the chances of reaching a live human. Teams that pair verified mobile numbers with multi-threaded outreach across 9+ contacts per account consistently outperform single-threaded approaches.