Bottom-Up Revenue Forecasting: 2026 Guide + Worked Example
It's Q4 planning week. Your VP of Sales just submitted a forecast built on "TAM x 1% market capture" and a hockey stick that would make the whole board cringe. The CFO isn't buying it. Neither should you.
TAM x market share is a wish, not a forecast - and even after quotas were lowered by 13.3%, 77% of sellers still missed their number last year. The fix isn't better spreadsheets. It's bottom-up revenue forecasting: building your projections from the ground up, literally. As one founder put it on r/EntrepreneurRideAlong, top-down TAM forecasts feel unrealistic because they "don't specify how you'll actually acquire customers." We've built dozens of these models for SaaS teams, and the bottoms-up approach below is what actually holds up under investor scrutiny and real-world execution.
What You Need (Quick Version)
- Bottom-up = unit-level drivers, not TAM math. You're forecasting from leads, conversion rates, deal sizes, and rep capacity.
- Core formula: Revenue = Units x Price, layered with churn, expansion, and acquisition rates per segment.
- Plan for 85% quota attainment, not 100%. Assuming every rep hits quota is the fastest way to miss your number.
- Rolling 90-day forecasts beat annual models. Assumptions compound. A 12-month forecast is fiction by month six.
- Your forecast is only as good as your pipeline data. If 30% of your contact list bounces, every downstream conversion assumption is inflated.
What Is Bottom-Up Revenue Forecasting?
Bottom-up revenue forecasting builds projections from the smallest measurable inputs in your business - individual products, customer segments, sales reps, channels, conversion rates - and aggregates them into a total revenue number. The core formula is simple on the surface: Revenue = Price x Quantity. The real work lives in defining what "quantity" means for your business.
For a SaaS company, that means modeling how many leads each channel produces, what percentage convert to trials, what percentage of trials become paying customers, and how those customers churn, expand, or downgrade over time. For e-commerce, it's traffic x conversion rate x average order value. For a services firm, it's billable headcount x utilization rate x average hourly rate. The inputs change; the principle doesn't.

The opposite approach - top-down forecasting - starts with total addressable market and applies a capture percentage. It's useful for board decks and TAM sizing, but it tells you nothing about whether your team can actually execute. A bottoms-up approach forces you to answer the hard question: how, specifically, will this revenue materialize?
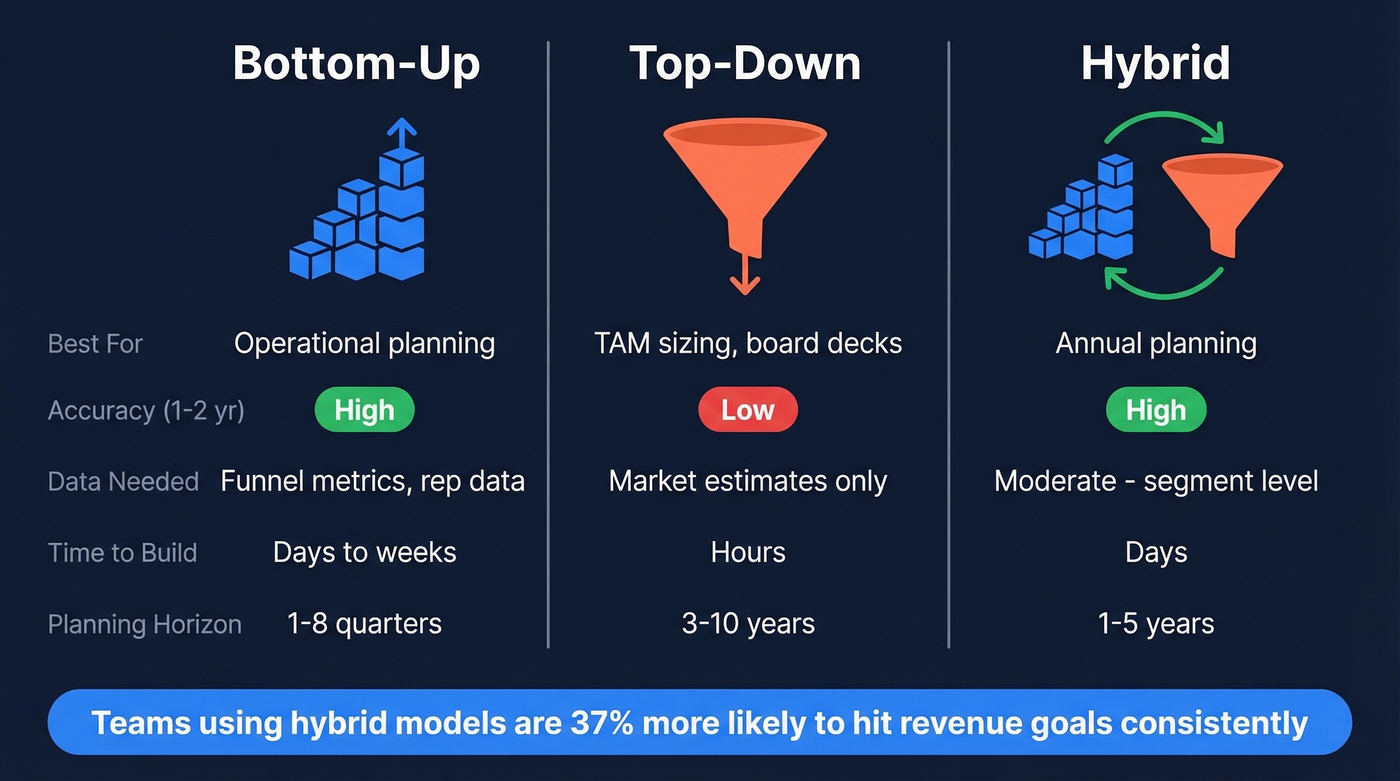
Bottom-Up vs. Top-Down vs. Hybrid
| Factor | Bottom-Up | Top-Down | Hybrid | Winner |
|---|---|---|---|---|
| Best for | Operational planning | TAM sizing, board context | Annual planning | Bottom-Up (for execution) |
| Data needed | High (funnel metrics) | Low (market estimates) | Moderate | Top-Down (lowest barrier) |
| Accuracy (1-2 yr) | High | Low | High | Bottom-Up |
| Time to build | Days to weeks | Hours | Days | Top-Down (fastest) |
| Planning horizon | 1-8 quarters | 3-10 years | 1-5 years | Hybrid (most flexible) |
There's also a third option - middle-out forecasting - where you start at a regional or product-category level and build both up and down from there. It's a pragmatic compromise for companies with decent segment-level data but incomplete rep-level detail.
Here's the thing: companies using a hybrid model are 37% more likely to consistently hit revenue goals. That tracks with what we've seen in practice. Pure bottom-up can get lost in granularity. Pure top-down is fantasy. The sweet spot is building your operating forecast bottom-up, then sanity-checking it against a top-down market view.
The recommendation: Use bottom-up for anything under two years. Use hybrid for annual planning. Use top-down only for TAM sizing and investor context - never as your operating forecast.
Building a SaaS Revenue Driver Model
Let's walk through a full worked example. We'll use a fictional company called DataFlow - a B2B SaaS platform with three pricing tiers. This is the kind of model a Series A finance team would actually build.
Define Your Revenue Drivers
DataFlow's pricing structure:
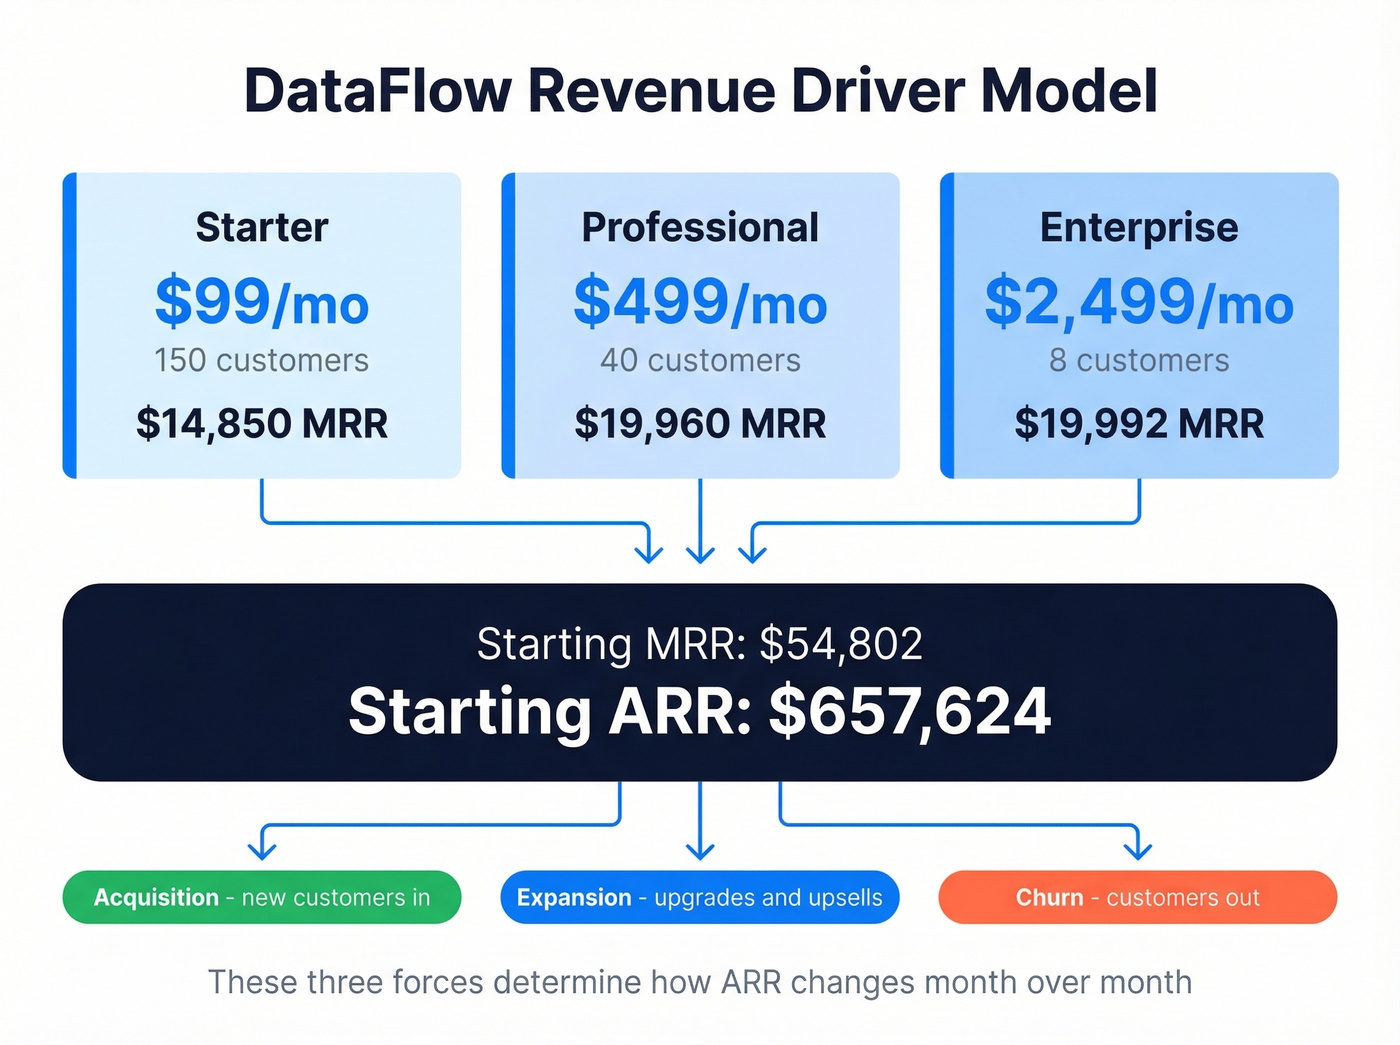
| Tier | Monthly Price | Starting Customers |
|---|---|---|
| Starter | $99/mo | 150 |
| Professional | $499/mo | 40 |
| Enterprise | $2,499/mo | 8 |
Starting MRR: (150 x $99) + (40 x $499) + (8 x $2,499) = $14,850 + $19,960 + $19,992 = $54,802/mo, or $657,624 ARR.
Everything else is about modeling how this number changes month over month. The key drivers are acquisition (new customers in), churn (customers out), and expansion (customers moving up-tier).
Model Churn, Upgrades, and Acquisition
It's July. Your Professional pipeline just dropped 30% because half your prospects are on vacation. This is why raw averages kill forecasts - you need tier-level assumptions that account for real behavior.
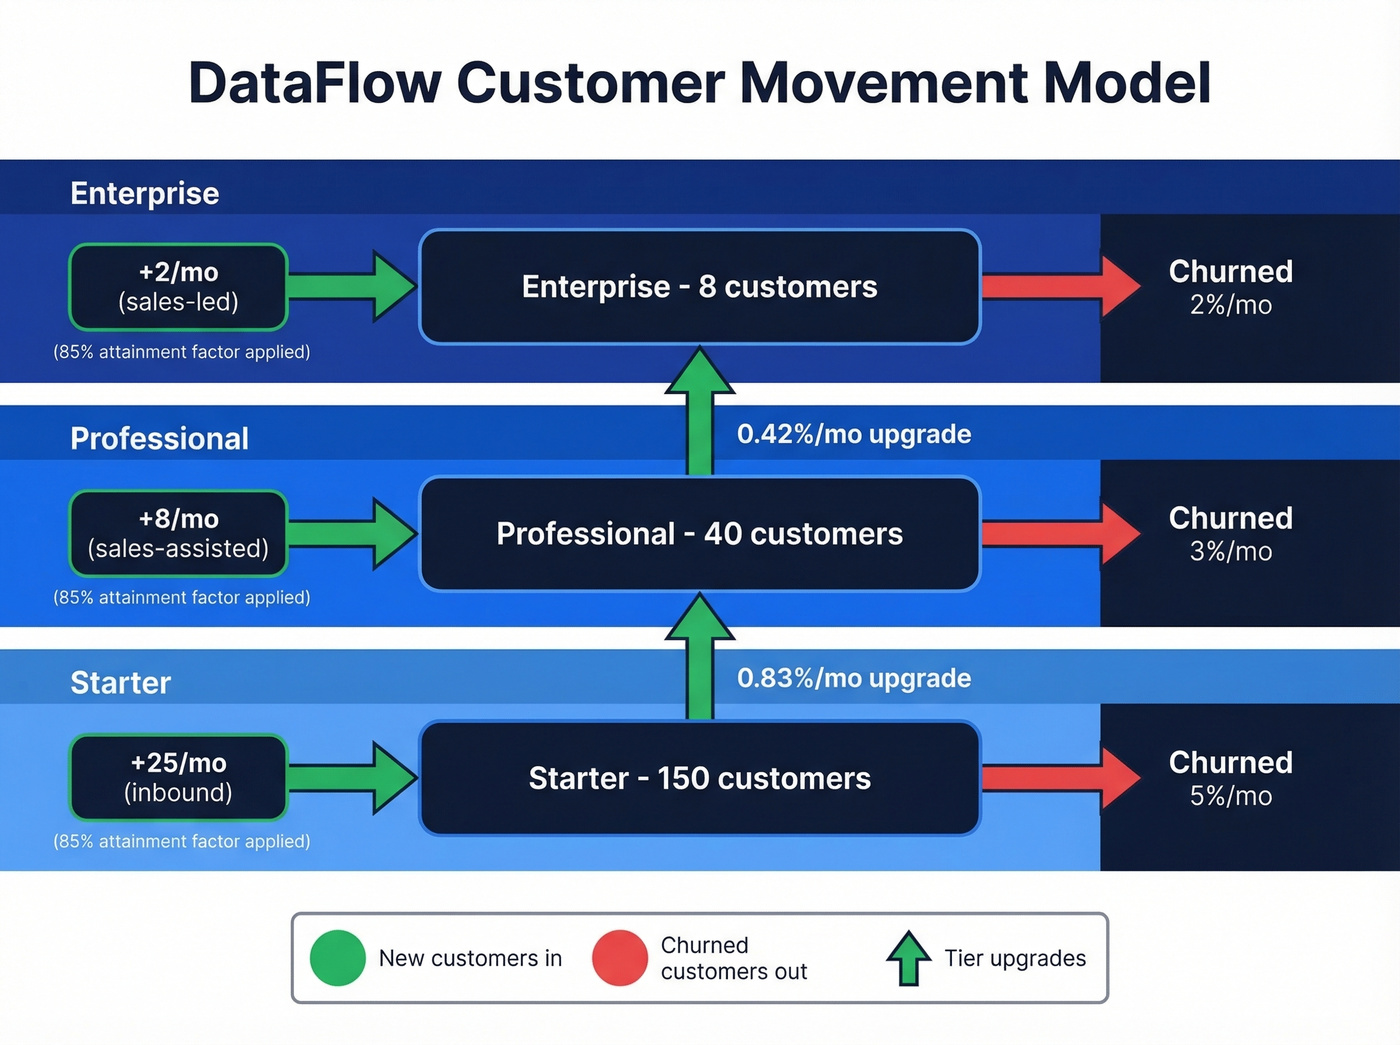
Churn assumptions by tier:
- Starter: 5% monthly - self-serve customers with lower commitment
- Professional: 3% monthly - sales-assisted, stickier relationships
- Enterprise: 2% monthly - high-touch, typically contracted annually
Upgrade assumptions:
- 10% of Starter customers upgrade to Professional annually (~0.83%/month)
- 5% of Professional customers upgrade to Enterprise annually (~0.42%/month)
New customer acquisition per month:
- Starter: +25 via inbound and self-serve
- Professional: +8 via sales-led motions
- Enterprise: +2 via sales-led, longer cycle
Here's where most models go wrong: they lump all revenue into one pipeline. Separate at least three - renewals, expansion, and new business - because each has fundamentally different conversion rates, cycle lengths, and predictability.
Seasonality and Sales Ramp
DataFlow applies these seasonality multipliers based on two years of historical data:
- Enterprise: 150% in Q4 due to budget flush, baseline rest of year
- Professional: 70% in July/August during summer slowdown
- Starter: 60% in December when SMB activity drops off
Sales ramp for new hires follows a standard schedule: 0% productivity in months 1-2, 50% in months 3-4, 75% in months 5-6, and full quota from month 7 onward. If DataFlow hires two AEs in Q2 at $70k/year each, those reps won't contribute meaningful pipeline until Q3 at the earliest (use a simple 30-60-90 plan to standardize ramp assumptions).
And the most important adjustment: plan for ~85% attainment, not 100%. We've never seen this rule steer a team wrong. When 77% of sellers miss quota even after targets are lowered, assuming full attainment is just optimism dressed up as math.
The ARR Momentum Table
Your output should be a monthly ARR momentum table that breaks revenue movement into four components: New ARR, Expansion ARR, Contraction ARR, and Churned ARR.
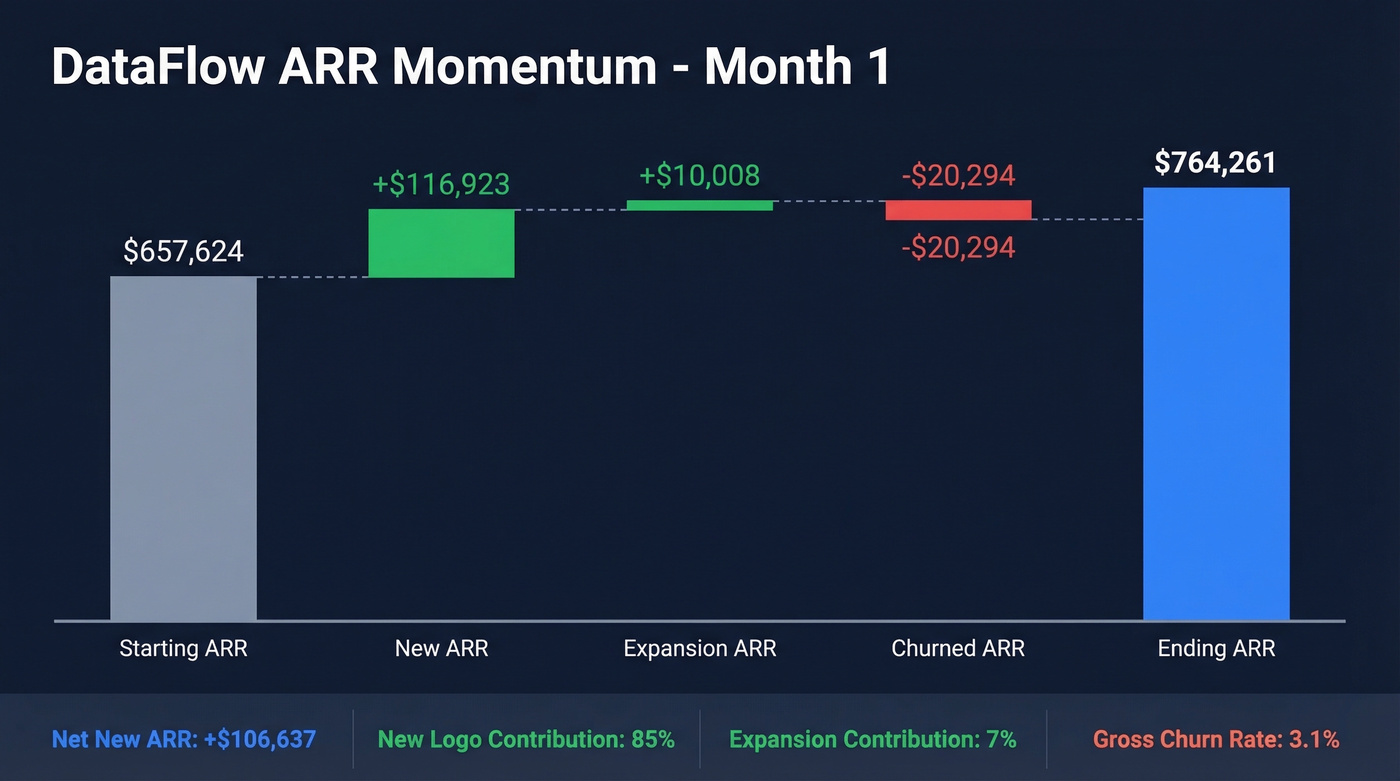
Here's DataFlow's Month 1, calculated from the assumptions above with the 85% attainment factor applied to new acquisition:
Month 1 calculations:
- New ARR: (25 x 0.85 x $99 x 12) + (8 x 0.85 x $499 x 12) + (2 x 0.85 x $2,499 x 12) = $25,245 + $40,698 + $50,980 = $116,923
- Expansion ARR (upgrades): (150 x 0.83% x ($499-$99) x 12) + (40 x 0.42% x ($2,499-$499) x 12) = $5,976 + $4,032 = $10,008
- Contraction ARR: Assumed negligible in early months (no downgrade data yet) = $0
- Churned ARR: (150 x 5% x $99 x 12) + (40 x 3% x $499 x 12) + (8 x 2% x $2,499 x 12) = $8,910 + $7,186 + $4,798 = -$20,294
Month 1 summary:
| ARR Component | Month 1 |
|---|---|
| New ARR | +$116,923 |
| Expansion ARR | +$10,008 |
| Contraction ARR | -$0 |
| Churned ARR | -$20,294 |
| Net New ARR | +$106,637 |
| Cumulative ARR | $764,261 |
This format makes it immediately obvious where growth is coming from and where you're leaking. If churned ARR starts growing faster than new ARR, no amount of acquisition will save you - and you'll see it in this table before it shows up in your bank account.
Your bottom-up forecast breaks the moment bad contact data inflates your pipeline. If 30% of emails bounce, every conversion rate downstream is a lie. Prospeo delivers 98% email accuracy with a 7-day refresh cycle - so the leads-to-demos-to-closes funnel you're modeling actually reflects reality.
Stop forecasting on phantom pipeline. Start with data that converts.
Validating Your Forecast
A forecast without validation is just a spreadsheet with opinions.
The simplest gut-check: compare your bottom-up projections to your weighted pipeline. Take each open opportunity, multiply its value by its probability of close, and sum them for the month. If your weighted pipeline is less than your forecast, your driver assumptions are wrong.
Forecast accuracy benchmarks give you a target:
- Acceptable: 80-85%
- Good: 85-95%
- World-class: 95%+
Most teams fall below 80% because they overestimate conversion rates and pretend churn doesn't exist. The fix is a monthly plan-vs-actual cadence where you compare each driver assumption against reality and adjust. Bottom-up accuracy degrades sharply beyond one quarter because assumptions compound - build 90-day forecasts and roll them forward. It's more work, but it's the only way to stay honest (track the same drivers as your funnel metrics so you can diagnose where the model breaks).
Hot take: If your deals average under $15k, you probably don't need enterprise-grade forecasting software. A well-structured spreadsheet with honest inputs will outperform a $50k FP&A platform fed garbage data every single time. The bottleneck is never the tool. It's the quality of what goes into it.
One thing most forecasting guides skip entirely: your forecast assumes reps can actually reach the prospects in their pipeline. If 30% of your emails bounce, your conversion rate assumptions are built on sand. Prospeo verifies emails in real time with 98% accuracy on a 7-day refresh cycle - compared to the six-week industry average - which means the pipeline numbers feeding your model actually reflect reality (start by monitoring your email bounce rate as a leading indicator).
Mistakes That Kill Forecasts
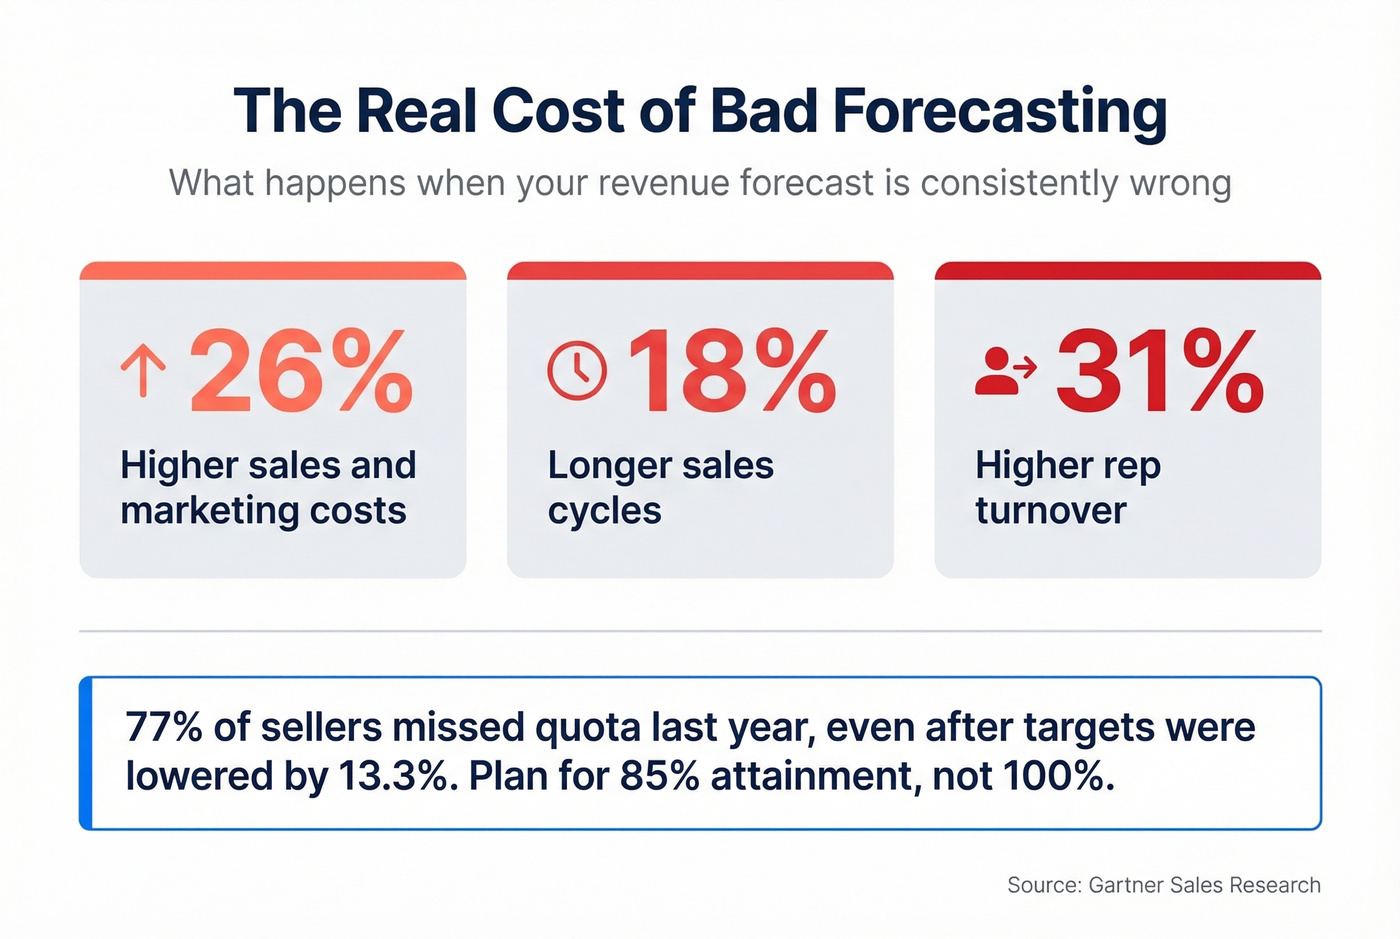
Poor forecasting doesn't just mean missed targets. Companies with inaccurate forecasts face 26% higher sales and marketing costs, 18% longer sales cycles, and 31% higher rep turnover. These seven mistakes are the most common culprits.
Using top-down "spreadsheet magic" instead of unit-level drivers. Investors see through "TAM x 1% capture" instantly. The math works on paper but the logic is unrealistic. Build from leads, conversion rates, and capacity.
Assuming 100% quota attainment. 77% of sellers missed quota last year. Plan for 85% and be pleasantly surprised if you beat it.
Ignoring churn and contraction. A model that only shows new revenue flowing in is a fantasy. Net revenue retention is what actually drives compounding growth (run a lightweight churn analysis at least quarterly).
Mixing renewal, expansion, and new-business pipelines. Each has different conversion rates, cycle lengths, and predictability. Lumping them together makes your forecast useless for diagnosing problems.
Building static annual forecasts. A 12-month model built in January is fiction by April. Rolling 90-day forecasts updated monthly keep your assumptions honest.
Over-optimism on conversion rates without data. If you don't have at least three months of funnel data, your conversion assumptions are guesses. Label them as such and update aggressively (use sales conversion rate benchmarks as a sanity check).
Letting stale CRM data corrupt pipeline assumptions. Poor data quality costs companies $12.9M annually. If your reps are working dead leads, every downstream assumption - connect rates, demos booked, deals closed - is inflated. Audit your bounce rates quarterly at minimum (a simple pipeline health review catches this early).
Forecasting for Fundraising
Lead investors increasingly demand a bottoms-up model before committing to a round. While 58% of successful seed decks skip financial data entirely, Series A and beyond expects 3-5 year projections - and investors expect a credible path to $10M revenue within three years.
The key word is credible. Investors aren't looking for hockey sticks. They're evaluating your judgment and the quality of your assumptions. A bottom-up model that shows realistic acquisition costs, honest churn rates, and a clear channel strategy signals founder maturity far more than an aggressive top-line number.
Look, the CPA math is what investors actually stress-test. If you spend $5,000 on marketing in month one and expect a $50 CPA, that's roughly 100 new customers. Can you show that CPA from existing data? Can you show it holds at 2x the spend? That's the conversation they want to have, and a bottoms-up model is the only format that lets you have it with real numbers instead of hand-waving (tie CAC assumptions back to your cost to acquire customer model).
The metrics investors want to see alongside your forecast: CAC, LTV, LTV/CAC ratio, MRR, monthly churn, gross margin, and net revenue retention. If your model doesn't produce these as outputs, it's not finished.
Industry Drivers Beyond SaaS
The internet is flooded with SaaS-only examples. Here's how bottom-up revenue forecasting applies across five common business models:
| Business Model | Primary Unit | Key Drivers | Watch Out For |
|---|---|---|---|
| SaaS | Subscription | MRR, churn, expansion, new logos | Mixing pipeline types |
| E-commerce | Transaction | Traffic x conversion x AOV (model refunds separately) | Seasonal swings |
| Services / Agency | Billable hour | Headcount x utilization x rate | Utilization over-optimism |
| Marketplace | Transaction | GMV x take rate, both supply and demand side | Chicken-and-egg growth |
| Retail / DTC | Store or SKU | Foot traffic x conversion x basket size | New store ramp time |
The principle is identical across all five: identify the smallest measurable unit of revenue, model how many of those units you'll produce, and aggregate upward. The DataFlow example above translates directly - just swap the drivers.
Tools and Templates
You don't need expensive software to build a revenue driver model. You need the right structure.
| Tier | Tools | Price Range |
|---|---|---|
| Free | Google Sheets, Smartsheet templates | $0 |
| Lightweight | LivePlan, Jirav | $15-50/mo |
| Mid-market | Cube, Forecastio | ~$1,500-5,000/mo |
| Enterprise FP&A | Vena, Planful, Adaptive | $25,000-100,000+/yr |
| Enterprise Planning | Anaplan, Pigment | $75,000-150,000+/yr |
The Smartsheet SaaS template includes fields for MRR by tier, monthly churn, CAC by channel, LTV, and net revenue retention analysis - which covers 90% of what you need. Skip this if you're already running Adaptive or Planful; migrating to a spreadsheet template would be a step backward.
Vena is worth a look if your finance team lives in Excel - it's built as an Excel-native FP&A platform that lets you make bottom-up or top-down adjustments without leaving the spreadsheet. For enterprise, Anaplan and Workday Adaptive remain the defaults, though Pigment is gaining ground fast (if you're evaluating vendors, start with a shortlist of sales forecasting solutions by company stage).
On the AI front: teams using ML-powered forecasting hit accuracy targets 88% of the time vs. 64% with traditional spreadsheets, with MAPE dropping from 15-40% to 5-15%. That gap will only widen as these tools mature.
FAQ
What's the difference between bottom-up and top-down forecasting?
Bottom-up builds revenue from unit-level drivers like leads, conversion rates, and deal sizes. Top-down starts with market size and applies a capture percentage. Bottom-up is more accurate for operational planning because it forces you to specify how revenue will materialize. Use top-down only for TAM sizing and investor context.
How accurate should a bottom-up forecast be?
Acceptable accuracy is 80-85%, good is 85-95%, and world-class is 95%+. Most teams fall below 80% because they overestimate conversion rates and ignore churn. Rolling 90-day forecasts updated monthly outperform static annual models because they limit how far assumptions can compound.
How do I improve forecast accuracy with better data?
Start by auditing your pipeline contact data - if emails bounce and phone numbers are disconnected, your conversion rate assumptions are built on sand. Implement a quarterly data hygiene cadence: measure bounce rates, flag stale records, and re-verify contacts. Tools like Prospeo automate this with 98% email accuracy and a 7-day refresh cycle, but the habit matters more than the tool.
The bottom line: bottom-up revenue forecasting is only as good as the assumptions feeding it. Get the inputs right, validate monthly, and resist the temptation to build a 12-month model you'll never update. Start with 90 days, prove your assumptions, and roll forward.
You just modeled rep capacity, churn rates, and seasonality down to the tier. Don't let bad prospect data be the variable that wrecks it all. Prospeo gives your reps 300M+ verified contacts with 30+ filters - so the 25 Starter leads and 8 Professional leads you're forecasting per month actually show up in pipeline.
Build your forecast on 300M+ verified contacts at $0.01 per email.