Business Intelligence for Sales: What Actually Moves the Needle
70% of B2B sales reps missed their quotas in 2024. Most of those teams had dashboards. They had reports. They had weekly pipeline reviews with color-coded charts. What they didn't have was business intelligence their sales teams could actually use to change behavior - not just validate opinions after the fact.
The gap isn't what BI is. It's what separates actionable sales analytics from an expensive screensaver. A widely shared thread on r/BusinessIntelligence nails it: "Dashboards don't drive action. They validate opinions."
The Short Version
BI for sales works only when it's built on clean data and tied to 5-7 specific metrics. Most implementations fail because teams over-invest in dashboards and under-invest in data quality.
Start with pipeline velocity, win rate, and sales cycle length. Use Power BI or Tableau for visualization, a verified data provider feeding your CRM, and Gong for conversation intelligence. Skip the $40K+ enterprise stack until you've proven the basics work with a lean setup.
What BI for Sales Actually Means
Business intelligence and sales intelligence get conflated constantly, and that confusion is why teams buy the wrong tools.
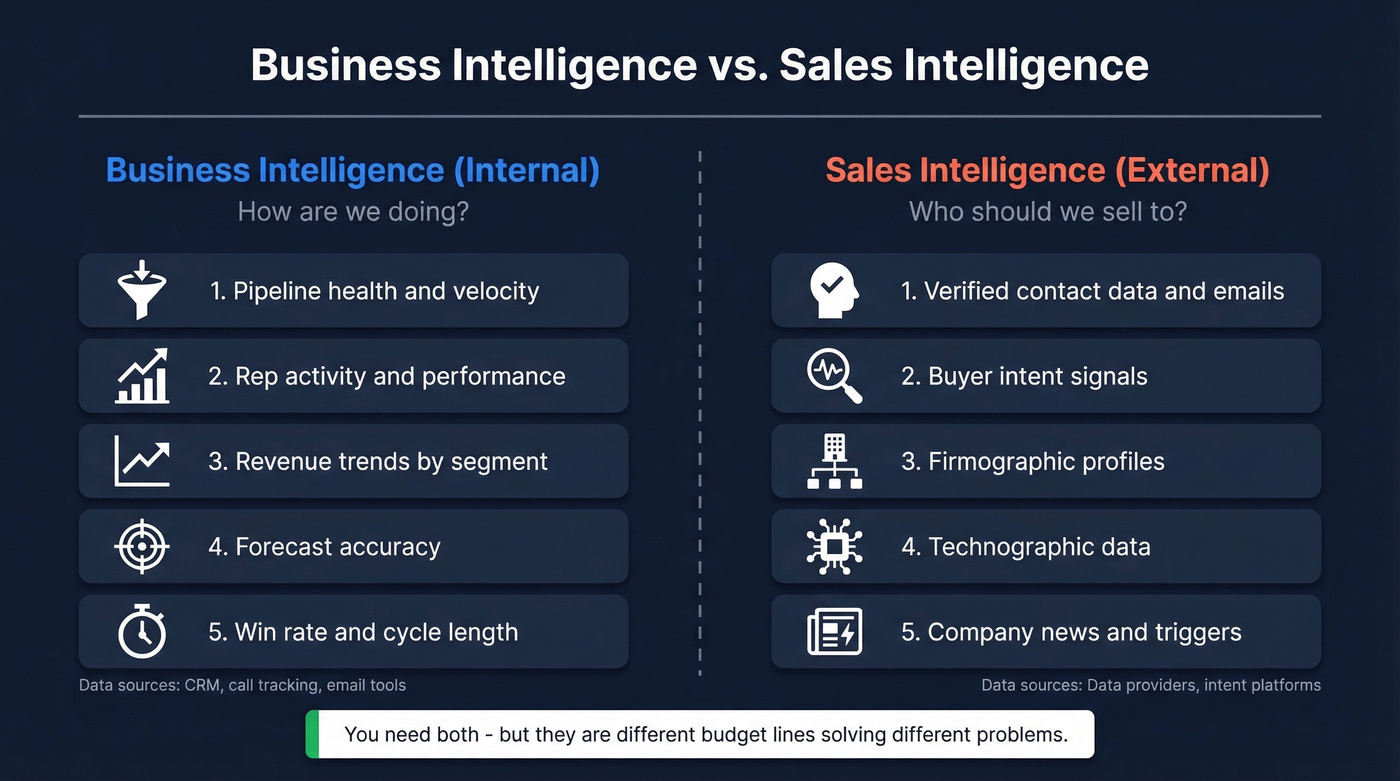
BI for sales is about internal performance visibility - pipeline health, rep activity, revenue trends, forecast accuracy. It answers "how are we doing?" and "where are we losing deals?" Sales intelligence is external: contact data, intent signals, firmographics, technographics. It answers "who should we sell to?"
You need both, but they're different budget lines solving different problems.
Fortune Business Insights pegs the sales intelligence market at $5.37B in 2026, growing to $12.45B by 2034. Precedence Research estimates roughly ~11% CAGR through the same period. That's a lot of money, and most of it gets spent on tools that solve the wrong half of the equation. The bottleneck for most sales teams isn't research - it's response rates. Better data improves response rates. More dashboards don't.
The 5-7 Metrics That Matter
Here's the thing: 68% of sales teams still don't track pipeline velocity. That's the single most diagnostic metric in sales, and two-thirds of teams ignore it.
We've found these five categories map directly to decisions people actually make:
Revenue & Growth: Average sales price and monthly recurring revenue. These tell you if deal sizes are trending up or down - and whether that trend is intentional or accidental.
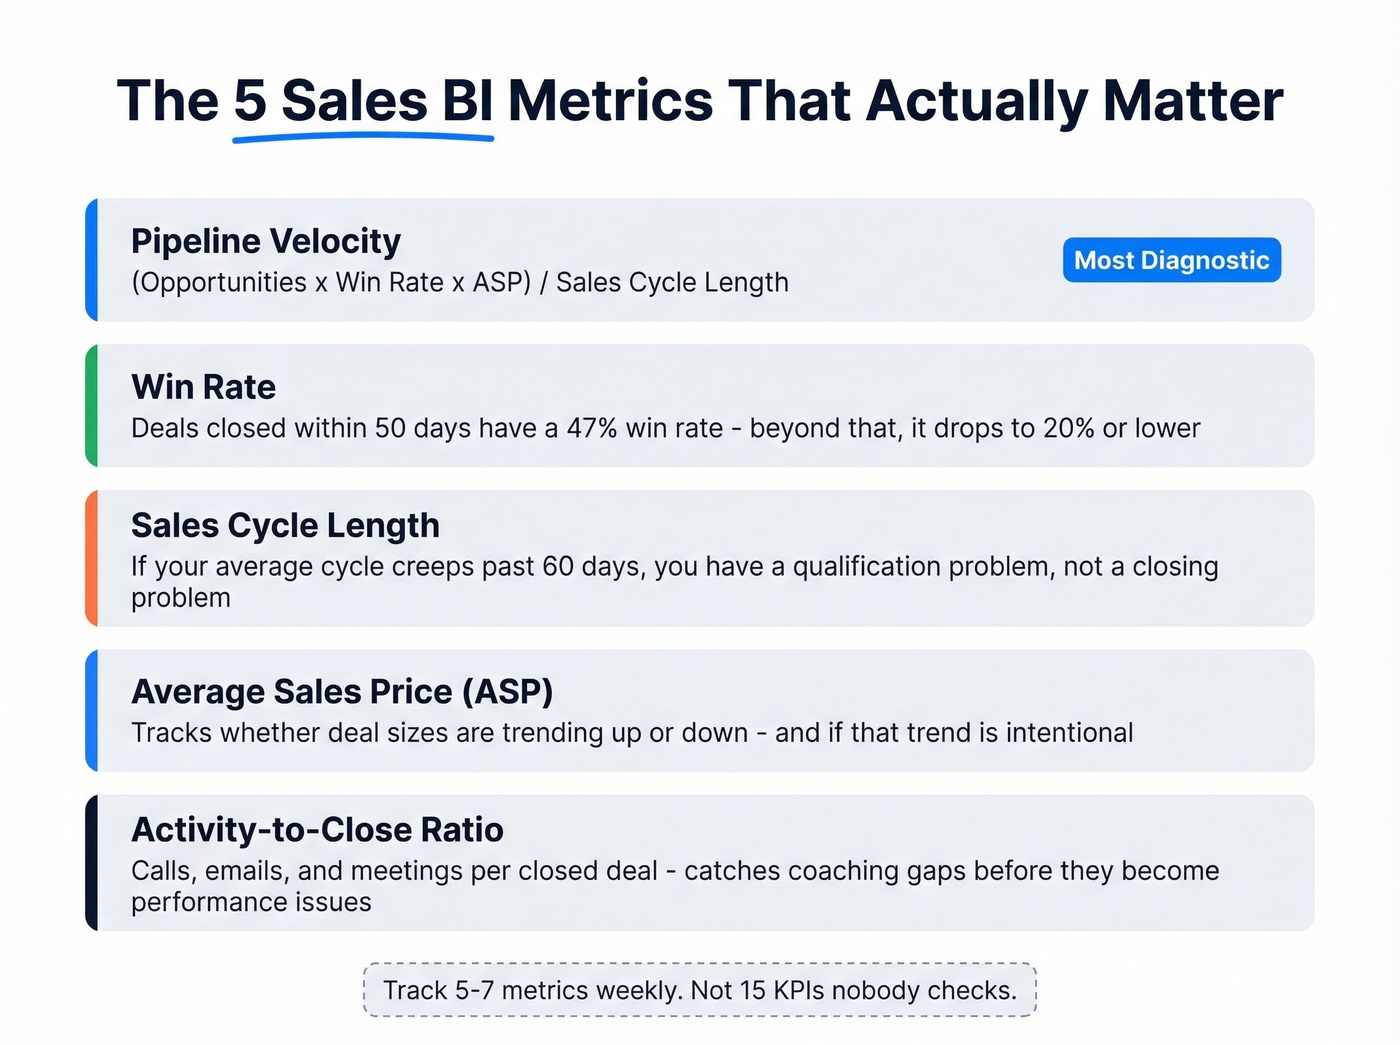
Pipeline Health: Pipeline velocity - (# of opportunities x win rate x ASP) / sales cycle length. This single number captures how fast your pipeline converts to revenue. If you track nothing else, track this.
Sales Efficiency: Win rate and sales cycle length. Deals closed within 50 days carry a 47% win rate. Beyond that threshold, win rates drop to 20% or lower. If your average cycle is creeping past two months, you've got a qualification problem, not a closing problem. (If you want a tighter system, use a real deal qualification framework.)
Activity & Forecast: Activity-to-close ratio - how many calls, emails, and meetings does it take to close one deal? This is where you catch rep-level coaching opportunities before they become rep-level performance issues. (More examples: sales activities.)
Don't track 15 KPIs. Track 5-7 that your team actually reviews weekly.
Pre-Revenue vs. Post-Revenue Dashboards
Not all sales dashboards serve the same purpose. The distinction that matters is timing relative to the deal.
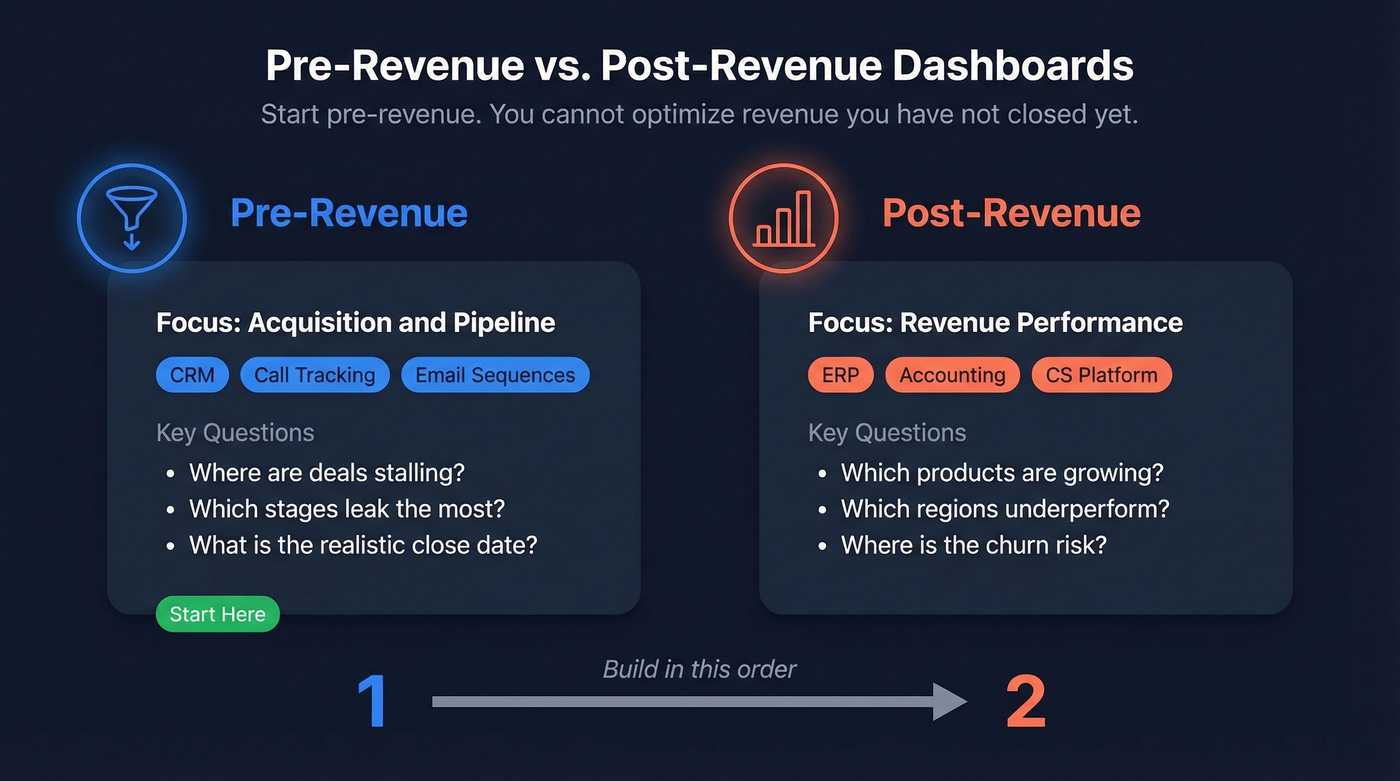
Pre-revenue dashboards focus on acquisition and pipeline. They pull from your CRM, call tracking, and email sequence tools. The goal is forecasting and bottleneck detection - where are deals stalling, which stages leak, and what's the realistic close date? These are the dashboards your frontline managers should live in. (If your stages are messy, fix your B2B sales pipeline management first.)
Post-revenue dashboards shift to revenue performance by product, region, and customer segment. They pull from ERP and accounting systems - which products are growing, which regions are underperforming, where's the churn risk?
We've watched sales orgs build post-revenue dashboards first because they look impressive in board decks. That's backwards. You can't optimize revenue you haven't closed yet. Start pre-revenue.
Your pipeline velocity metric is meaningless if 25% of contacts have changed jobs. Prospeo refreshes 300M+ profiles every 7 days - not the 6-week industry average - so your CRM reflects reality and your dashboards actually drive decisions.
Clean data in, accurate BI out. Start with 75 free verified emails.
The Data Quality Problem
Your SDR team sent 5,000 emails last month. 1,200 bounced. That's not a messaging problem - it's a data problem.
B2B contact records decay at roughly 30% per year. People change jobs, companies get acquired, email domains rotate. When the data feeding your dashboards is stale, every metric downstream drifts. Pipeline velocity looks healthy until you realize 25% of those "opportunities" are attached to contacts who left the company six months ago.
This is where your data layer matters more than your visualization layer. Tools like Prospeo refresh data on a 7-day cycle versus the 6-week industry average, deliver 98% email accuracy, and cost about $0.01 per lead with no contracts. Pair that kind of freshness with your CRM enrichment workflow and your dashboards actually reflect reality - which is the entire point of investing in BI infrastructure. (If you’re comparing vendors, start with data enrichment tools and verified contact databases.)

If your average deal size is under five figures, you probably don't need a $40K data platform. You need accurate emails, direct dials, and a CRM that isn't full of ghosts. Solve the data layer first, then worry about visualization. (More options: B2B list providers.)
Choosing the Right Tools
Pick one per category and prove it works before expanding.
| Tool | Category | Starting Price | Best For |
|---|---|---|---|
| Prospeo | Data & Intelligence | Free tier; ~$0.01/email | Verified contacts at ~90% lower cost than enterprise platforms |
| ZoomInfo | Data & Intelligence | ~$15K-$40K+/yr | Large B2B database plus intent/workflow modules |
| Power BI | BI Visualization | $9.99/user/mo | Budget-friendly dashboards |
| Tableau | BI Visualization | From $70/user/mo | Advanced visual analytics |
| Gong | Conversation Intel | ~$1,600/user/yr + platform fee | Deal coaching, call analysis |
| HubSpot Sales Hub | CRM + Execution | From $50/mo | SMB all-in-one CRM |
| Outreach | Sales Execution | ~$100-$150/user/mo | Sequence automation at scale |
Power BI is the obvious starting point for teams without a dedicated BI analyst. At $9.99/user/month, it's a low-friction way to build and share dashboards without turning BI into a six-month project. In our experience, it handles 80% of what sales teams need from a visualization tool.
Gong earns its price tag if you have enough call volume to train its models. It's conversation intelligence rather than BI in the traditional sense, but the deal insights it surfaces feed directly into your pipeline health metrics. The coaching use case alone justifies the spend for teams running 50+ calls per week.
Skip ZoomInfo if your team is under 10 reps and you aren't using intent data or workflow modules. At $15K-$40K+ per year, a common Reddit complaint is paying for features that sit unused. For contact data specifically, you can get 98% email accuracy at a fraction of the cost with self-serve platforms. (If you’re building a lean stack, see pay-as-you-go B2B data.)
Outreach's AI tools shave 11 days off sales cycles on deals over $50K - worth evaluating if sequence automation is your bottleneck.
Why Most Implementations Fail
We've seen the same four patterns kill BI projects repeatedly:
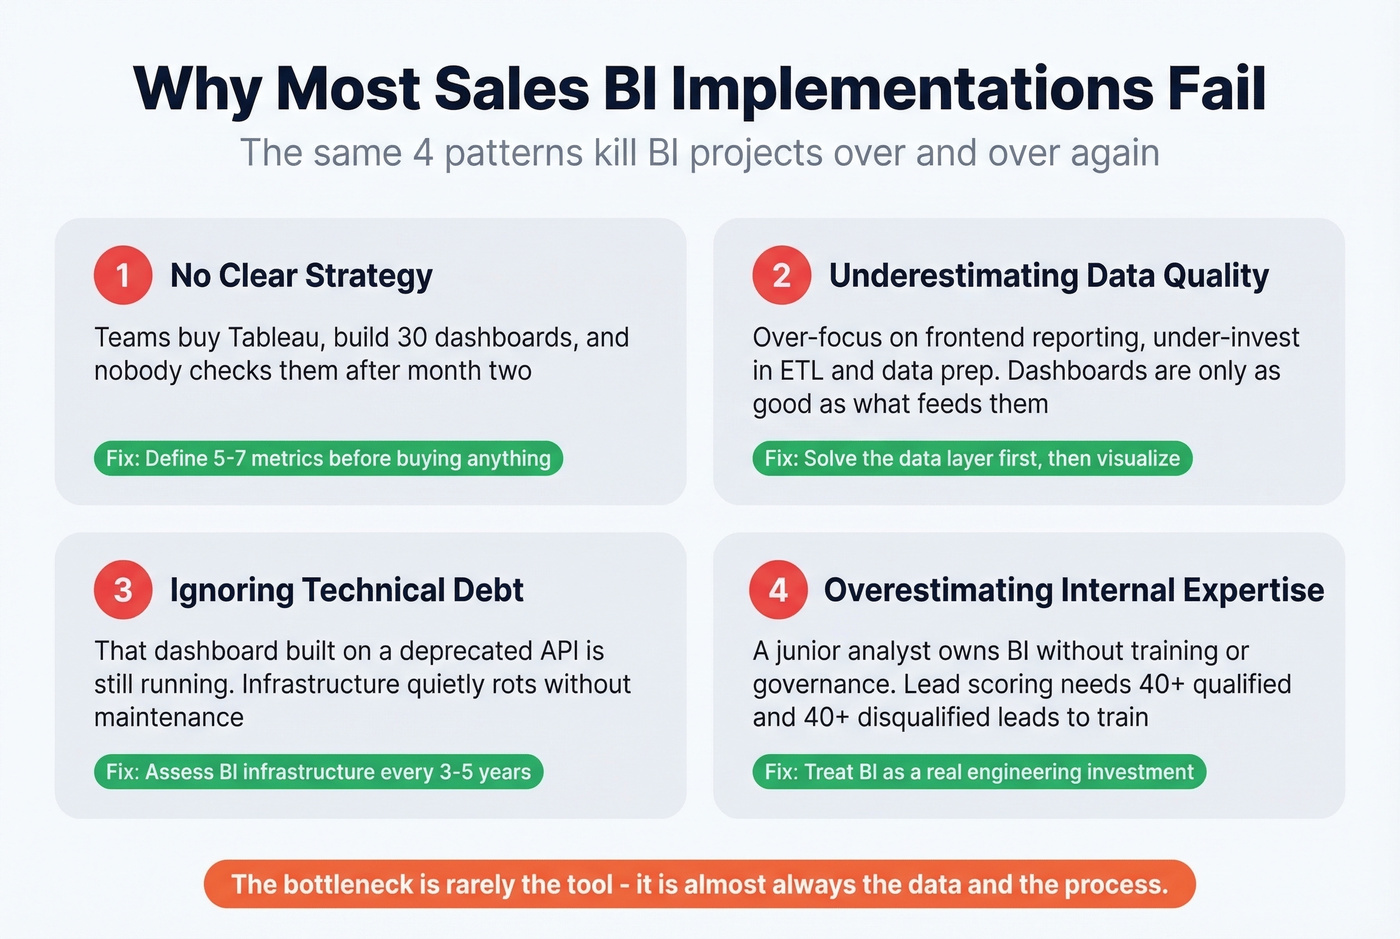
No clear strategy. BI becomes generic tools without concrete objectives. Teams buy Tableau, build 30 dashboards, and nobody checks any of them after month two. Define 5-7 metrics before you buy anything.
Underestimating data quality. Teams over-focus on frontend reporting and under-invest in ETL and data prep. Your dashboards are only as good as what feeds them. Even the most sophisticated analytics won't compensate for garbage inputs. (This is why the benefits of data enrichment show up directly in pipeline metrics.)
Ignoring technical debt. That dashboard built on a deprecated API? It's still running. Assess your BI infrastructure every 3-5 years and budget annually for code reviews. This sounds boring. It's also the difference between a BI stack that compounds in value and one that quietly rots.
Overestimating internal expertise. I've seen companies hire a junior analyst to "own BI" without training or governance. Lead scoring alone requires at least 40 qualified and 40 disqualified leads to train models effectively. This stuff isn't plug-and-play - treat it like a real engineering investment or don't bother.
What's Next: AI Agents in Sales
Gartner predicts 40% of enterprise applications will feature AI agents by end of 2026, up from less than 5% in 2025. These aren't rules-based automations. AI agents perceive customer signals, reason about optimal actions, and recommend multi-step workflows - fundamentally different from "if lead score > 80, send email."
Let's be honest: 45% of teams are already running hybrid AI-SDR models. The shift already happened. The teams that benefit most are the ones with clean data infrastructure already in place. An AI agent built on stale contacts is just a faster way to burn your domain reputation. (If you’re evaluating tools, start with AI SDR software.)
Business intelligence for sales isn't about more dashboards - it's about fewer, better metrics fed by data you can trust. Get the data layer right, track 5-7 KPIs with discipline, and layer in AI when the foundation is solid.
You don't need a $40K data platform to power sales intelligence. Prospeo delivers 98% email accuracy and 125M+ verified mobiles at $0.01 per lead - with native HubSpot and Salesforce integrations that keep your BI stack fed with fresh data.
Stop building dashboards on top of decayed data. Fix the foundation first.
FAQ
What's the difference between business intelligence and sales intelligence?
BI analyzes internal performance data - pipeline, revenue, rep activity - to forecast outcomes and spot bottlenecks. Sales intelligence gathers external data like verified contact info and buyer intent signals to identify prospects. Most B2B teams need both, but they're separate budget lines solving different problems.
How many KPIs should a sales BI dashboard track?
Start with 5-7 core metrics: pipeline velocity, win rate, average sales price, sales cycle length, and activity-to-close ratio. Teams that track fewer metrics with weekly discipline consistently outperform those drowning in 15+ dashboards nobody checks.
What's a good data tool for sales teams on a budget?
Prospeo offers 75 free email credits per month with 98% accuracy and a 7-day data refresh cycle - strong for teams that need reliable contacts without enterprise pricing. Power BI at $9.99/user/month handles visualization. Together they cost under $15/month versus $15K+ for a bundled enterprise platform.
What's a realistic budget for sales intelligence tools?
Power BI starts at $9.99/user/month for visualization. Self-serve data platforms run about $0.01 per verified email. Enterprise platforms like ZoomInfo typically cost $15,000-$40,000+ per year depending on seats and modules - overkill for teams under 10 reps who aren't using intent data or advanced workflow automation.