CAC Calculator: Your True Cost Per Customer in 2026
You just ran your CAC number and got $200. Feels great - until you realize you forgot to include your two SDRs, your HubSpot subscription, and the agency retainer. The real number is closer to $900. That's not a rounding error; it's a 4.5x gap that changes every decision downstream.
The calculator below gives you the real number. No signup, no email gate - just plug in your costs and get an answer you can actually trust.
How the Calculator Works
Start with your total marketing and sales costs for a given period, then enter the number of new customers you acquired in that same window. Toggle the Fully-Loaded Cost Builder to break your spend into line items - salaries, commissions, ad spend, CRM/tools, marketing automation, content production, agency fees, events/travel, and allocated overhead.
Optionally, enter your customer lifetime value (LTV) to get an automatic LTV:CAC ratio.
The quick formula: CAC = (Total marketing costs + Total sales costs) / New customers acquired. But if you only count ad spend, you're often understating your real CAC by around 4-5x. Use the calculator, then keep reading for industry benchmarks, the full cost checklist, and the payback period formula that tells you how long until you break even.
The CAC Formula Explained
The formula itself is simple:
CAC = (Total Sales Costs + Total Marketing Costs) / New Customers Acquired
Here's a worked example from NetSuite's breakdown: a company spends $30,000 on sales salaries and commissions, $10,000 in allocated overhead, $45,000 on marketing and advertising, $8,000 on marketing tools, and $7,000 on agency fees in a quarter. That's $100,000 total. They acquired 1,250 new customers. CAC = $80.
Simple math. The hard part isn't the division - it's knowing what goes in the numerator.
One edge case worth calling out: if you acquire zero customers in a period, your acquisition cost is technically infinite. Every dollar spent was wasted. That's not a math trick. It's a signal to stop spending and fix your funnel before you resume.
Why Your CAC Is Probably Wrong
Most teams calculate customer acquisition cost by dividing ad spend by new customers and calling it a day. That number is real, but it's not CAC. It's a fraction of CAC wearing a trench coat.
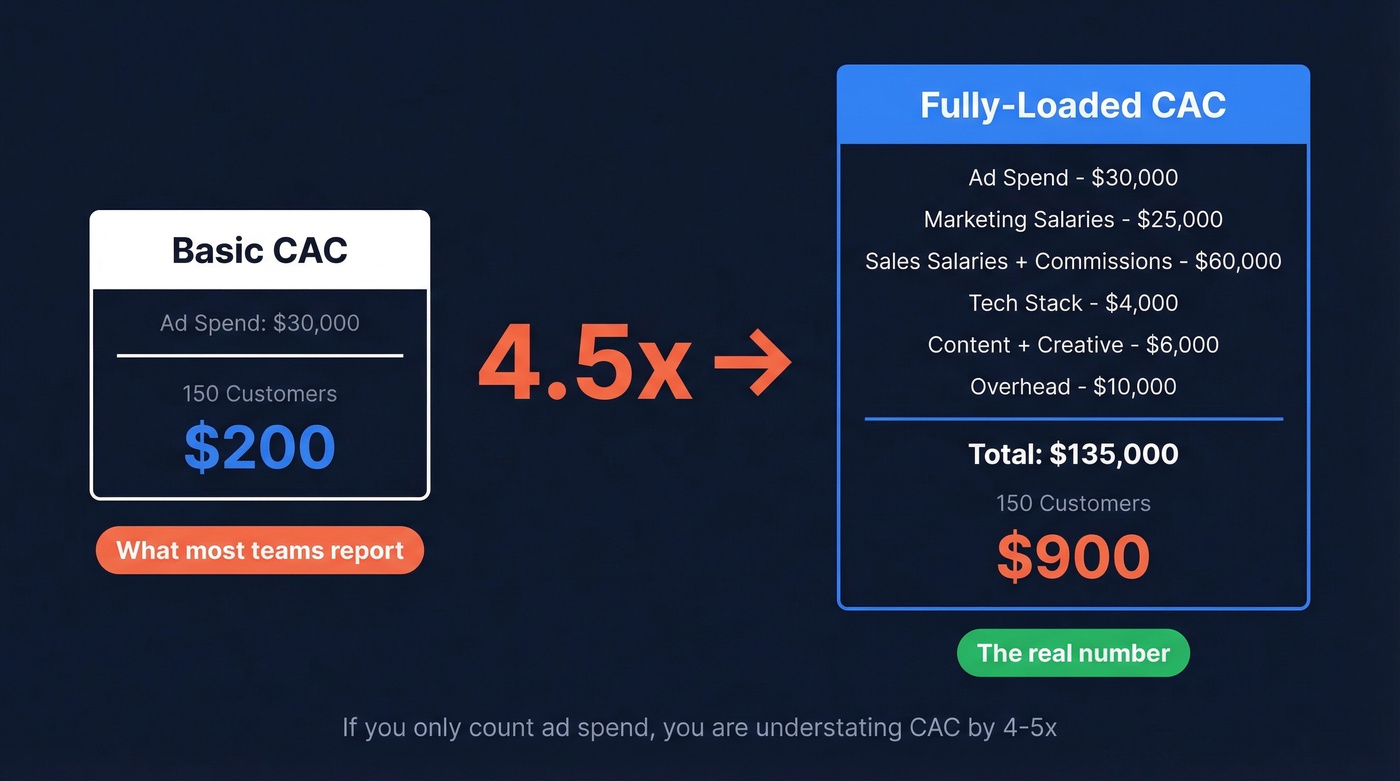
Monday.com's blog walks through a perfect example. A company spends $30,000/month on ads and acquires 150 customers. Basic CAC: $200. Now add the costs they forgot - marketing salaries ($25K), sales salaries and commissions ($60K), tech stack ($4K), content and creative ($6K), overhead ($10K). The fully-loaded monthly spend is $135,000. Real CAC: $900. That's 4.5x higher than the number they were reporting to the board.
Here's the full cost checklist. If you're not including all of these, your number is understated:
- Ad spend - search, social, display, retargeting
- Marketing salaries - demand gen, content, ops
- Sales compensation - base + commissions + bonuses
- CRM and sales tools - $50-$500/user/mo for platforms like Salesforce, Outreach, Gong
- Marketing automation - $200-$2,000/mo for HubSpot, Marketo, Pardot
- Sales intelligence tools - $0-$1,500/user/mo for ZoomInfo, Apollo, etc.
- Content production - writers, designers, video
- Agency and contractor fees
- Allocated overhead - office space, IT, management time
- Events and travel - conferences, dinners, trade shows
The point is simple: customer acquisition cost is widely misunderstood because people leave out SDR salaries, CRM subscriptions, and outsourced prospecting costs. The formula is easy. The discipline of capturing every cost is where teams fail.
Free resource: We've built a Google Sheets CAC tracking template with monthly columns for every cost category above, plus automatic blended CAC, channel CAC, LTV:CAC, and payback period calculations. No email gate - just copy and start tracking.
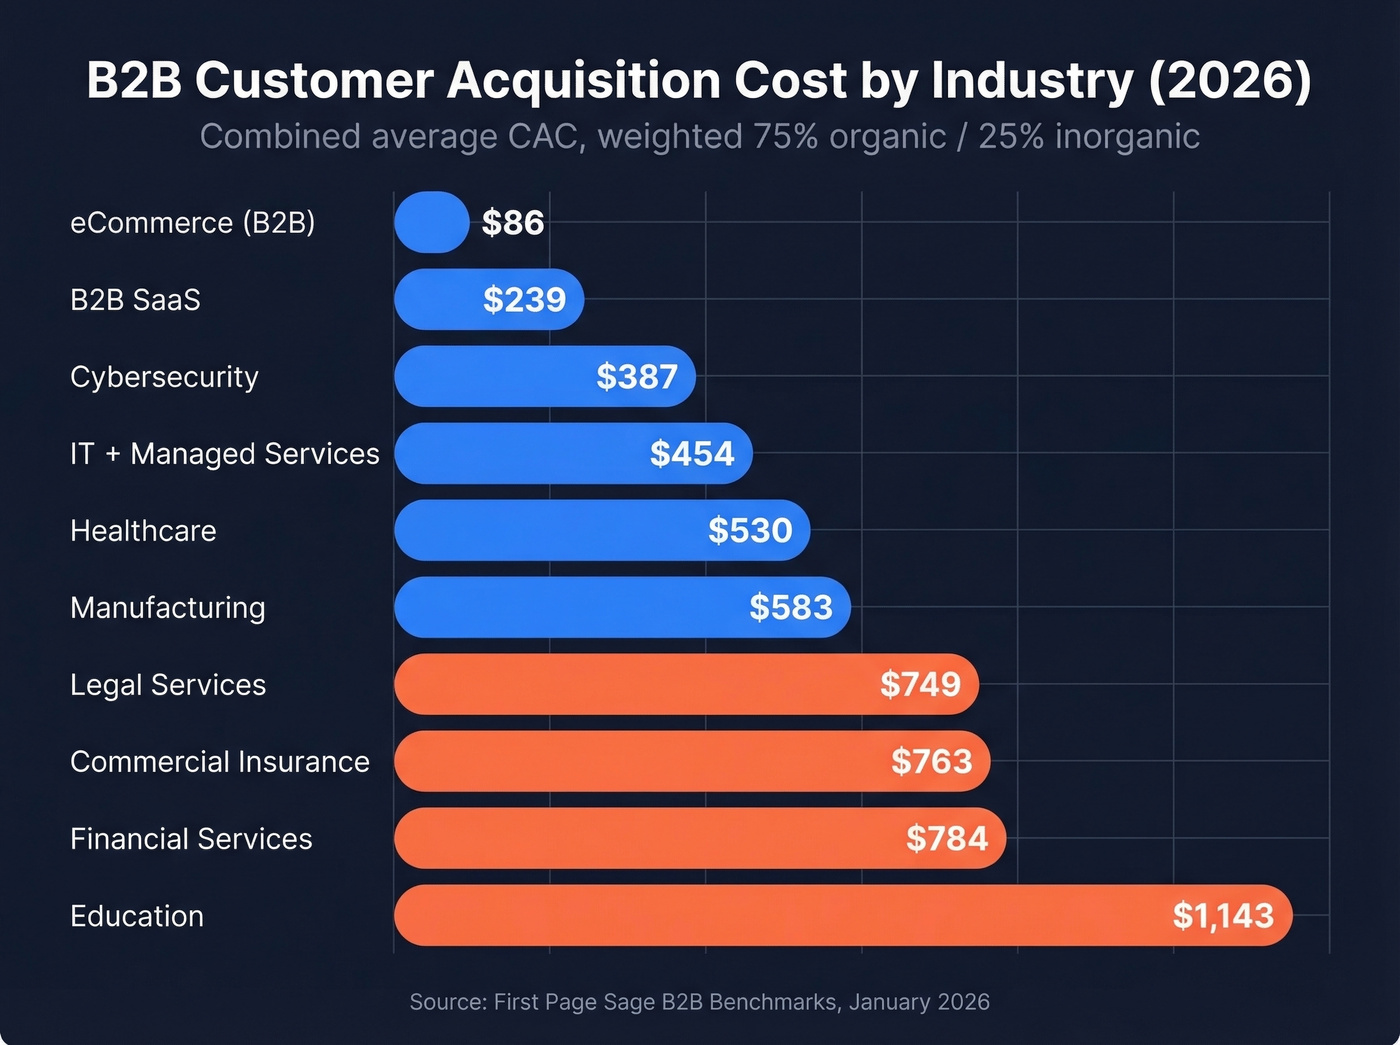
Industry Benchmarks (2026)
Knowing your number means nothing without context. Here's how it stacks up by industry, based on First Page Sage's B2B benchmarks updated January 2026:
| Industry | Organic CAC | Inorganic CAC | Combined Avg |
|---|---|---|---|
| eCommerce (B2B) | $87 | $81 | $86 |
| B2B SaaS | $205 | $341 | $239 |
| IT & Managed Services | $325 | $840 | $454 |
| Cybersecurity | $345 | $512 | $387 |
| Healthcare | $357 | $1,049 | $530 |
| Financial Services | $644 | $1,202 | $784 |
| Manufacturing | $475 | $905 | $583 |
| Legal Services | $584 | $1,245 | $749 |
| Commercial Insurance | $590 | $1,280 | $763 |
| Education | $862 | $1,985 | $1,143 |
A note on methodology: the combined average is weighted 75% organic / 25% inorganic, reflecting First Page Sage's client mix. If your spend skews heavily toward paid, your numbers will look more like the inorganic column.
For e-commerce (B2C): expect $10-$40 for low-ticket products, $35-$150 for mid-ticket, and $120-$500 for high-ticket items.
Now layer in stage and deal size, which matter just as much as industry.
SaaS CAC by Stage
| Stage | CAC Range |
|---|---|
| Early-stage | $500-$2,000 |
| Growth-stage | $1,000-$3,000 |
| Enterprise | $2,500-$12,000 |
The SaaS calculation varies dramatically by stage because early-stage companies rely on founder-led sales with minimal overhead, while enterprise teams carry expensive SDR orgs and multi-month deal cycles.
B2B CAC by Deal Size
| Deal Size | CAC Range |
|---|---|
| Small ($5K-$25K) | $1,500-$6,000 |
| Mid-market ($25K-$100K) | $6,000-$20,000 |
| Enterprise ($100K+) | $20,000-$75,000 |
Here's the thing: a $2,000 acquisition cost is terrible if you're selling $5K deals and great if you're selling $50K deals. The number only means something relative to what a customer is worth.
Benchmarks by Channel
Not all channels cost the same. Here's what the data shows for B2B, drawn from the Optifai Sales Ops Benchmark analyzing 939 B2B companies:
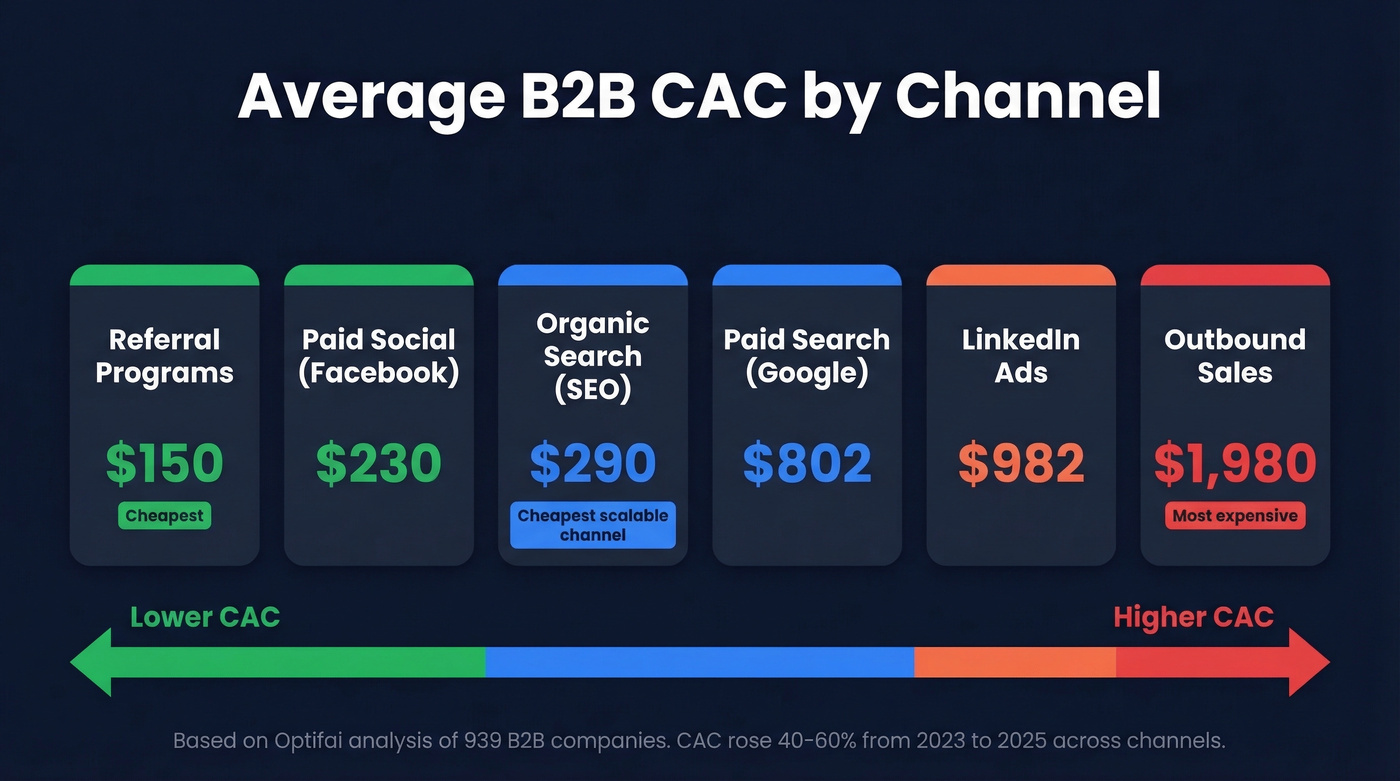
| Channel | Avg B2B CAC |
|---|---|
| Referral Programs | $150 |
| Paid Social (Facebook) | $230 |
| Organic Search (SEO) | $290 |
| Paid Search (Google) | $802 |
| LinkedIn Ads | $982 |
| Outbound Sales | $1,980 |
CAC rose 40-60% from 2023 to 2025 across channels, driven by privacy changes, rising ad costs, and attribution fragmentation. That trend isn't reversing.
Referrals are the cheapest channel at $150. If you don't have a referral program, that's your first move - it's not even close. SEO is the cheapest scalable channel at $290, though First Page Sage's dataset pegs thought-leadership SEO CAC at $647 depending on content investment. Either way, budget 4-6 months of runway before it pays off.
Outbound is the most expensive channel at $1,980 - and bad contact data makes it worse. Every bounced email and dead phone number is acquisition cost with zero return. We've seen teams cut outbound CAC by 30-40% just by switching to verified contact data and dropping bounce rates from 20-40% down to under 5%.
To tighten the rest of your funnel math, it helps to track funnel metrics alongside CAC so you can see where spend is leaking.
Every bounced email and dead phone number inflates your CAC with zero return. Prospeo delivers 98% verified emails at $0.01 each and 125M+ direct dials with a 30% pickup rate - so every dollar of outbound spend actually reaches a real buyer.
Cut your outbound CAC by fixing the data, not the strategy.
LTV:CAC Ratio
Your acquisition cost alone doesn't tell you if you're healthy. You need the ratio of customer lifetime value to acquisition cost.
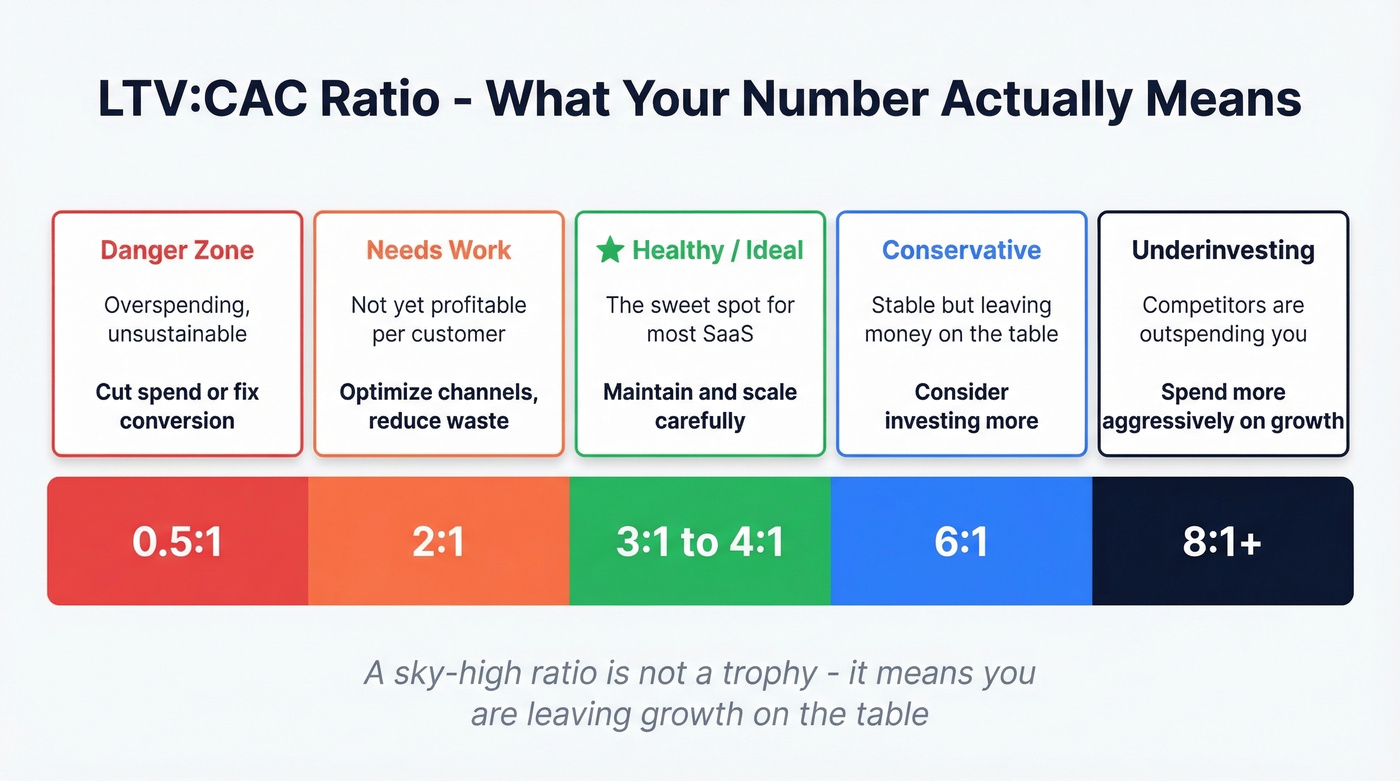
| Ratio | What It Means | What to Do |
|---|---|---|
| 0.5:1 | Overspending, unsustainable | Cut spend or fix conversion |
| 2:1 | Needs improvement | Optimize channels, reduce waste |
| 3:1-4:1 | Healthy / ideal | Maintain and scale carefully |
| 6:1 | Stable but conservative | Consider investing more |
| 8:1+ | Underinvesting in growth | Spend more aggressively |
A sky-high LTV:CAC ratio isn't a trophy - it means you're leaving growth on the table. We've seen teams celebrate a 10:1 ratio while competitors with a 3.5:1 ratio were eating their market share by spending more aggressively on acquisition.
View LTV:CAC on an annual timeframe to smooth out lag and seasonality, especially if you invest in SEO or content that takes 4-6 months to produce results.
CAC Payback Period
Payback tells you how many months until a customer has paid back their acquisition cost. Think of it as CAC debt - until payback, you're underwater on that customer.
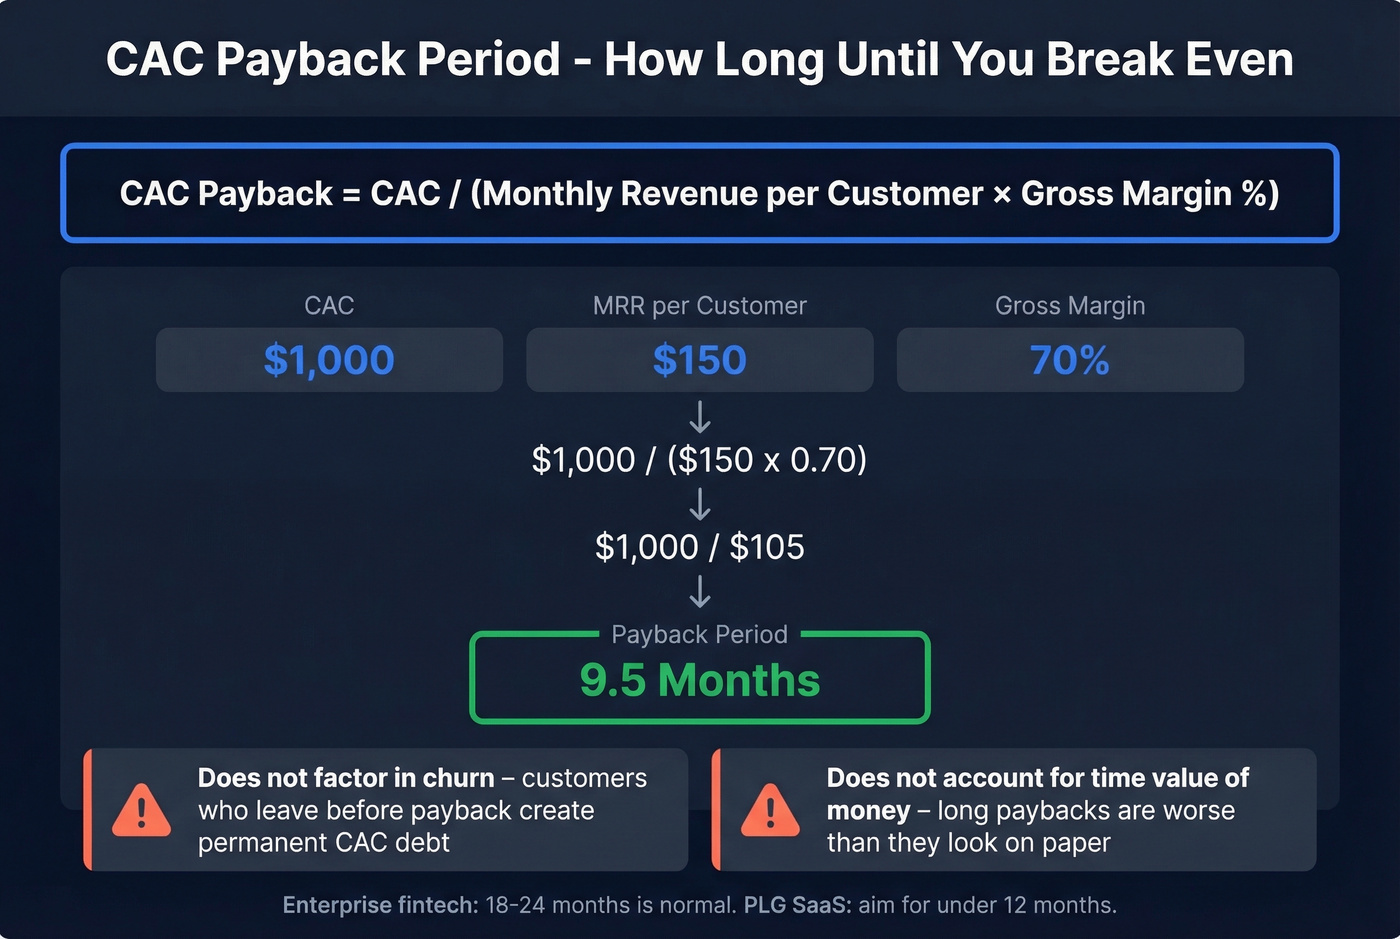
Formula: CAC Payback = CAC / (Monthly Revenue per Customer x Gross Margin %)
Worked example: CAC is $1,000. MRR per customer is $150. Gross margin is 70%. Payback = $1,000 / ($150 x 0.70) = 9.5 months.
Two caveats most calculators ignore. Payback doesn't factor in churn - customers who leave before payback create permanent CAC debt. And it doesn't account for the time value of money, which makes long paybacks worse than they appear on paper. Enterprise fintech companies commonly see 18-24 month payback periods due to long sales cycles, and that's expected. But if you're a PLG SaaS company with 18-month payback, something's broken.
Blended vs. Channel CAC
These are two different numbers that answer two different questions.
Blended CAC = total sales and marketing spend / total new customers. This is your board metric - the number investors and executives care about. It tells you the overall efficiency of your go-to-market engine.
Channel CAC = channel-specific costs / customers acquired from that channel. This is your operator metric - the number that tells you where to shift budget.
When should you start tracking channel-level costs? Per Glen Coyne's framework, it becomes necessary around $10K-$15K/month in marketing spend and a priority at $20K+/month.
For getting started, use last-touch attribution. It's imperfect but actionable. Enforce UTM discipline across every campaign with utm_source, utm_medium, and utm_campaign on every link. Allocate soft costs like salaries and tools by time-spent percentage per channel. Perfect attribution doesn't exist - good-enough attribution that you actually use beats a multi-touch model nobody trusts.
If you're building this out with RevOps, a simple sales operations metrics dashboard can keep CAC, pipeline, and conversion in one place.
5 Mistakes That Wreck Your CAC
Stop obsessing over lowering your number. Start obsessing over whether you're measuring it correctly.
1. Only counting ad spend. This is the $200-vs-$900 problem from earlier. If your calculation doesn't include salaries, tools, commissions, and overhead, it's fiction. Use the total acquisition cost formula - every dollar that touches the sales and marketing engine belongs in the numerator.
2. Ignoring conversion lag. If your sales cycle is 90 days but you're measuring monthly, your numbers will spike wildly - you're matching this month's spend against last quarter's conversions. The fix: use a 90-day rolling window aligned to your average sales cycle length.
3. Lumping retention spend into acquisition. Brand campaigns, customer marketing, and retention programs shouldn't be in your numerator. If a campaign targets existing customers, it's not acquisition cost.
4. Treating CAC as one static number. A blended figure of $500 is meaningless if your SEO CAC is $200 and your outbound CAC is $2,500. Segment by channel, ICP, product line, and region. The blended number is for the board. The segmented numbers are for decisions.
5. Using bad contact data for outbound. This one's invisible in most calculations, but it's real. If 20% of your outbound emails bounce, you're paying for wasted sends, damaged sender reputation, and dead follow-up sequences - all of which inflate your cost per meeting. Snyk's outbound team dropped bounce rates from 35-40% to under 5% and grew AE-sourced pipeline 180% after switching to Prospeo's verified contact data. That's the difference between outbound CAC of $1,980 and something meaningfully lower.
How to Reduce Your CAC
With acquisition costs rising structurally across channels, the companies winning aren't just spending more. They're measuring cost at the channel level and cutting waste where it matters most.
Build a referral program. At $150 vs $1,980 for outbound, referrals are the single highest-impact channel. Even a basic program - a discount, a gift card, a mutual introduction incentive - moves the needle.
Invest in SEO. At $290, organic search is the cheapest scalable channel. It takes 4-6 months to compound, so start now and measure on an annual timeframe.
Fix your data quality before scaling outbound. This is where most teams burn money. Scaling outbound with a 20-40% bounce rate is like pouring water into a bucket with holes. Fewer bounces mean more live conversations and a lower cost per acquired customer. If you want to go deeper on the mechanics, start with email bounce rate benchmarks and fixes.
Tighten ICP targeting. Every dollar spent on a bad-fit lead is pure waste. Define your ICP tightly - by industry, headcount, tech stack, funding stage - and ruthlessly disqualify everything outside it. A simple ideal customer profile scoring rubric makes this measurable.
Shorten sales cycles. Faster deals mean lower acquisition costs. Better qualification upfront, multi-threading into accounts, and faster follow-up all compress the timeline. A deal that closes in 45 days instead of 90 can cost roughly half as much in sales time.
Let's be honest about tool spend, too. If your average deal is under $15K, you probably don't need a $15K-$40K/year data platform. A credit-based tool with verified emails and a free tier will get you 80% of the way there at 10% of the cost. Don't let your sales intelligence spend become the very cost bloat you're trying to fix. If you're evaluating options, compare data enrichment services and sales prospecting databases based on accuracy and total cost per usable contact.
You just saw that outbound CAC averages $1,980 - and bad data makes it worse. Teams using Prospeo drop bounce rates from 35%+ to under 4% and book 35% more meetings than Apollo users. That's not a marginal improvement; it fundamentally changes your unit economics.
Stop paying acquisition costs on emails that bounce.
FAQ
How do you calculate CAC?
Add every dollar spent on sales and marketing in a period - salaries, tools, ads, agencies, overhead - then divide by new customers acquired in that window. The formula: (Total Sales Costs + Total Marketing Costs) / New Customers Acquired. Most teams undercount by 4-5x because they forget salaries and tooling.
What's a good CAC for SaaS?
Early-stage SaaS companies typically see $500-$2,000; growth-stage $1,000-$3,000; enterprise $2,500-$12,000. The number means nothing without your LTV:CAC ratio - aim for 3:1 or better. Include all go-to-market costs, not just ad spend.
What's the difference between CAC and CPA?
CPA measures a single conversion event like a lead or signup. CAC measures the full cost of acquiring a paying customer, including all sales and marketing expenses across the entire funnel. CAC is always higher than CPA - often by 3-5x.
How does data quality affect CAC?
Directly. If 20% of your outbound emails bounce, you're paying for wasted sends, damaged sender reputation, and dead follow-up sequences. Verified contact data with 98%+ email accuracy cuts that waste before you hit send, lowering your cost per meeting and overall outbound acquisition cost.
How often should I recalculate CAC?
Monthly at minimum, but align your reporting window to your sales cycle. If your average deal takes 90 days, use a 90-day rolling window to avoid timing distortions that make your numbers look artificially high or low.